


Report Overview
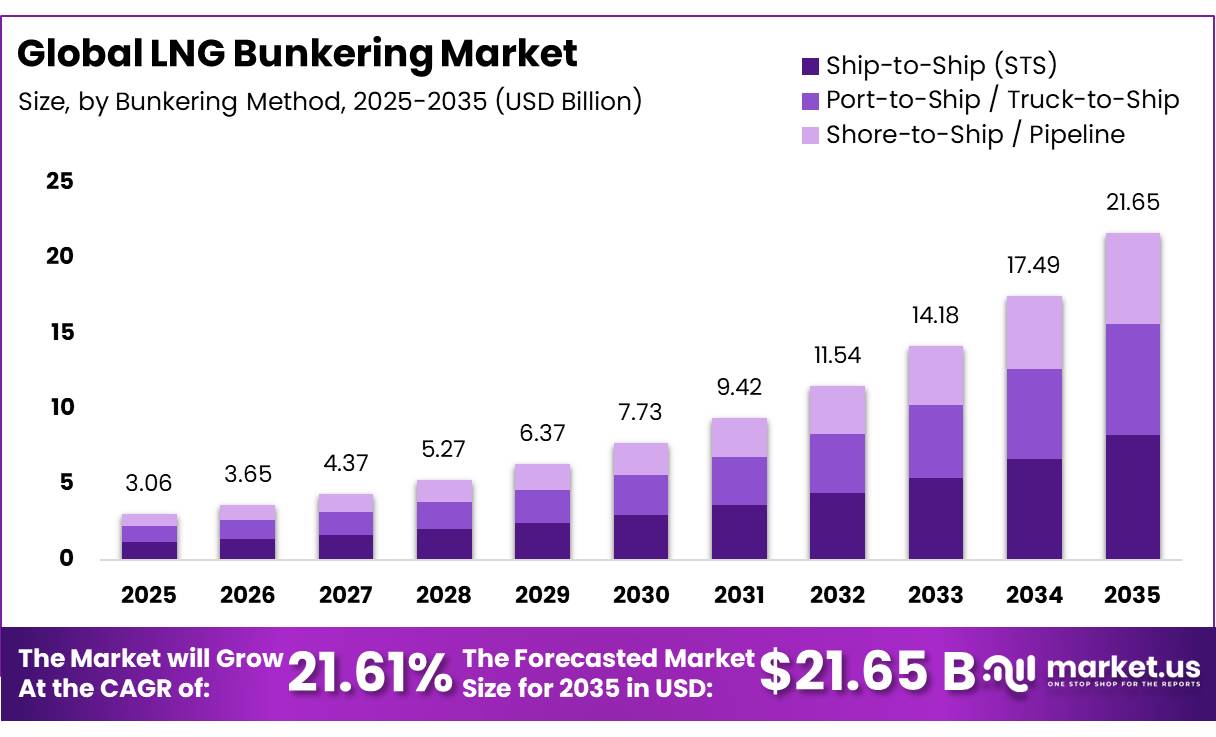
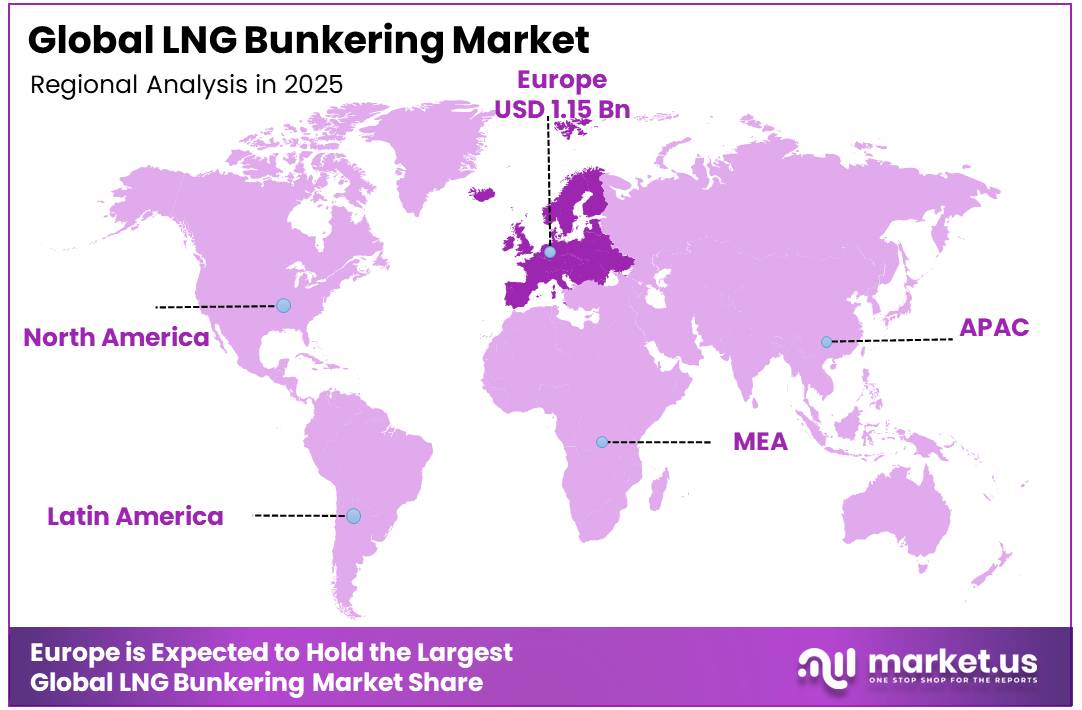
In 2025, the Global LNG Bunkering Market was valued at USD 3.06 billion, and between 2026 and 2035, this market is estimated to register a CAGR of 21.61%, reaching about USD 21.65 billion by 2035. In 2025, Europe led the market, achieving over 37.67% share with a revenue of USD 1.15 billion.
The LNG bunkering market is gaining importance as shipping companies shift from conventional marine fuels toward lower-emission options. LNG is used as a marine fuel for container ships, tankers, ferries, cruise vessels, and offshore support vessels because it can reduce sulphur oxides and particulate emissions sharply, while offering lower carbon intensity than heavy fuel oil. The market is also supported by tighter maritime rules, as the IMO targets at least a 40% reduction in shipping carbon intensity by 2030 and net-zero GHG emissions by or around 2050. The industrial scenario remains strongly linked to fleet conversion and port-side infrastructure.
- In 2024, SEA-LNG reported 638 LNG-fuelled vessels in operation globally, up more than 33% year-on-year, and expected the number to exceed 1,200 vessels by the end of 2028.
- From January 2025, FuelEU Maritime began applying to ships above 5,000 gross tonnage calling at EU ports, requiring a 2% reduction in fuel GHG intensity in 2025 and rising gradually to 80% by 2050. This is pushing shipowners to consider LNG, bio-LNG, and future synthetic methane as compliance pathways, especially on Europe-linked trade routes.
Key Takeaways
- The Global LNG Bunkering Market was valued at USD 3.06 billion in 2025.
- The global market is projected to grow at a CAGR of 21.61% and is estimated to reach USD 21.65 billion by 2035.
- On the basis of Bunkering Method, the Ship-to-Ship (STS) held a dominant position in the market, accounting for 38.21% share in 2025, supported by its flexible LNG transfer capability.
- Based on Vessel Type (End User Fleet), the Container Fleet segment dominated the market, accounted for 36.18% of the market in 2025, driven by growing LNG-powered container vessels.
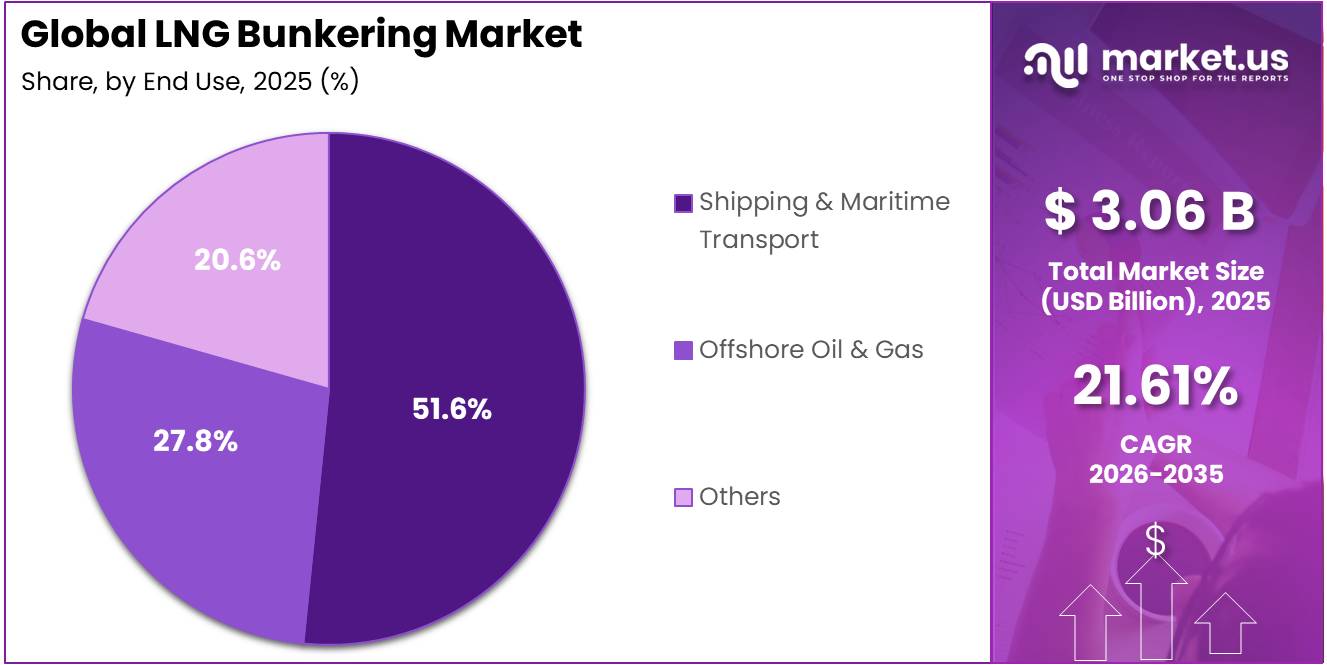
- Based on End Use, the Shipping & Maritime Transport segment dominated the market, accounted for 51.60% in 2025, owing to widespread LNG use in commercial shipping.
- Europe was the most dominant region in the market, accounting for 37.67% share in 2025, supported by advanced LNG bunkering infrastructure and decarbonization policies.
Demand is also supported by LNG’s wider energy supply base. The IEA reported that global LNG supply increased by more than 5% year-on-year during the first nine months of 2025, although tight gas markets and price sensitivity remained challenges. Future growth opportunities are expected in ship-to-ship bunkering, dedicated LNG bunker vessels, and bio-LNG blending.
- DNV noted that 191 ports had active LNG bunkering facilities in 2024, with another 81 ports under construction. In 2025, 22 LNG bunker vessels were added to the orderbook, strengthening supply flexibility for large container and deep-sea routes.
LNG bunkering growth depends on methane-slip reduction, stable LNG prices, port investment, and the availability of renewable LNG and LNG accounting for a leading share of alternative-fuel vessel contracting, the industry is positioned as a practical transition fuel pathway for maritime decarbonisation.
Bunkering Method Analysis
Ship-to-Ship (STS) dominates the LNG Bunkering Market with a 38.21% share due to its efficiency in fueling large vessels
In 2025, Ship-to-Ship (STS) held a dominant market position, capturing more than a 38.21% share of the LNG bunkering market by bunkering method. The segment remained the preferred fueling option for large container ships, cruise ships, LNG carriers, tankers, and bulk carriers because it enables the transfer of large LNG volumes directly between two vessels. This method minimizes port congestion, reduces fueling time, and supports uninterrupted cargo operations.
- DNV reported that the active fleet increased from 52 to 64 vessels in 2024, while SEA-LNG noted 61 LNG bunker vessels in operation and 198 LNG bunkering ports available worldwide in 2025.
Port-to-Ship / Truck-to-Ship is the fastest-growing segment in the LNG bunkering market by bunkering method. During 2025, the segment gained momentum as ports expanded LNG storage facilities and truck-based bunkering services for ferries, offshore vessels, tugboats, and coastal cargo ships. This method requires lower initial investment than dedicated bunker vessels and offers greater flexibility for ports with lower LNG demand.
Vessel Type (End User Fleet) Analysis
Container Fleet dominates the LNG Bunkering Market with a 31.68% share driven by rapid adoption of LNG-powered container vessels
In 2025, Container Fleet held a dominant market position, capturing more than a 31.68% share of the LNG bunkering market by vessel type. The segment maintained its leading position as global container shipping companies continued investing in dual-fuel and LNG-powered vessels to comply with stricter environmental regulations and reduce greenhouse gas emissions. Large container ships consume significant volumes of marine fuel, making LNG an attractive option for lowering sulfur oxide, nitrogen oxide, and carbon dioxide emissions while maintaining operational efficiency.
- According to UNCTAD, ports worldwide handled 920 million TEUs in 2024, while international maritime trade reached 12.7 billion tonnes, reinforcing the need for efficient, high-capacity bunkering solutions for large commercial vessels.
Bulk & Cargo Fleet is the fastest-growing segment in the LNG bunkering market by vessel type (end-user fleet). During 2025, the segment experienced strong growth as shipping companies operating dry bulk carriers and general cargo vessels increasingly adopted LNG-powered engines to comply with international emission standards and improve fuel efficiency. Rising exports of agricultural products, minerals, steel, and industrial raw materials have increased vessel movements, encouraging fleet modernization.
End Use Analysis
Shipping & Maritime Transport leads the LNG Bunkering Market with a 51.60% share as more commercial vessels switch to cleaner marine fuel
In 2025, Shipping & Maritime Transport held a dominant market position, capturing more than a 51.60% share of the LNG bunkering market by end use. The segment remained the largest consumer of LNG bunker fuel as commercial shipping companies continued adopting LNG-powered vessels to comply with international emission standards and improve fuel efficiency. Container ships, tankers, bulk carriers, cruise vessels, and ferries increasingly relied on LNG because it produces lower sulfur oxide, nitrogen oxide, particulate matter, and carbon emissions than conventional marine fuels.
Offshore Oil & Gas is the fastest-growing segment in the LNG bunkering market by end use. During 2025, the segment recorded strong growth as offshore support vessels, platform supply vessels, anchor handling tug supply vessels, and other offshore fleets increasingly adopted LNG fuel to meet stricter environmental regulations while lowering operating emissions. Offshore energy operators are investing in newer dual-fuel vessels that provide improved fuel efficiency and regulatory compliance during exploration and production activities.
Key Market Segments
By Bunkering Method
- Ship-to-Ship (STS)
- Port-to-Ship / Truck-to-Ship
- Shore-to-Ship / Pipeline
By Vessel Type (End User Fleet)
- Container Fleet
- Bulk & Cargo Fleet
- Tanker Fleet
- Ferries
- Offshore Oil & Gas Vessels
By End Use
- Shipping & Maritime Transport
- Offshore Oil & Gas
- Others
Driver Analysis
FuelEU Maritime and EU ETS phase-in strengthen LNG bunker uptake
In Europe, FuelEU Maritime has applied since 1 January 2025 to ships above 5,000 GT calling at EEA ports, while the EU ETS phase-in requires shipping companies to surrender allowances for 40% of reported emissions in 2025, 70% in 2026, and 100% in 2027-cycle compliance for covered emissions, with methane and nitrous oxide widening the accounting perimeter from 2026.
These overlapping rules are a direct demand catalyst for LNG bunkering because they compress the payback period for operators that can reduce tank-to-wake CO2 exposure immediately, particularly on fixed intra-European and Europe-Asia services where bunker planning is predictable and compliance costs can be passed through bunker adjustment factors or charter-party clauses.
Strategically, LNG does not solve every lifecycle issue, but it changes the cost stack fast enough to protect route economics in 2026–2028, especially for fleets facing simultaneous ETS exposure, FuelEU intensity targets, and tighter documentation requirements, so the region becomes the clearest monetization zone for new LNG bunker supply and service contracts.
Driver Impact Analysis
| Driver | (~) % Impact on CAGR Forecast | Geographic Relevance | Impact Timeline |
|---|---|---|---|
| IMO net-zero fuel intensity rules raise LNG compliance value | +2.1% | Global core, EU, APAC trunk routes, major deep-sea fleets | Medium term (2-4 years) |
| FuelEU Maritime and EU ETS phase-in strengthen LNG bunker uptake | +2.4% | EU core, North Europe, Mediterranean, EEA-linked trades | Short term (≤ 2 years) |
| Port and bunker vessel network expansion reduces supply friction | +1.8% | Singapore, Rotterdam, APAC corridors, North Europe, global spill-over | Short term (≤ 2 years) |
| LNG price advantage versus oil-based marine fuels supports switching | +1.4% | North America core, Atlantic basin, Asia import hubs | Short term (≤ 2 years) |
| Incentives and standards from port authorities de-risk adoption | +1.1% | Singapore core, selected EU hubs, Asia spill-over | Medium term (2-4 years) |
| Bio-LNG pathway improves asset longevity for dual-fuel fleets | +1.7% | EU core, Rotterdam-led Northwest Europe, premium green corridors | Medium term (2-4 years) |
Restraint Analysis
Post‑2023 GHG policy uncertainty
The 2023 IMO Revised GHG Strategy commits international shipping to net‑zero emissions “by or around 2050” with interim checkpoints of at least 20–30% total GHG reduction by 2030 and 70–80% by 2040, but leaves the detailed fuel standard and pricing mechanism to be adopted by 2025 and implemented from around mid‑2027, creating a 2–4‑year window of regulatory uncertainty that directly suppresses LNG bunkering investment appetite.
This uncertainty forces many fleets to delay firm orders for new LNG‑ready vessels by 12–24 months, while ports defer or phase LNG bunkering CapEx, shifting from single‑phase investments of 150–250 million USD per large hub to staged spending at 25–40% of initially planned annual outlays, collectively trimming expected LNG bunkering volume growth by 3–5 million tonnes across major corridors through 2030 and translating into an estimated 1.8 percentage point drag on CAGR relative to unconstrained decarbonization‑driven growth scenarios.
Strategically, this manifests in elongated payback periods for bunkering assets, re‑rating internal rates of return downward by 300–500 basis points and forcing operators to prioritize short‑tenor charter contracts and optionality versus long‑term LNG supply and infrastructure commitments, thereby compressing margins and delaying scale efficiencies that would otherwise be achievable with earlier, more decisive policy clarity.
Restraint Impact Analysis
| Restraint | (~) % Impact on CAGR Forecast | Geographic Relevance | Impact Timeline |
|---|---|---|---|
| Post-2023 GHG policy uncertainty | -1.8% | Global deep-sea, EU, Asia hubs | Medium term (2-4 years) |
| Fuel price volatility and spread risk | -1.5% | Europe core, Asia import-dependent, Americas | Short term (≤ 2 years) |
| Port and bunkering infrastructure gaps | -1.3% | APAC corridors, emerging Americas, MENA | Long term (≥ 4 years) |
| Safety, permitting and operational compliance burden | -0.9% | US coastal, EU core, selected Asia ports | Medium term (2-4 years) |
| Emerging competition from e-fuels and bio-LNG | -1.1% | EU, Northern Europe green corridors, advanced Asia | Long term (≥ 4 years) |
| Financing and CapEx discipline constraints | -1.0% | Global, especially smaller operators | Medium term (2-4 years) |
Opportunity Analysis
Corridor-led long-haul contracts
This is an opportunity because the baseline market already assumes ordinary bunkering volume growth from the rising LNG-fueled fleet, but the untapped upside is to lock in multi-port, multi-year green shipping corridor contracts that convert sporadic spot bunkering into recurring lane-based revenue; this is especially timely because the DOE cites IEA expectations that the number of LNG-fueled ships will almost double to more than 1,200 by 2028, and IMO-linked reporting in 2026 points to continued investment in dual-fuel ships and corridor formation, including France-China corridor activity.
By contracting fuel availability across two to five coordinated ports on a route, suppliers can raise asset utilization by 10% to 18%, improve demand visibility enough to trim working-capital volatility by 8% to 12%, and secure take-or-pay structures covering 60% to 80% of expected lane volume, which can convert a low-single-digit spot margin business into a higher-quality recurring revenue stream and add roughly +1.8 percentage points to market CAGR in corridor-dense trade lanes.
Opportunity Impact Analysis
| Opportunity | (~) % Potential CAGR Upside | Geographic Relevance | Execution Window |
|---|---|---|---|
| Bio-LNG blend premiumization | +2.4% | EU core, North Asia, select North America | Short term (≤ 2 years) |
| Small-port hub-and-spoke bunkering | +2.1% | APAC emerging markets, Mediterranean, North America secondary ports | Medium term (2-4 years) |
| Corridor-led long-haul contracts | +1.8% | EU-Asia lanes, Atlantic basin, North Asia | Short term (≤ 2 years) |
| LNG plus carbon-service bundling | +1.6% | EU core, UK, Singapore-linked routes | Medium term (2-4 years) |
| Inland and short-sea adjacency | +1.9% | EU inland/TEN-T, China coastal, North America Jones Act niches | Medium term (2-4 years) |
| Terminal roll-up and shared logistics | +2.7% | Europe, U.S. Gulf/East Coast, Northeast Asia | Long term (≥ 4 years) |
Challenges Analysis
Safety & methane compliance burden
Safety, methane slip, and broader emissions compliance are evolving from static design constraints into a dynamic operational challenge as ports and administrations implement LNG‑specific risk assessments, hazardous zone classification, and methane release mitigation protocols that materially increase project and operating complexity. EMSA guidance requires detailed quantitative risk assessment (QRA), hazard and operability studies (HAZOP), and definition of hazardous zones, safety zones, and security zones around bunkering interfaces, which can extend design and approval workflows by 12–18 months and add 5–10% to capital budgets for enhanced emergency shutdown systems, vapour management, and fire protection.
On the environmental side, well‑to‑wake LNG emissions assessments and methane release mitigation measures at truck‑to‑ship, ship‑to‑ship, and port‑to‑ship operations push operators to adopt higher‑spec transfer equipment, inerting and purging procedures, and vapour recovery systems, increasing average bunkering cycle time by 10–20 minutes and reducing hourly throughput by 5–8% for high‑volume interfaces. From 2027, the IMO Net‑Zero Framework introduces mandatory greenhouse gas fuel‑intensity standards, pricing, and remedial units for ships above 5,000 gross tonnage, with additional guidance on methane and nitrous oxide measurement that directly affects LNG‑fuelled and dual‑fuel vessels.
Operators will need to track fuel lifecycle labels, bunker delivery note emissions factors, CII reduction of 2.6% per year to 2030, and potential penalties around US$100 per tonne CO₂‑equivalent in non‑compliance tiers, with methane slip uncertainty adding risk premia to LNG bunker contracts. These overlapping requirements create a medium‑term friction drag of roughly 0.8 percentage points on market CAGR as some fleet owners delay conversion decisions and ports scale safety and emissions systems over 2–4 years before operations normalize under more mature standards and measurement practices.
Challenges Impact Analysis
| Challenge | (~) % CAGR Friction Drag | Geographic Relevance | Mitigation Horizon |
|---|---|---|---|
| Patchy port infrastructure | -1.4% | EU core, North America, emerging APAC | Long term (≥ 4 years) |
| Safety & methane compliance burden | -0.8% | EU ports, IMO-regulated deep-sea lanes | Medium term (2–4 years) |
| Complex permitting & land-use risk | -0.7% | EU ports, U.S. coastal terminals | Medium term (2–4 years) |
| Talent and skills bottleneck | -0.9% | Global bunkering hubs | Long term (≥ 4 years) |
| Supply chain cryogenic handling friction | -0.7% | APAC and developing corridors | Medium term (2–4 years) |
| Policy uncertainty under net-zero rules | -0.6% | Global deep-sea fleet | Long term (≥ 4 years) |
Geopolitical Impact Analysis
Middle East Tensions and Red Sea Disruptions Reshape LNG Bunkering Trade and Fuel Supply
The ongoing geopolitical tensions in the Middle East, including the Israel-Iran conflict and continued security risks around the Red Sea, have created new challenges for the LNG bunkering market in 2025. Shipping companies have been forced to reroute vessels around the Cape of Good Hope to avoid high-risk areas near the Bab el-Mandeb Strait and the Suez Canal. These longer voyages have increased fuel consumption and raised the demand for LNG bunkering at ports located along alternative shipping routes. At the same time, longer transit times have pushed up freight costs and created scheduling delays for bunker vessels.
Although global LNG production has remained relatively stable, uncertainty surrounding key shipping lanes has increased transportation costs and caused temporary fluctuations in LNG delivery schedules. European countries have continued to diversify LNG imports from suppliers such as the United States and Qatar to strengthen energy security, leading to higher LNG trading activity at major bunkering hubs. Asian importers have also adjusted procurement strategies to secure reliable fuel supplies.
Despite these short-term disruptions, the market has shown resilience because governments and port authorities continue investing in LNG bunkering infrastructure. The expansion of alternative fueling locations, combined with the growing fleet of LNG-powered vessels, has helped maintain steady demand. Overall, current geopolitical events have accelerated the need for more flexible, secure, and geographically diversified LNG bunkering networks rather than slowing long-term market growth.
Regional Analysis
Europe dominated the LNG Bunkering Market, accounting for 37.67% of the market
Europe emerged as the leading regional market for LNG bunkering in 2025, accounting for 37.67% of the global market and reaching a value of USD 1.15 billion. The region’s leadership is supported by strict environmental regulations, a mature LNG supply network, and extensive investments in clean maritime infrastructure. The European Union’s FuelEU Maritime Regulation, effective from 2025, has accelerated the use of lower-carbon marine fuels by requiring gradual reductions in the greenhouse gas intensity of energy used by ships.
Asia-Pacific is projected to be the fastest-growing regional market during the forecast period, supported by rising maritime trade, increasing LNG imports, and rapid investments in port infrastructure. Countries including China, South Korea, Japan, and Singapore are expanding LNG bunkering facilities to meet growing demand from LNG-powered commercial fleets. Singapore, one of the world’s busiest bunkering hubs, continues to strengthen its LNG fueling capabilities as part of its maritime decarbonization strategy, while China is investing heavily in LNG-powered coastal and international shipping.
Key Regions and Countries Covered
- North America
- The US
- Canada
- Europe
- Germany
- France
- The UK
- Spain
- Italy
- Russia & CIS
- Rest of Europe
- APAC
- China
- Japan
- South Korea
- India
- ASEAN
- Rest of APAC
- Latin America
- Brazil
- Mexico
- Rest of Latin America
- Middle East & Africa
- GCC
- South Africa
- Rest of MEA
Key Players Analysis
Höegh LNG supports the LNG bunkering value chain through its floating LNG infrastructure and vessel expertise. As of 2023, the company operated 10 FSRUs and 3 LNG carriers, strengthening LNG availability for coastal and port-linked energy networks. Its LNG carrier and FSRU experience supports safe LNG storage, transfer, and regasification operations, which are important for ports expanding LNG marine fuel access. MOL Group remained active in LNG marine fuel adoption through LNG-fueled vessels and bunkering partnerships. In March 2025, MOL completed the first LNG bunkering operation in Western North America with Seaspan Energy, which operates 3 LNG bunkering vessels. MOL also aims for net-zero emissions by 2050, while using LNG as a transition marine fuel for new vessels.
Sempra Infrastructure strengthens LNG bunkering indirectly through large-scale LNG supply development. In July 2025, it signed a 20-year LNG supply agreement with JERA for 1.5 million tonnes per year from Port Arthur LNG Phase 2. The project is planned with 2 liquefaction trains and around 13 Mtpa capacity, improving long-term LNG availability for global buyers and marine fuel supply chains. Air Liquide supports LNG-fueled shipping through cryogenic and boil-off gas management technologies. In 2024, the company received orders for nearly 70 Turbo-Brayton units, widely used in maritime LNG applications to reliquefy evaporated LNG and reuse it onboard vessels.
The Major Players in The Industry
- Shell Plc
- TotalEnergies SE
- Gasum Ltd.
- Korea Gas Corporation (KOGAS)
- Wärtsilä Corporation
- Höegh LNG Holdings Ltd.
- MOL Group
- Harvey Gulf International Marine
- Nauticor GmbH & Co. KG
- Sempra Infrastructure
- Air Liquide (Marine LNG)
- Other Key Players
Key Development
- In May 2026, Shell plc strengthened its LNG bunkering position through a global network covering more than 13 countries, 29 locations, 15 operational bunker vessels, four newbuild vessels, and over 4,000 completed bunkering operations.
- In May 2026, Korea Gas Corporation (KOGAS) signed a 10-year contract with BP to purchase 700,000 tonnes of LNG annually from 2028, improving long-term supply security and price stability.
Report Scope
| Report Features | Description |
|---|---|
| Market Value (2025) | USD 3.06 Bn |
| Forecast Revenue (2035) | USD 21.65 Bn |
| CAGR (2026-2035) | 21.61% |
| Base Year for Estimation | 2025 |
| Historic Period | 2020-2024 |
| Forecast Period | 2026-2035 |
| Report Coverage | Revenue Forecast, Market Dynamics, Competitive Landscape, Recent Developments |
| Segments Covered | By Bunkering Method (Ship-to-Ship (STS), Port-to-Ship / Truck-to-Ship, and Shore-to-Ship / Pipeline), By Vessel Type (End User Fleet) (Container Fleet, Bulk & Cargo Fleet, Tanker Fleet, Ferries, and Offshore Oil & Gas Vessels), By End Use (Shipping & Maritime Transport, Offshore Oil & Gas, and Others) |
| Regional Analysis | North America – The US & Canada; Europe – Germany, France, The UK, Spain, Italy, Russia & CIS, Rest of Europe; APAC– China, Japan, South Korea, India, ASEAN & Rest of APAC; Latin America– Brazil, Mexico & Rest of Latin America; Middle East & Africa– GCC, South Africa, & Rest of MEA |
| Competitive Landscape | Shell Plc, TotalEnergies SE, Gasum Ltd., Korea Gas Corporation (KOGAS), Wärtsilä Corporation, Höegh LNG Holdings Ltd., MOL Group, Harvey Gulf International Marine, Nauticor GmbH & Co. KG, Sempra Infrastructure, Air Liquide (Marine LNG), Other Key Players |
| Customization Scope | Customization for segments, region/country-level will be provided. Moreover, additional customization can be done based on the requirements. |
| Purchase Options | We have three licenses to opt for: Single User License, Multi-User License (Up to 5 Users), Corporate Use License (Unlimited Users and Printable PDF) |





































