


Report Overview
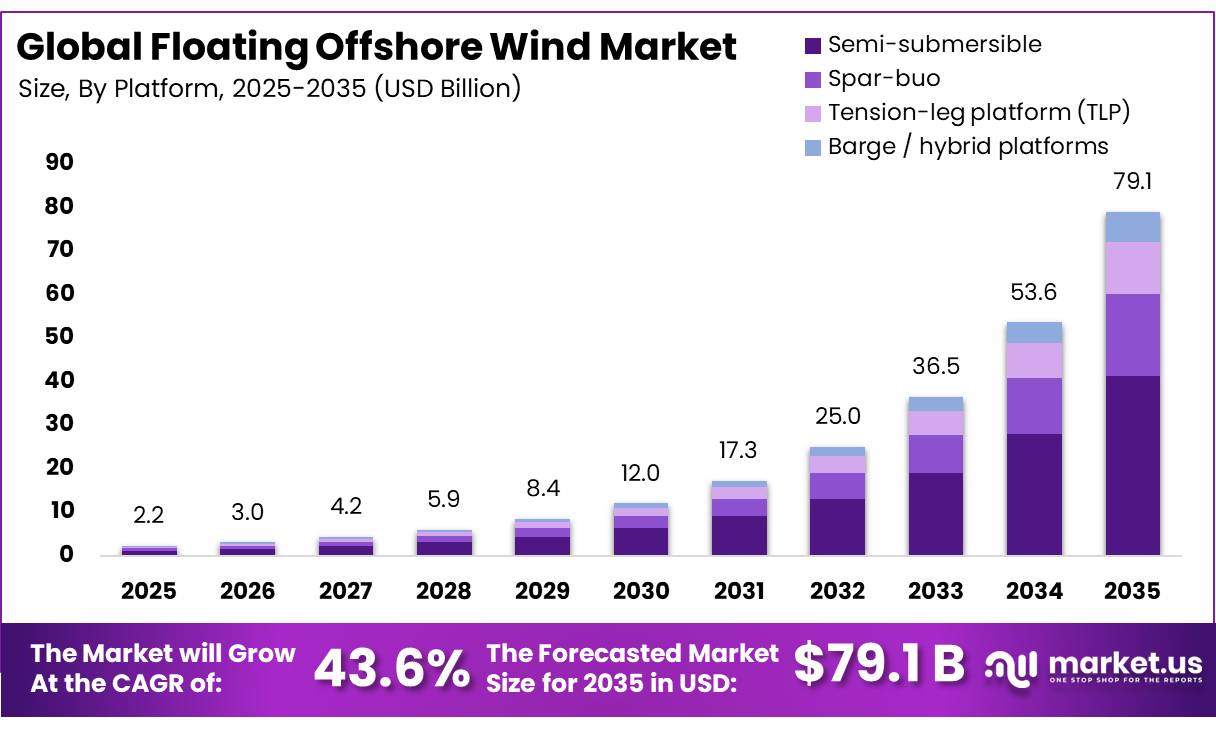
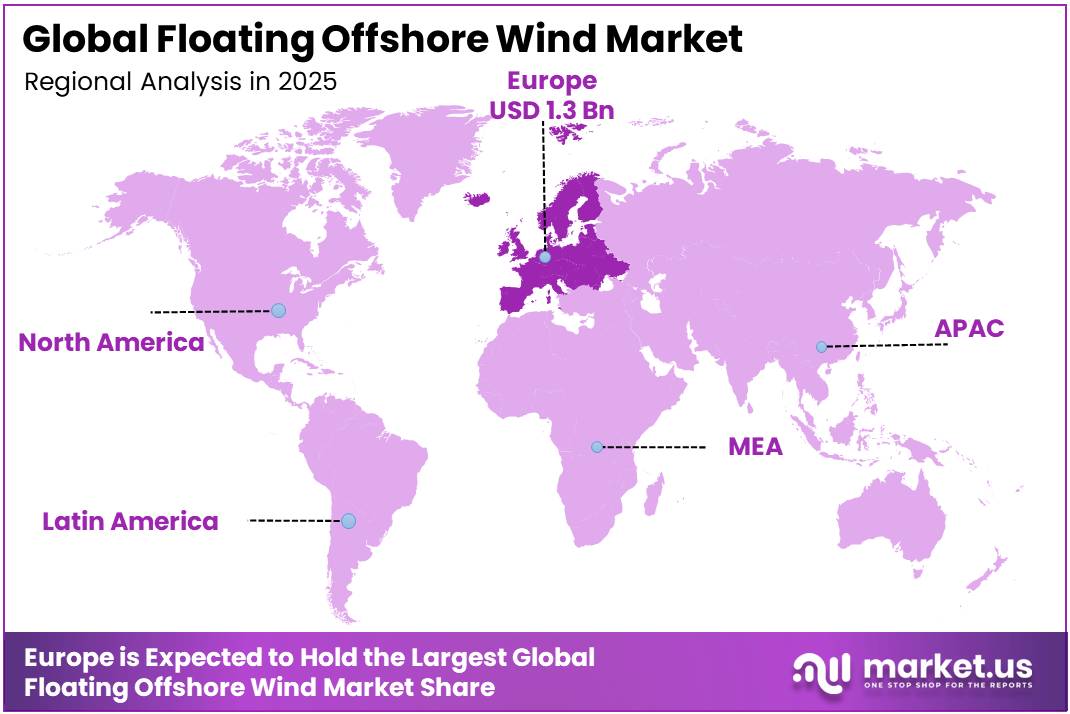
In 2025, the Global Floating Offshore Wind Market was valued at USD 2.2 billion, and between 2026 and 2035, this market is estimated to register a CAGR of 43.6%, reaching about USD 79.1 billion by 2035. In 2025, Europe led the market, achieving over 60.1% share with a revenue of USD 1.3 Billion.
Floating offshore wind is developing as an extension of offshore renewable power because floating foundations allow turbines to operate in deep-water areas where fixed-bottom structures are difficult or costly.
- In July 2024, the International Renewable Energy Agency reported around 270 MW of operational floating wind capacity and a global project pipeline of 244 GW. In June 2025, the Global Wind Energy Council reported that net installed floating wind capacity had reached 278 MW by the end of 2024. These figures show that the sector remains commercially small but has a substantial development base.
Key Takeaways
- The Global Floating Offshore Wind Market was valued at US$2.2 billion in 2025.
- The market is projected to grow at a CAGR of 43.6% and is estimated to reach US$79.1 billion by 2035.
- On the basis of platform, semi‑submersible dominated the market, constituting 52.3% of the total market share.
- Based on the product type, transitional water dominated the market, with a substantial market share of around 60.1%.
- Based on the turbine capacity, 5–10 MW led the market, comprising 36.5% of the total market.
- On the basis of component, turbines dominated the market, constituting 35.3% of the total market share.
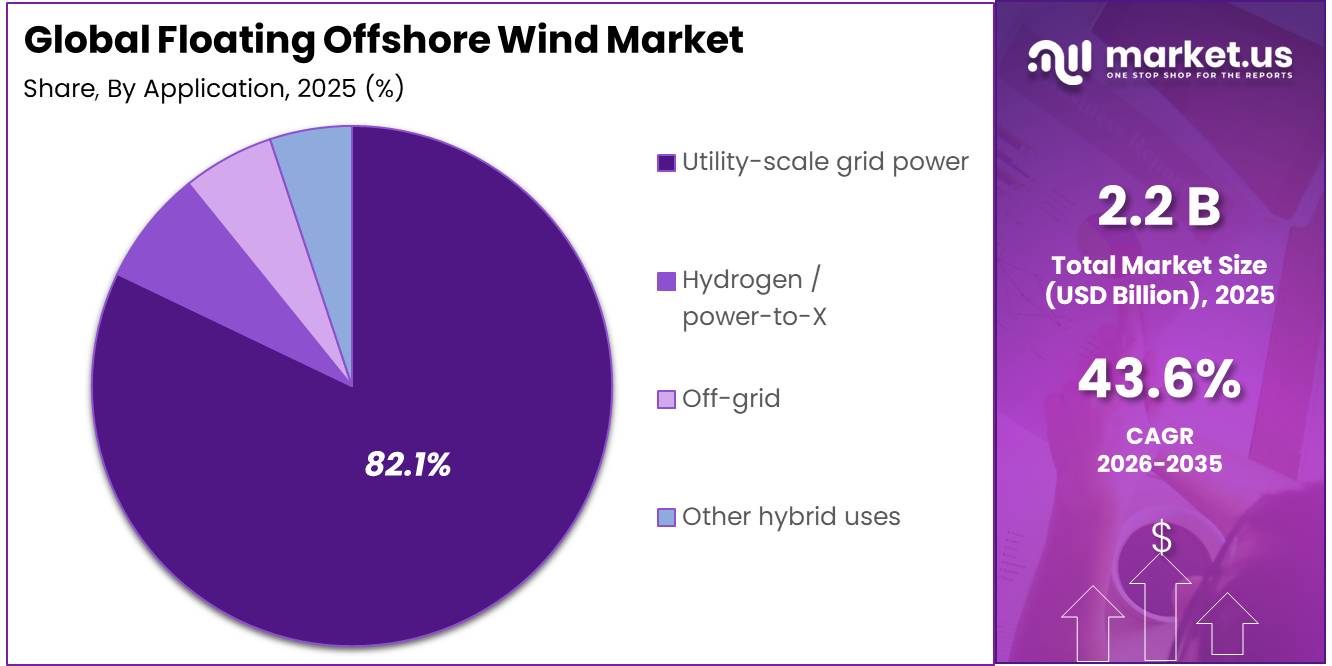
- Based on the application, utility‑scale grid power dominated the market, with a substantial market share of around 82.1%.
- In 2025, Europe was the most dominant region in the market, accounting for 60.1% of the total global consumption.
The wider offshore wind industry provides a foundation for floating technology through turbine manufacturing, marine engineering, subsea cabling, finance, and offshore construction. In October 2025, the International Energy Agency projected that offshore wind capacity additions would total 140 GW during 2025–2030. The same IEA outlook stated that annual offshore installations could increase from 9.2 GW in 2024 to more than 37 GW by 2030. Floating projects are expected to capture a rising portion of this expansion as suitable shallow-water locations become limited.
- The European Commission reported an offshore renewable ambition of approximately 86-89 GW by 2030 and around 355-366 GW by 2050. On 16 January 2025, the U.S. Department of Energy stated that floating offshore wind could supply 33 GW to the western United States by 2050. These targets provide developers and suppliers with demand signals for investment.
Government initiatives are reducing early-stage risks. On 27 October 2025, the UK Department for Energy Security and Net Zero allocated £180 million to floating offshore wind under Contracts for Difference Allocation Round 7. On 26 March 2026, the UK Government announced up to £64 million for a floating offshore wind-ready port at Port Talbot. The same announcement stated that the facility could help unlock at least 4.5 GW of projects in the Celtic Sea. Such funding supports ports, assembly areas, heavy lifting facilities, training, and supply-chain preparation.
Future opportunities will arise across semi-submersible and spar platforms, mooring lines, anchors, dynamic export cables, digital monitoring systems, and port-based fabrication. On 25 June 2026, The Crown Estate reported that three Celtic Sea floating projects could deliver 4.5 GW of renewable capacity. It also stated that its £50 million Supply Chain Accelerator was supporting industrial readiness, while the projects could create more than 5,000 jobs. Commercial growth will depend on standardised designs, serial manufacturing, bankable auctions, faster permitting, coordinated transmission, and lower financing costs. Companies establishing scalable production and reliable marine logistics are likely to gain the strongest long-term position globally.
Platform Analysis
Semi-submersible platforms dominate due to easier assembly, towing, and deployment across deep-water locations.
In 2025, Semi-submersible held a dominant market position, capturing more than a 52.3% share. The platform is widely preferred because its broad floating structure provides strong stability in changing wave and wind conditions. Its relatively shallow draft allows turbine assembly to take place near ports, reducing the need for complex offshore construction activities. The completed structure can also be towed to the project site using conventional vessels. These advantages support easier installation, maintenance, and relocation, making semi-submersible platforms suitable for commercial-scale floating wind projects across different water depths.
Spar-buoy is the fastest-growing segment in the Floating Offshore Wind Market. Its long cylindrical structure extends deep below the water surface, creating a low centre of gravity and improving turbine stability in harsh marine conditions. The design performs well in locations with strong waves and deep seabeds where fixed foundations are not practical. Growing investment in deep-water wind zones, improved mooring technology, and larger offshore turbines is supporting its adoption. However, spar-buoy platforms generally require deep-water ports and specialised installation planning because of their large vertical draft.
Product Type Analysis
In 2025, Transitional water (~60–200 m) held a dominant market position, capturing more than a 60.1% share. This depth range remained commercially attractive because it offers access to stronger offshore wind resources while supporting the use of proven floating platforms, mooring systems, anchors, and export cables.
- Projects located in transitional waters are generally more practical to survey, install, connect, and maintain than developments in waters exceeding 200 metres. Better port accessibility and comparatively shorter power-transmission routes also support more efficient project planning and execution.
In 2025, European Union reporting for the INFINITE project highlighted the development of a 4.8 MW floating offshore wind system designed for installation at a water depth of 100 metres, which falls directly within the transitional-water category. In addition, the UK Government’s 2025 energy strategy stated that more than 80% of the world’s potential offshore wind locations are found in waters deeper than 60 metres, demonstrating the substantial resource opportunity available for floating wind deployment.
Turbine Capacity Analysis
5–10 MW turbines lead the floating offshore wind market with a 36.5% share.
In 2025, the 5–10 MW segment held a dominant market position, capturing more than a 36.5% share. This capacity range remained widely used because it offers a practical balance between turbine output, floating-platform stability, component availability, and installation requirements.
- The UK Government’s 2025 Energy Innovation Needs Assessment highlighted Hywind Tampen as a strong commercial example, operating with eleven 8.6 MW turbines in the Norwegian North Sea. This established operating experience has strengthened confidence in 5–10 MW turbines for floating projects, where developers continue to value proven equipment, manageable structural loads, and lower technical risk.
The 11–15 MW segment is the fastest-growing segment in the floating offshore wind market. Developers are increasingly considering larger turbines because they can generate more electricity from each floating foundation and reduce the number of turbine units required across a commercial wind farm. The segment is also benefiting from improvements in floating-platform engineering, turbine controls, mooring systems, port infrastructure, and offshore assembly methods.
Component Analysis
Turbines lead the component segment with a 35.3% share as floating projects adopt higher-capacity machines
In 2025, Turbines held a dominant market position, capturing more than a 35.3% share. Turbines accounted for a major portion of floating offshore wind investment because the nacelle, rotor, blades, drivetrain, generator, tower, and control equipment determine the output and operating performance of each floating unit.
- In July 2025, the European Commission’s CORDIS platform reported that the ARCHIME3 floating structure achieved Approval in Principle certification for a 15 MW turbine and completed Basic Engineering Design certification for a 22 MW turbine. This progress shows that floating platforms are being developed specifically to support larger turbines, strengthening demand for high-capacity turbine components.
Mooring & anchoring systems is the fastest-growing segment. These systems are becoming increasingly important because floating turbines must remain stable while facing strong winds, waves, changing currents, and continuous platform movement. Each project requires mooring lines and anchors suited to its platform design, seabed conditions, water depth, and operating environment.
Application Analysis
Utility-scale grid power dominates the floating offshore wind market with an 82.1% share, supported by large grid-connected projects.
In 2025, Utility-scale grid power held a dominant market position, capturing more than an 82.1% share. Floating offshore wind farms are mainly developed as large electricity-generation assets that deliver renewable power to national grids. Their location in deeper waters provides access to stronger and more consistent wind resources, making them suitable for utility-scale power supply.
- In its 2025 monitoring report, the Scottish Government stated that 400 MW of floating offshore wind capacity secured Contracts for Difference through the Green Volt project. This government-backed capacity directly supports the growing role of floating wind in large-scale grid electricity generation.
Hydrogen / power-to-X is the fastest-growing segment. The segment is gaining attention because electricity from floating offshore wind farms can operate electrolysers and produce renewable hydrogen near offshore generation areas. This approach may help developers use surplus electricity, reduce pressure on transmission networks, and supply cleaner fuel to industries that are difficult to electrify directly.
Key Market Segments
By Platform
- Semi‑submersible
- Spar‑buo
- Tension‑leg platform (TLP)
- Barge / hybrid platforms
By Product Type
- Shallow water (up to ~60 m)
- Transitional water (~60–200 m)
- Deep water (>200 m)
By Turbine Capacity
- Up to 5 MW
- 5–10 MW
- 11–15 MW
- Above 15 MW
By Component
- Turbines
- Floating substructures
- Mooring & anchoring systems
- Subsea
- Installation & O&M services
By Application
- Utility‑scale grid power
- Hydrogen / power‑to‑X
- Off‑grid
- Other hybrid uses
Driver Analysis
DOE Floating Offshore Wind Shot Cost Trajectory
The U.S. Department of Energy’s Floating Offshore Wind Shot, launched in 2022, set a statutory-adjacent cost target of a 70% reduction to $45/MWh by 2035 alongside a 15 GW deployment goal, anchored to federal-state partnership structures rather than voluntary industry pledges. This target functions as a de facto Bill-of-Materials forcing mechanism: achieving $45/MWh from a current levelized baseline several multiples higher requires mooring-line steel content reduction, semi-submersible hull mass optimization, and serial fabrication of turbines in the 15-23 MW class, the same unit-capacity band cited in the pending Gulf of Mexico auction proposals from Hecate Energy and Invenergy.
Strategically, the Shot shifts DOE’s role from grant-based demonstration funding toward a portfolio approach spanning wind plant technology, substructure engineering, and grid integration a model that private developers can underwrite against for cost-of-capital purposes once a credible glide path exists. Because the target horizon extends to 2035, the CAGR uplift from this driver is long-dated (+1.2 percentage points) and contingent on the current leasing moratorium being lifted; the Shot’s technical program continues even where new leasing has stalled, preserving a technology-readiness runway independent of near-term policy reversal.
Driver Impact Analysis
| Driver | (~) % Impact on CAGR | Geographic Relevance | Impact Timeline |
|---|---|---|---|
| DOE Floating Offshore Wind Shot cost-reduction pathway ($45/MWh by 2035) restarting post-moratorium U.S. R&D funding | +1.2% | North America core (Gulf of Maine, California) | Long term (≥4 years) |
| U.S. federal OCS leasing moratorium (Jan 2025 Presidential Memorandum) suppressing near-term project sanctioning | -3.5% | North America core | Short term (≤2 years) |
| France’s AO5/AO6 CfD auction mechanism validating sub-€90/MWh floating tariffs and RTE-funded grid connection | +2.8% | EU (Mediterranean, South Brittany), APAC corridors (policy replication) | Medium term (2-4 years) |
| China’s 15th Five-Year Plan (2026-2030) deep-sea wind mandate and Haiyou Guanlan platform commercialization | +3.1% | APAC core (Guangdong, Hainan, Fujian) | Medium term (2-4 years) |
| Japan METI/MLIT “central method” EEZ designation and 15 GW-by-2040 floating target | +2.0% | APAC corridors (Japan, Korea spill-over) | Long term (≥4 years) |
| South Korea’s Ulsan-based KF Wind licensing pipeline under the Green New Deal framework | +1.4% | APAC corridors (Ulsan, East Sea) | Medium term (2-4 years) |
Restraint Analysis
Port & vessel gaps
Port and installation readiness remains a core industrial bottleneck because floating offshore wind requires large marshaling areas, heavy-lift quays, deep drafts, tow-out logistics, and specialized fabrication sequences that most legacy ports were not designed to support, and the fact that the U.S. Department of Transportation highlighted a $426.7 million award to establish the first offshore wind terminal on the Pacific Coast underscores how early the enabling infrastructure still is relative to commercial deployment needs.
DOE’s Floating Offshore Wind Shot progress update also makes repeated reference to regional supply-chain and port-gap identification rather than a fully available execution network, so developers face berth scarcity, fabrication slot competition, and vessel scheduling risk that can extend fabrication and offshore installation windows by 6 to 18 months, inflate logistics line items by 10% to 20%, and lower annual commissioning throughput because a single delayed hull, mooring set, or tow-out campaign can shift COD across fiscal years.
Restraint Impact Analysis
| Restraint | (~) % Impact on CAGR Forecast | Geographic Relevance | Impact Timeline |
|---|---|---|---|
| Permitting drag | -2.4% | U.S. West Coast core, EU sensitive basins | Short term (≤ 2 years) |
| Port & vessel gaps | -2.1% | U.S. Pacific, UK, North Sea, APAC corridors | Medium term (2-4 years) |
| High cost of capital | -1.9% | North America core, EU, UK | Short term (≤ 2 years) |
| Grid & transformer bottlenecks | -1.6% | EU core, UK, U.S. coastal grids | Medium term (2-4 years) |
| Steel & platform inflation | -1.4% | Global; EU, U.S., Korea, Japan | Short term (≤ 2 years) |
| Auction revenue mismatch | -1.7% | UK, EU tender markets, U.S. offtake-linked zones | Medium term (2-4 years) |
Opportunity Analysis
Platform electrification for O&G
This is an opportunity rather than a current market driver because baseline floating wind growth is still primarily tied to utility-scale grid-connected generation, whereas direct power supply to offshore oil and gas assets creates a separate monetization lane with different buyers, contracting logic, and carbon-abatement value pools.
Crown Estate Scotland’s INTOG framework was explicitly designed to let offshore wind projects reduce emissions from oil and gas production and support innovation, which opens an adjacent revenue stack in which developers can secure quasi-captive industrial demand, shorten offtake risk, and earn premium project returns through avoided platform fuel burn and emissions costs rather than wholesale power sales alone.
In practical terms, this white space can lift project EBITDA margins by an estimated 300 to 500 basis points because demand is concentrated, curtailment risk is lower, and interconnection spending can be 10% to 20% lighter for hub-to-platform architectures versus full export-grid builds in selected cases; for developers able to aggregate 300 to 800 MW of targeted loads across mature basins, the incremental serviceable market can plausibly exceed $6 billion to $9 billion through 2035, supporting about +2.1 percentage points of CAGR upside above baseline if replicated beyond Scotland into the broader North Sea.
Opportunity Impact Analysis
| Opportunity | (~) % Potential CAGR Upside | Geographic Relevance | Execution Window |
|---|---|---|---|
| Platform electrification for O&G | +2.1% | UK North Sea, Norway, EU Atlantic | Short term (≤ 2 years) |
| EEZ deepwater first-mover buildout | +3.0% | Japan, APAC emerging markets | Medium term (2-4 years) |
| Floating-to-hydrogen hubs | +2.4% | EU Atlantic, North Sea, Australia | Medium term (2-4 years) |
| Defense-port-industrial microgrids | +1.7% | U.S. Pacific, Japan, Australia | Short term (≤ 2 years) |
| Mooring and cable localization roll-up | +2.6% | EU, Japan, Australia, U.S. | Medium term (2-4 years) |
| Research-array IP monetization | +1.4% | U.S., EU, APAC | Long term (≥ 4 years) |
Challenges Analysis
Specialist Labor Deficit
Floating offshore wind scales into a labor profile that is broader and more fabrication-intensive than conventional offshore power projects, drawing simultaneously on welders, composite technicians, subsea engineers, cable specialists, marine coordinators, and high-voltage integration talent, while UK government and government-backed assessments indicate the offshore wind workforce may need to expand toward roughly 100,000 jobs by 2030 and attract around 10,000 people per year to meet deployment ambition.
The immediate commercial consequence is not the absence of any workers but a shortage of certified, transferable, and geographically mobile specialists, causing wage escalation in critical trades of perhaps 10% to 20% above baseline industrial inflation, fabrication rework risk, and longer commissioning windows when one constrained skill category delays the full construction chain, which supports a -1.3 percentage point drag estimate on maximum growth realization.
Companies therefore need multi-year apprenticeship pipelines, conversion programs from offshore oil and gas and shipbuilding, retention bonuses tied to certification ladders, and cross-border labor mobility planning, but because training-to-productivity cycles for welding, subsea operations, and grid integration can stretch 18 to 36 months and labor-market competition will intensify as multiple offshore sectors expand together, the issue remains structurally long term.
Challenges Impact Analysis
| Challenge | (~) % CAGR Friction Drag | Geographic Relevance | Mitigation Horizon |
|---|---|---|---|
| Port Marshaling Gaps | -1.6% | EU Atlantic basins, UK hubs, U.S. Pacific, APAC deepwater ports | Long term (≥ 4 years) |
| Installation Vessel Scarcity | -1.2% | North America core, North Sea, Celtic Sea, APAC logistics corridors | Medium term (2-4 years) |
| Dynamic Cable Reliability | -1.0% | Deepwater EU projects, U.S. Pacific, Japan, South Korea | Medium term (2-4 years) |
| Specialist Labor Deficit | -1.3% | UK-EU fabrication clusters, U.S. coastal buildout zones, APAC yards | Long term (≥ 4 years) |
| Grid Landing Bottlenecks | -1.1% | UK transmission nodes, U.S. West Coast, EU regulatory hubs | Long term (≥ 4 years) |
| Industrial Scale-Up Volatility | -0.9% | UK supply-chain corridors, EU manufacturing bases, emerging APAC platforms | Medium term (2-4 years) |
Geopolitical Impact Analysis
War-Driven Pressures Reshape the Floating Offshore Wind Market
The Russia-Ukraine war and conflict in the Middle East are reshaping the floating offshore wind market through higher costs and stronger energy-security demand. Shipping disruption, fuel volatility and marine insurance are raising the expense of transporting turbines, floating foundations, cables and mooring systems.
- Suez Canal traffic remained around 70% below its 2023 average in early May 2025, forcing longer routes around Africa and increasing delivery uncertainty for European projects. European natural-gas prices also rose by more than 40% after the Middle East escalation on 28 February 2026, strengthening the case for locally generated offshore electricity.
However, floating wind remains capital-intensive, so inflation in steel, vessels, port services and financing can delay investment decisions or make auction prices unworkable. The IEA lowered its global offshore wind growth forecast by 27% because of higher costs, supply-chain constraints and project delays. Floating projects face greater exposure than fixed-bottom developments because they require specialised platforms, anchors, dynamic cables and towing operations.
Governments are therefore emphasising domestic manufacturing, stronger ports, diversified sourcing and long-term revenue support. Overall, war-related disruption pressures project economics in the near term, but it also strengthens the long-term case for floating offshore wind as a secure, domestic and low-carbon energy source.
Regional Analysis
Europe Leads the Floating Offshore Wind Market
In 2025, Europe held the dominant position in the Floating Offshore Wind Market, capturing more than a 60.1% share and generating approximately USD 1.3 billion. Its leadership is supported by mature offshore engineering expertise, experienced developers, specialized ports, established financing channels, and competitive auction systems.
France strengthened regional commercialization by installing 30 MW of floating offshore wind capacity, showing that projects are moving beyond small demonstrations. Continued activity in the United Kingdom, Norway, France, Spain, Italy, and Portugal is expected to support demand for floating foundations, mooring equipment, dynamic cables, installation vessels, digital monitoring, and long-term maintenance services across Europe.
Asia-Pacific is the fastest-growing regional segment and is expected to expand strongly through 2035. Growth is being supported by deep-water coastlines, rising electricity needs, government leasing programs, and expanding domestic turbine manufacturing. In 2025, China commissioned 6.6 GW of new offshore wind capacity, lifting its cumulative offshore total to 48.4 GW.
Key Regions and Countries Covered
- North America
- The US
- Canada
- Europe
- Germany
- France
- The UK
- Spain
- Italy
- Russia & CIS
- Rest of Europe
- APAC
- China
- Japan
- South Korea
- India
- ASEAN
- Rest of APAC
- Latin America
- Brazil
- Mexico
- Rest of Latin America
- Middle East & Africa
- GCC
- South Africa
- Rest of MEA
Key Players Analysis
Goldwind Science & Technology is strengthening its position in floating offshore wind through large-capacity turbine engineering. In October 2025, its jointly developed GWH252-16-F floating turbine was installed in Guangxi with a rated capacity of 16 MW. The unit is expected to generate 44.65 million kWh annually, enough for more than 24,000 three-person households. Goldwind also tested the design across over 10,000 load conditions, supporting reliability, lower lifecycle costs, and scalable deployment across major deep-water wind markets worldwide at scale.
Equinor remains a leading floating offshore wind developer through its Hywind technology and operating experience. Hywind Tampen has a system capacity of 94.6 MW and uses 11 upgraded 8.6 MW turbines. The project supplies electricity to five Snorre and Gullfaks platforms and is estimated to meet around 35% of their annual power demand. In 2025, the wind farm achieved a capacity factor above 51%, strengthening Equinor’s position in commercial-scale operations, technology improvement, asset management, and performance optimization globally today.
Aker Solutions supports floating offshore wind through engineering, foundations, substations, cables, and marine operations. The company offers three project-ready floating foundation concepts and delivered 11 concrete hulls for the 88 MW Hywind Tampen project. In July 2026, its consultancy arm secured work on electrical infrastructure studies for the proposed 1.8 GW Bellrock floating wind farm, located 120 km offshore Scotland.
Ocean Winds has built a strong floating offshore wind position through operating assets and commercial-scale developments. Its 25 MW WindFloat Atlantic project uses three turbines and had generated 345 GWh by May 2025, supplying electricity equivalent to 25,000 Portuguese households annually. In November 2025, the company secured rights for a Celtic Sea site covering 358 km², with development potential of up to 1.5 GW.
The Major Players in the Industry
- GE Vernova
- Vestas Wind Systems
- Siemens Gamesa Renewable Energy S.A.
- Mingyang Smart Energy Group Co., Ltd.
- Goldwind Science & Technology Co., Ltd.
- Equinor AS
- Ørsted A/S
- Principle Power Inc.
- BW Ideol AS
- Aker Solutions ASA
- SBM Offshore N.V.
- RWE AG
- TotalEnergies SE
- Ocean Winds
- Hexicon AB
- Other Key Players
Key Development
- In May 2026, GE Vernova selected Maraen Port of Nigg in Scotland as the marshalling harbour for Haliade-X components supporting Dogger Bank B and C. The wider 3.6 GW project will use 277 Haliade-X turbines across three phases, strengthening GE Vernova’s large-scale offshore delivery experience.
- In March 2025, Vestas Wind Systems strengthened its partnership with Copenhagen Infrastructure Partners by securing a 495 MW order for 33 V236-15.0 MW turbines and a long-term service agreement for Taiwan’s Fengmiao I offshore project. The announcement also showed that the V236 platform had gained more than 7 GW of firm global orders, reflecting strong commercial acceptance of its latest offshore technology.
Report Scope
| Report Features | Description |
|---|---|
| Market Value (2025) | USD 2.2 Bn |
| Forecast Revenue (2035) | USD 79.1 Bn |
| CAGR (2026-2035) | 43.6% |
| Base Year for Estimation | 2025 |
| Historic Period | 2020-2024 |
| Forecast Period | 2026-2035 |
| Report Coverage | Revenue Forecast, Market Dynamics, Competitive Landscape, Recent Developments |
| Segments Covered | By Platform (Semi‑submersible, Spar‑buo, Tension‑leg platform (TLP), Barge / hybrid platforms), By Product Type (Shallow water, Transitional water, Deep water), By Turbine Capacity (Up to 5 MW, 5–10 MW, 11–15 MW, Above 15 MW), By Component (Turbines, Floating substructures, Mooring and anchoring systems, Subsea, Installation & O&M services), and By Application (Utility‑scale grid power, Hydrogen / power‑to‑X, Off‑grid, Other hybrid uses) |
| Regional Analysis | North America – The US & Canada; Europe – Germany, France, The UK, Spain, Italy, Russia & CIS, Rest of Europe; APAC– China, Japan, South Korea, India, ASEAN & Rest of APAC; Latin America– Brazil, Mexico & Rest of Latin America; Middle East & Africa– GCC, South Africa, & Rest of MEA |
| Competitive Landscape | GE Vernova, Vestas Wind Systems, Siemens Gamesa Renewable Energy S.A., Mingyang Smart Energy Group Co., Ltd., Goldwind Science & Technology Co., Ltd., Equinor AS, Ørsted A/S, Principle Power Inc., BW Ideol AS, Aker Solutions ASA, SBM Offshore N.V., RWE AG, TotalEnergies SE, Ocean Winds, Hexicon AB, Other Key Players |
| Customization Scope | Customization for segments, region/country-level will be provided. Moreover, additional customization can be done based on the requirements. |
| Purchase Options | We have three licenses to opt for: Single User License, Multi-User License (Up to 5 Users), Corporate Use License (Unlimited Users and Printable PDF) |





































