


Report Overview
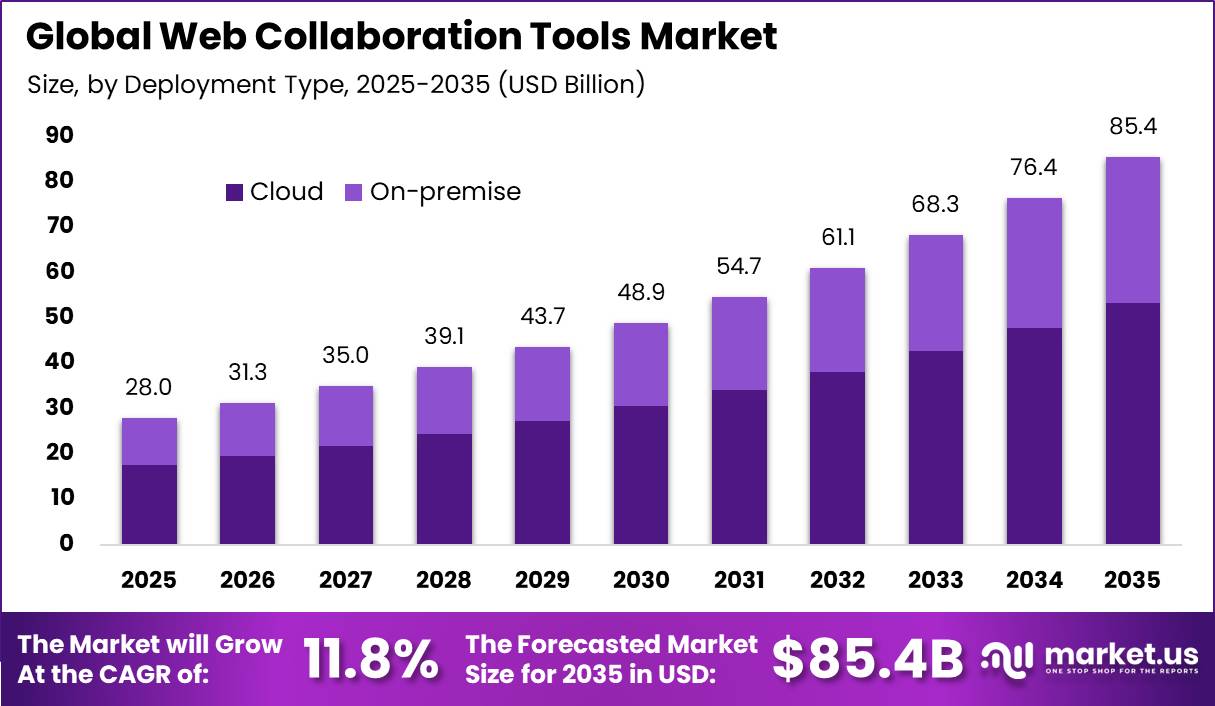
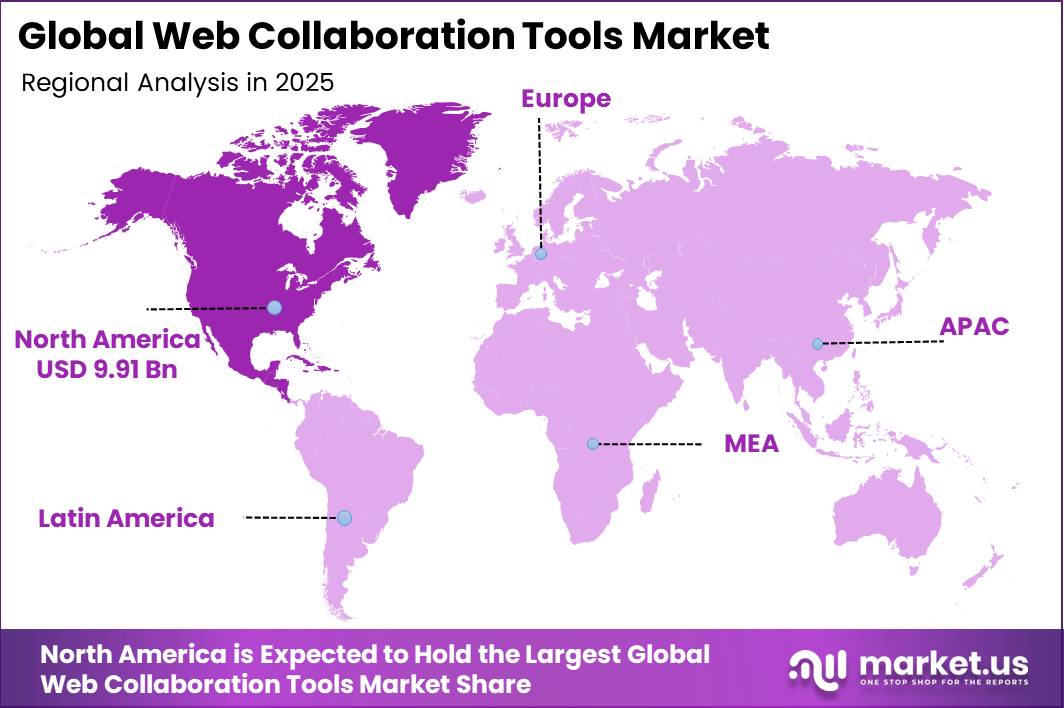
In 2025, the Global Web Collaboration Tools Market was valued at USD 28.0 billion. The market is projected to grow at a CAGR of 11.8% during 2026–2035, reaching approximately USD 85.4 billion by 2035. North America dominated the global market in 2025, accounting for more than 35.4% of the total market share and generating approximately USD 9.9 billion in revenue.
Growth is mainly supported by the long-term shift toward hybrid and distributed work, which increases demand for secure online communication, file sharing, video meetings, task management, and document co-editing. The U.S. Bureau of Labor Statistics reported that 35.5 million people, representing 22.9% of people at work, teleworked or worked from home for pay in the first quarter of 2024, while remote work accounted for 16.3% of total work hours.
Global connectivity is also improving, with the International Telecommunication Union reporting 5.5 billion internet users in 2024, equal to 68% of the global population, compared with 65% in 2023. The U.S. Census Bureau reported that 95.5% of U.S. households had a computer and 91.0% had broadband internet access during 2020–2024.
In Canada, 48% of businesses with five or more employees used cloud computing in 2023, compared with 45% in 2021. These trends support wider adoption, subscription renewals, security spending, AI-based features, and workflow integration across businesses.
Key Takeaway
- Market valued at USD 28.0 billion in 2025, projected to reach USD 85.4 billion by 2035 at a CAGR of 11.8%
- Cloud deployment held a leading 62.4% share of the market
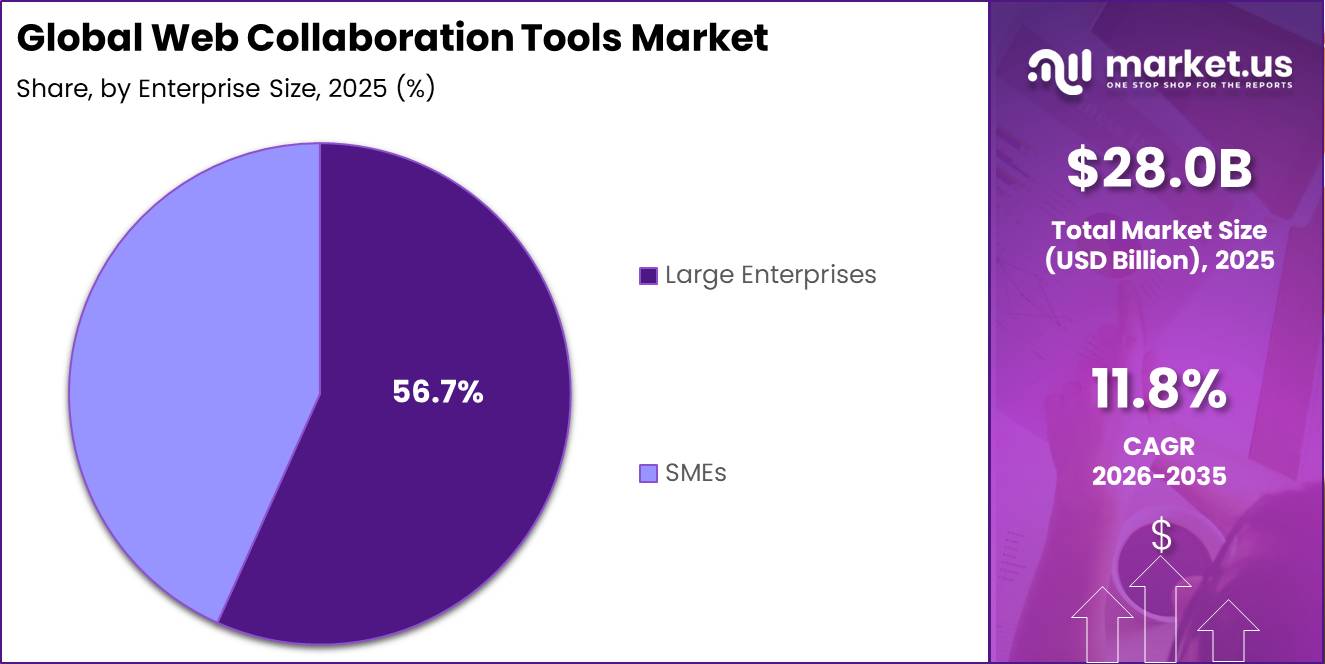
- Large enterprises accounted for a 56.7% share, driven by complex multi-department operational needs
- North America led the market in 2025 with a 35.4% share, generating USD 9.91 billion in revenue
Market Statistics and Data Insights
- U.S. remote and hybrid work remains structurally large. In 2025, 35.389 million U.S. workers teleworked or worked from home for pay. These workers averaged 26.5 remote hours per week, and 66.4% of their total working hours were completed remotely. This supports continued use of video meetings, messaging, shared documents, and online project tools.
- Enterprise cloud adoption reached 52.7% across EU businesses in 2025, increasing 7.4 percentage points from 2023. Among cloud-using enterprises, 85.2% used cloud e-mail, 71.7% office software, and 71.5% file storage, all core functions of web collaboration environments.
- Global internet connectivity reached about 6.0 billion people in 2025, representing roughly three-quarters of the world’s population. More than 240 million additional people came online during the year, although 2.2 billion remained offline. This continues to expand the potential user base for browser-based collaboration services.
- In 2025, 53% of EU enterprises used ERP, CRM, and/or business-intelligence software. Among large enterprises, ERP adoption reached 89%, CRM reached 65%, and BI software reached 69%, creating a strong base for integrating chat, meetings, document workflows, and project collaboration directly with enterprise applications.
- ENISA analysed 4,875 cybersecurity incidents between July 2024 and June 2025. DDoS attacks represented 77% of reported incidents, phishing accounted for about 60% of observed initial intrusion methods, and 53.7% of incidents involved entities defined as essential under NIS2. These figures highlight the security burden facing cloud collaboration platforms.
- Global data-centre electricity consumption increased by around 17% in 2025, adding approximately 70 TWh of electricity demand. AI-focused data centres grew even faster, while total global electricity demand increased by about 3%. AI-heavy collaboration features therefore face increasing power, infrastructure, and capacity requirements.
- Enterprise AI adoption increased sharply in 2025, with 20.0% of EU enterprises using AI technologies, compared with 13.5% in 2024, an increase of 6.5 percentage points. Around 11.8% used AI for written-language analysis, 8.8% for generating written or spoken language, and 7.2% for speech conversion, creating direct opportunities for AI summaries, transcription, search, and workflow automation.
- AI agents are moving from experimentation toward real workplace use. Slack’s 2025 Workforce Index survey of more than 5,000 global desk workers found that 40% had used an AI-agent chatbot, while 23% had already instructed an agent to complete work on their behalf.
- Microsoft’s 2025 Work Trend Index, based on 31,000 workers across 31 countries, found that 46% of leaders said their organisations were already using agents to fully automate workflows or business processes. Another 82% expected digital labour to expand workforce capacity over the following 12–18 months.
- AI meeting assistants are showing measurable productivity effects. A Zoom-commissioned survey conducted from November 2025 to February 2026 among 688 knowledge workers found that AI meeting summaries saved about 1.6 hours per week on follow-up tasks. AI note-taking increased active meeting engagement by 15.8% for hosts and 13.7% for attendees. Respondents could also skip about 2 of 9 weekly meetings, producing around 1.1 hours of net weekly savings after reviewing summaries.
By Deployment Type
The cloud deployment segment holds a leading 62.4% share of the Web Collaboration Tools Market, supported by its ability to provide distributed teams with quick access to shared workspaces without requiring software installation, maintenance, or frequent upgrades on individual devices.
According to the U.S. National Institute of Standards and Technology, cloud computing provides on-demand access to shared computing resources that can be quickly added or removed depending on business needs. This flexibility is especially useful when organisations expand project teams, work with external partners, or hire temporary employees.
Cloud adoption across enterprises also supports this trend. Eurostat reported that 52.7% of EU enterprises with at least 10 employees purchased cloud computing services in 2025, increasing by 7.4 percentage points from 2023. Among enterprises using cloud services, 85.2% used cloud-based e-mail, 71.7% used office software, and 71.5% used file storage.
By Enterprise Size
Large enterprises lead the Web Collaboration Tools Market with a 56.7% share, mainly because they need to connect large workforces, multiple departments, global offices, suppliers, and customers through secure digital platforms. Their complex operations require reliable tools for messaging, video meetings, document sharing, task management, and workflow coordination.
Eurostat reported that 78% of large EU enterprises purchased cloud computing services in 2023, compared with 44% of small and medium-sized enterprises, highlighting stronger digital adoption among larger organisations. Security requirements also support the use of advanced collaboration platforms. In 2024, around 96.8% of large enterprises used strong-password authentication, while 95.0% maintained data backups in separate locations.
Modern collaboration tools help companies meet these needs through centralised user management, role-based access, audit controls, encrypted file sharing, and integration with existing business systems. Large enterprises also generally purchase more user licences and deploy collaboration software across several business functions, resulting in larger subscription contracts and higher overall spending.
Key Market Segments
By Deployment Type
- Cloud
- On-premise
By Enterprise Size
- Large Enterprises
- SMEs
Geopolitical Impact Analysis
Geopolitical risks influence the Web Collaboration Tools Market mainly through the physical infrastructure needed to deliver cloud-based services, including servers, graphics processors, networking equipment, storage systems, cooling systems, and undersea communication hardware. Trade restrictions and tariff uncertainty can increase equipment costs and extend delivery times.
In April 2025, the World Trade Organization estimated that the tariff environment could reduce North American exports by 12.6% and imports by 9.6% during 2025. Such changes can increase the cost of data-centre expansion and enterprise hardware purchases, especially when equipment is sourced across the United States, East Asia, and Europe.
Cloud providers may respond by increasing subscription prices or delaying infrastructure investment. Shipping disruptions create another challenge. UNCTAD reported that Suez Canal transits averaged only 33 ships per day by mid-October 2024, representing a 57% decline from the earlier peak. By early May 2025, transit tonnage remained around 70% below the 2023 average.
Longer shipping routes can raise freight, insurance, and equipment delivery costs for cloud operators. Energy availability is also important because collaboration platforms depend on electricity-intensive data centres. The International Energy Agency expects global electricity demand to increase by nearly 4% annually through 2027, while data-centre electricity consumption in China exceeded 100 TWh in 2024.
Regional Analysis
North America dominated the Web Collaboration Tools Market in 2025, accounting for 35.4% of global revenue and generating USD 9.9 billion. The region benefits from a mature enterprise software ecosystem, strong cloud infrastructure, a large base of multinational companies, and high spending on cybersecurity, workflow automation, and software-as-a-service platforms.
The United States remains the main demand centre, supported by a digital economy valued at USD 2.6 trillion in 2022, representing 10.0% of U.S. GDP, according to the U.S. Bureau of Economic Analysis. This strong digital foundation encourages businesses to invest in secure communication, video meetings, document sharing, project tracking, access controls, and integration with enterprise systems.
Asia Pacific is expected to be the fastest-growing regional market, supported by rapid digitisation, wider mobile broadband coverage, growing cloud adoption, and an expanding base of connected businesses. World Bank data showed that East Asia and Pacific firms investing in digital solutions increased from 13% in 2020 to 54% in 2022.
The region also had about 1.5 billion active internet users, equal to around 70% of its population. Mobile broadband subscriptions increased from 437 million in 2013 to approximately 2 billion in 2021. This large digital user base is encouraging businesses across China, India, Japan, South Korea, Southeast Asia, and Australia to shift from traditional communication and local-file systems toward cloud-based collaboration platforms.
Key Regions and Countries
North America
- US
- Canada
Europe
- Germany
- France
- The UK
- Spain
- Italy
- Rest of Europe
Asia Pacific
- China
- Japan
- South Korea
- India
- Australia
- Rest of APAC
Latin America
- Brazil
- Mexico
- Rest of Latin America
Middle East & Africa
- GCC
- South Africa
- Rest of MEA
Market Dynamics
Drivers
| Driver | (~) % CAGR | Geographic Relevance | Impact Timeline |
|---|---|---|---|
| Hybrid-work operating models | +1.8% | Global | Short term (2 years or less) |
| Cloud software migration | +1.3% | North America and Europe | Short term (2 years or less) |
| Workflow AI adoption | +1.1% | Advanced economies | Medium term (2 to 4 years) |
| Cross-border project delivery | +0.8% | Global | Medium term (2 to 4 years) |
| Enterprise software consolidation | +0.5% | North America and Europe | Medium term (2 to 4 years) |
Hybrid-work operating models
Hybrid work converts collaboration software from a discretionary productivity tool into recurring operating infrastructure, increasing demand for organisation-wide licences, administration controls, persistent content storage, and integrated workflows.
The U.S. Bureau of Labor Statistics recorded 35.5 million teleworkers in the first quarter of 2024, representing 22.9% of people at work; the same source reported that telework represented 16.3% of total work hours.
Eurostat reported that 52.7% of EU enterprises purchased cloud computing services in 2025, while the U.S. Bureau of Economic Analysis estimated the digital economy at 10.0% of U.S. GDP in 2022. This installed digital-work base supports an estimated +1.8% incremental CAGR contribution by shifting vendor economics toward per-user subscriptions, higher retention, and premium security or workflow modules.
Restraints
| Restraint | (~) % CAGR | Geographic Relevance | Impact Timeline |
|---|---|---|---|
| Data sovereignty procurement blocks | -1.5% | Europe and regulated markets | Short term (2 years or less) |
| Cybersecurity budget diversion | -1.1% | Global | Short term (2 years or less) |
| Public-sector approval delays | -0.8% | Europe and North America | Medium term (2 to 4 years) |
| Small-business purchasing constraints | -0.6% | Emerging markets | Short term (2 years or less) |
| AI compliance uncertainty | -0.4% | European Union | Medium term (2 to 4 years) |
Data sovereignty procurement blocks
Data-location requirements and risk-sensitive procurement can halt cloud collaboration deployments where customer messages, recordings, files, and user metadata cannot be demonstrably controlled within approved jurisdictions.
ENISA documented 11,079 cyber incidents in its 2024 threat assessment, including 322 incidents affecting two or more EU Member States; Eurostat found that 92.7% of EU enterprises used at least one ICT-security measure in 2024.
The European Commission’s AI Act timetable also made general-purpose AI provider obligations applicable from 2 August 2025, with transparency rules becoming applicable from 2 August 2026. These controls increase legal review, regional hosting, encryption, audit, and contract costs before a sale can close, producing an estimated -1.5% CAGR drag through delayed public-sector and regulated-industry procurement rather than lower user need.
Challenges
| Challenge | (~) % CAGR | Geographic Relevance | Mitigation Horizon |
|---|---|---|---|
| Legacy workflow interoperability | -1.3% | Global enterprises | Medium term (2 to 4 years) |
| AI compute cost pressure | -0.9% | Global | Medium term (2 to 4 years) |
| Digital skills gaps | -0.7% | Emerging markets | Long term (4 years or more) |
| Multi-vendor licence sprawl | -0.5% | North America and Europe | Short term (2 years or less) |
| Regional network unevenness | -0.3% | Asia Pacific and Africa | Long term (4 years or more) |
Legacy workflow interoperability
Large organisations commonly operate separate identity, content, customer, project, and communications systems, making collaboration deployment a continuous integration task rather than a simple software purchase.
Eurostat reported that 66.7% of medium-sized EU enterprises used paid cloud services in 2025, while 55.03% of large EU enterprises used AI technologies in the same year; Eurostat also reported that 47% of EU businesses used sophisticated or intermediate cloud services or data analytics in 2025.
The OECD notes that cloud computing has diffused roughly three times faster than big-data analytics, creating an uneven application landscape. The resulting API, data-model, identity, and change-management burden raises implementation effort and slows seat activation, creating an estimated -1.3% friction drag until vendors standardise connectors, governance layers, and migration tools.
Opportunities
| Opportunity | (~) % CAGR | Geographic Relevance | Execution Window |
|---|---|---|---|
| Regulated vertical AI workspaces | +1.7% | Europe and North America | Medium term (2 to 4 years) |
| Frontline worker collaboration | +1.2% | Global | Medium term (2 to 4 years) |
| Asia Pacific localisation | +1.0% | Asia Pacific | Long term (4 years or more) |
| Sovereign cloud bundles | +0.8% | Europe and Middle East | Medium term (2 to 4 years) |
| Usage-based AI monetisation | +0.6% | Global | Short term (2 years or less) |
Regulated vertical AI workspaces
Purpose-built collaboration tools for healthcare, financial services, government, and industrial operations remain a strong growth opportunity because these sectors need secure workflows, traceable records, controlled access, and reliable AI outputs.
The European Commission states that high-risk AI rules will apply from 2 December 2027, while rules for AI embedded in regulated products extend to 2 August 2028. ENISA also recorded 188 cybersecurity incidents across 26 EU Member States and 2 EFTA countries in its 2024 assessment.
The International Energy Agency reported that global data-centre electricity demand increased by 17% in 2025, supporting demand for efficient, task-specific AI systems. A vertical collaboration bundle that increases revenue per active user by an estimated 15% to 25% and reduces manual review time by 20% to 30% could add around +1.7% above the baseline CAGR through higher-value compliance, workflow, and AI modules.
Key Players Analysis
The Web Collaboration Tools Market has a fragmented supplier base that includes work-management specialists, private software vendors, and enterprise infrastructure providers. Tier 1 includes Citrix Systems and Planview. Citrix, now part of the Citrix–TIBCO platform backed by Vista Equity Partners and Elliott, gained significant scale through its USD 16.5 billion all-cash acquisition in 2022, including assumed debt.
Planview expanded its enterprise portfolio-management capabilities through the acquisitions of Clarizen and Changepoint in 2021, meaning Clarizen is no longer an independent competitor. Tier 2 includes Smartsheet and Asana, which provide clearer financial indicators of competitive strength.
Smartsheet generated USD 826.3 million in revenue during the first nine months of fiscal 2025, including USD 786.3 million from subscriptions. Its annualised recurring revenue reached USD 1.1 billion, while R&D spending stood at USD 189.5 million. Asana recorded USD 723.9 million in fiscal 2025 revenue, representing 11% growth, and spent USD 341.5 million on R&D, equal to 47.2% of revenue.
Other players, including Zoho, Nureva, Stormboard, Samepage, Singletree Technologies, and Synacor, compete in niche areas such as visual planning, digital workspaces, and meeting collaboration. Samepage has been owned by Paylocity since 2020. Since several companies are private, reliable market-share comparisons remain limited.
Top Key Players in the Market
- IBM
- Asana
- Zoho Corporation Pvt Ltd
- Synacor Inc
- Planview
- Samepage
- Clarizen
- Smartsheet Inc
- Citrix Systems Inc
- Stormboard
- Singletree Technologies
- Nureva Inc.
Recent Developments
- In January 2025, Smartsheet was acquired by Blackstone and Vista Equity Partners in a transaction valued at approximately USD 8.4 billion. Smartsheet shareholders received USD 56.5 per share in cash, and the company stopped trading on the New York Stock Exchange. The acquisition provides Smartsheet with greater financial flexibility to invest in AI-supported work management, enterprise collaboration, and international expansion.
- In February 2025, IBM completed its acquisition of HashiCorp for an enterprise value of USD 6.4 billion, paying USD 35 per share in cash. HashiCorp strengthens IBM’s hybrid-cloud infrastructure automation and security capabilities, helping enterprises manage applications, cloud resources, and collaboration workloads across multiple IT environments.
Report Scope
| Report Features | Description |
|---|---|
| Market Value (2025) | USD 28.0 Billion |
| Forecast Revenue (2035) | USD 85.4 Billion |
| CAGR (2026-2035) | 11.8% |
| Base Year for Estimation | 2025 |
| Historic Period | 2020-2024 |
| Forecast Period | 2026-2035 |
| Report Coverage | Revenue Forecast, Market Dynamics, Competitive Landscape, Recent Developments |
| Segments Covered | By Deployment Type (Cloud, On-premises); By Enterprise Size (Large Enterprises, SMEs) |
| Regional Analysis | North America – US, Canada; Europe – Germany, France, The UK, Spain, Italy, Rest of Europe; Asia Pacific – China, Japan, South Korea, India, Australia, Singapore, Rest of APAC; Latin America – Brazil, Mexico, Rest of Latin America; Middle East & Africa – GCC, South Africa, Rest of MEA |
| Competitive Landscape | IBM, Asana, Zoho Corporation Pvt Ltd, Synacor Inc, Planview, Samepage, Clarizen, Smartsheet Inc, Citrix Systems Inc, Stormboard, Singletree Technologies, Nureva Inc. |
| Customization Scope | Customization for segments, region/country-level will be provided. Moreover, additional customization can be done based on the requirements. |
| Purchase Options | We have three licenses to opt for: Single User License, Multi-User License (Up to 5 Users), Corporate Use License (Unlimited Users and Printable PDF) |





























