Report Overview
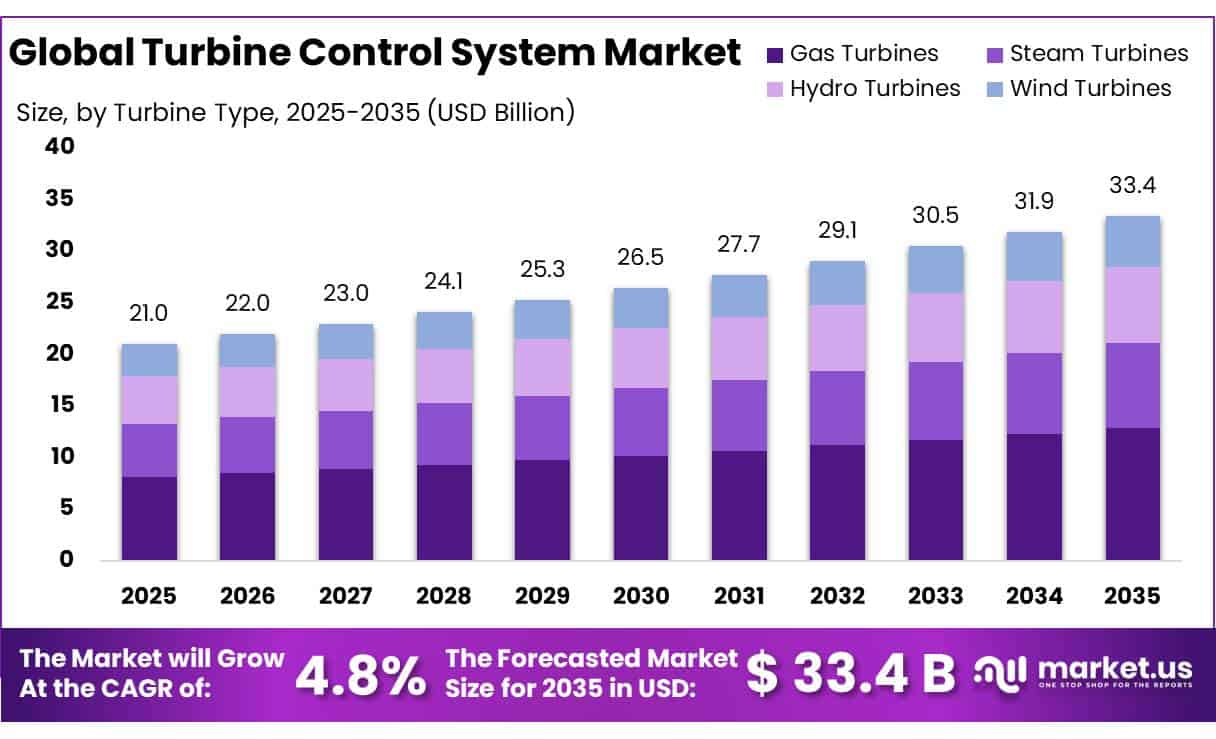
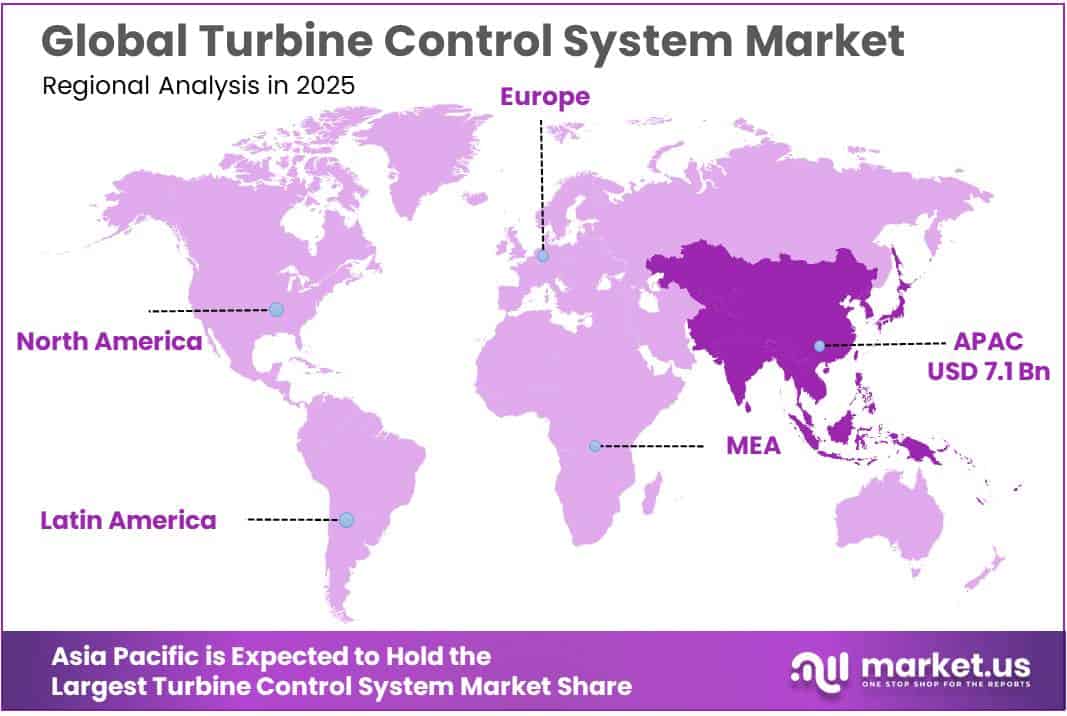
The Global Turbine Control System Market size is expected to be worth around USD 33.4 Billion by 2035, from USD 21.0 Billion in 2025, growing at a CAGR of 4.8% during the forecast period from 2026 to 2035. In 2025, Asia Pacific held a dominant market position, capturing more than a 34.00% share, holding USD 7.1 Billion revenue.
The Turbine Control System industry plays an important role in power generation, oil and gas processing, petrochemicals, marine operations, and other energy-intensive industries. Turbine control systems are designed to monitor, regulate, and optimize the performance of gas turbines, steam turbines, and other rotating equipment.
- The industrial scenario is strongly influenced by the expansion of electricity generation and the growing requirement for reliable power supply. According to the U.S. Energy Information Administration (EIA), the United States generated approximately 4.43 trillion kilowatt-hours of utility-scale electricity in 2025. Natural gas accounted for approximately 40% of installed utility-scale generation capacity, highlighting the importance of gas turbines in the electricity sector.
Turbine control systems are also gaining importance because of improvements in turbine efficiency and operating technology. The U.S. Department of Energy (DOE) explains that advanced gas turbine technologies can achieve efficiencies of up to 60%, while simple-cycle gas turbines generally operate at efficiencies of approximately 20% to 35%. Combined-cycle configurations improve overall energy utilization by recovering exhaust heat through heat recovery steam generators. These developments increase the need for precise control of combustion, temperature, pressure, and turbine speed.
- The expansion of electricity demand represents another major growth driver. According to the International Energy Agency (IEA), global electricity demand was projected to increase by 3.3% in 2025 and 3.7% in 2026, compared with average annual growth of 2.6% during 2015–2023. Industrial electrification, data centre expansion, artificial intelligence infrastructure, and increased cooling requirements are contributing to this demand.
Equipment reliability and operational safety are also important market drivers. The North American Electric Reliability Corporation (NERC), in its 2025 Long-Term Reliability Assessment, identified more than 105 gigawatts (GW) of confirmed and announced-potential generation retirements over the following 10 years. At the same time, increasing electricity demand and large industrial load connections are creating additional reliability requirements.
Government-supported energy technology development is creating further opportunities for turbine control manufacturers. The U.S. Department of Energy’s Advanced Turbine Systems programme highlights research into turbine operating temperatures exceeding 3,100°F, with potential efficiencies above 65%. Achieving these performance levels requires improvements in combustion management, cooling technologies, materials, and operating controls.
Key Takeaways
- Turbine Control System Market size is expected to be worth around USD 33.4 Billion by 2035, from USD 21.0 Billion in 2025, growing at a CAGR of 4.8%.
- Hardware held a dominant market position, capturing more than a 48.00% share.
- Gas Turbines held a dominant market position, capturing more than a 38.00% share.
- Speed Control Systems held a dominant market position, capturing more than a 24.00% share.
- Turbine Monitoring held a dominant market position, capturing more than a 25.00% share.
- Power Generation held a dominant market position, capturing more than a 57.00% share.
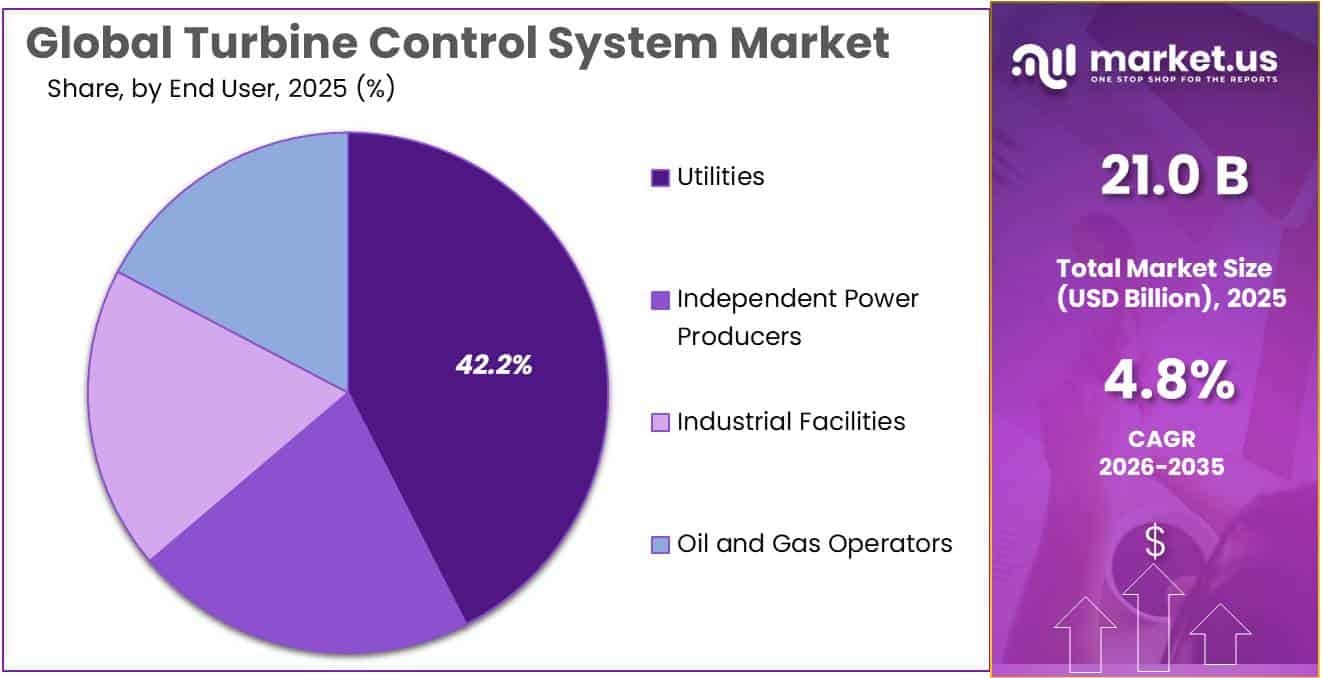
- Utilities held a dominant market position, capturing more than a 42.00% share.
- Asia Pacific dominated the Turbine Control System Market in 2025, accounting for 34.00% of the market, with a reported value of USD 7.1 billion.
By Component Analysis
Hardware dominates the market due to its essential role in turbine monitoring, protection, and operational control.
In 2025, “Hardware” held a dominant market position, capturing more than a 48.00% share. Hardware components form the physical foundation of turbine control systems and include controllers, sensors, transmitters, actuators, input/output modules, control panels, and communication devices. These components continuously collect operating information and help regulate turbine speed, temperature, pressure, fuel flow, and vibration.
The U.S. Energy Information Administration reported approximately 4.43 trillion kilowatt-hours of utility-scale electricity generation in the United States in 2025, reflecting the scale of infrastructure requiring reliable generation equipment and control technologies.
“Software” plays an important role in turbine control systems by managing operating instructions, processing sensor information, and coordinating the performance of connected hardware components. It includes turbine control applications, monitoring platforms, diagnostic tools, safety logic, and performance optimization software. In 2025, demand for turbine control software was supported by the growing adoption of industrial automation and digital monitoring across power generation and oil and gas facilities.
According to the U.S. Energy Information Administration, utility-scale electricity generation in the United States reached approximately 4.43 trillion kilowatt-hours in 2025. Managing such large-scale generation infrastructure requires reliable monitoring, automated operating controls, and accurate performance data. Software solutions are therefore gaining importance as power plant operators focus on improving turbine availability, optimizing fuel consumption, and maintaining stable operations.
By Turbine Type Analysis
Gas turbines dominate due to their flexible power generation capabilities and suitability for industrial operations.
In 2025, “Gas Turbines” held a dominant market position, capturing more than a 38.00% share. Gas turbines are widely used in electricity generation, oil and gas facilities, petrochemical plants, and other industrial applications because they offer flexible operation, quick start-up, and reliable power output. Their control systems regulate fuel supply, combustion temperature, rotational speed, pressure, and exhaust conditions to maintain stable performance and protect critical equipment.
In 2025, demand for gas turbine control systems was supported by the need for dependable electricity generation and improved operational efficiency. The U.S. Energy Information Administration reported approximately 4.43 trillion kilowatt-hours of utility-scale electricity generation in the United States in 2025. Natural gas remained an important fuel in the country’s electricity generation mix, supporting the need for reliable turbine monitoring and control infrastructure.
“Steam Turbines” represent an important segment of the Turbine Control System Market because they are widely used in thermal power generation, nuclear power plants, refineries, chemical processing, and manufacturing facilities. Their control systems regulate steam pressure, temperature, turbine speed, and load conditions to ensure safe and stable operations. In 2025, demand for steam turbine control systems was supported by the modernization of existing power plants and the need to improve equipment reliability.
The U.S. Energy Information Administration reported that steam turbines accounted for approximately 17% of total U.S. electricity generation from coal in 2025, while nuclear power contributed approximately 18% of utility-scale electricity generation. These figures demonstrate the continued importance of steam-based generation infrastructure. Nuclear plants also depend on steam turbines to convert thermal energy into electricity. This creates opportunities for advanced turbine control systems that improve operating stability, monitor critical equipment, and support long-term plant reliability.
By Control System Analysis
Speed control systems dominate due to their critical role in maintaining turbine stability, safe operation, and consistent power output.
In 2025, “Speed Control Systems” held a dominant market position, capturing more than a 24.00% share. Speed control systems are essential components of turbine operations because they regulate rotational speed according to operating requirements and changing load conditions. These systems monitor turbine speed and adjust fuel supply, steam flow, or other operating inputs to maintain stable performance. Their importance is particularly high in power generation, oil and gas, and industrial facilities, where sudden speed variations can affect equipment safety and connected machinery.
Load Control Systems play an important role in turbine control systems by regulating the amount of power generated according to the requirements of connected grids and industrial facilities. These systems adjust fuel input, steam flow, and turbine operating conditions to maintain the required output while preventing sudden load variations.
According to the U.S. Energy Information Administration, the United States generated approximately 4.43 trillion kilowatt-hours of utility-scale electricity in 2025. The agency also reported that natural gas accounted for 40.0% of total utility-scale generation capacity, supporting the importance of flexible generation and turbine load management.
The Federal Energy Regulatory Commission reported that total U.S. electricity consumption reached approximately 4,227 terawatt-hours in 2025, representing a 2.3% increase compared with 2024. This increase highlights the need for generating facilities to respond efficiently to changing electricity requirements. As a result, advanced load control systems are gaining importance in power plants and industrial facilities seeking better output management, operational flexibility, and equipment reliability.
By Function Analysis
Turbine monitoring dominates due to its role in improving equipment reliability, performance tracking, and operational efficiency.
In 2025, “Turbine Monitoring” held a dominant market position, capturing more than a 25.00% share. Turbine monitoring is an essential function because it allows operators to track important operating parameters, including rotational speed, temperature, pressure, vibration, fuel flow, and exhaust conditions. These systems provide real-time operating information and help identify abnormal conditions before they develop into major equipment failures.
In 2025, demand was supported by the growing focus on preventive maintenance, plant automation, and reduced equipment downtime across power generation, oil and gas, and industrial facilities. Advanced monitoring solutions also support remote supervision and performance analysis, allowing operators to make timely adjustments and improve turbine availability. According to the U.S. Energy Information Administration, utility-scale electricity generation in the United States reached approximately 4.43 trillion kilowatt-hours in 2025, highlighting the importance of reliable generation infrastructure and continuous equipment monitoring.
The importance of turbine protection is supported by the U.S. Energy Information Administration’s electricity infrastructure data. The United States generated approximately 4.43 trillion kilowatt-hours of utility-scale electricity in 2025, demonstrating the importance of maintaining reliable power generation operations.
In addition, the Occupational Safety and Health Administration (OSHA) establishes machinery safety requirements under its industrial machine-guarding regulations, including 29 CFR 1910.212. These safety requirements reinforce the need for appropriate protective measures around industrial machinery.
By Application Analysis
Power generation dominates due to the extensive use of gas and steam turbines in electricity production.
In 2025, “Power Generation” held a dominant market position, capturing more than a 57.00% share. Power generation is the leading application for turbine control systems because electricity plants depend on accurate turbine operation to maintain stable output and reliable performance. These systems regulate turbine speed, fuel supply, steam pressure, temperature, and generator load according to changing electricity requirements.
In 2025, demand was supported by investments in thermal power plants, combined-cycle facilities, and modernization of existing generation infrastructure. Turbine control systems also help power plant operators improve fuel efficiency, reduce unexpected shutdowns, and maintain safe operating conditions. According to the U.S. Energy Information Administration, utility-scale electricity generation in the United States reached approximately 4.43 trillion kilowatt-hours in 2025, demonstrating the importance of reliable power generation equipment and automated turbine control technologies.
Oil and Gas represents an important application segment of the Turbine Control System Market because turbines are widely used in gas compression stations, refineries, offshore platforms, pipeline operations, and liquefied natural gas facilities. Turbine control systems regulate rotational speed, fuel flow, pressure, and operating temperature to maintain reliable performance under demanding industrial conditions. In 2025, demand was supported by increasing natural gas production, pipeline infrastructure requirements, and investments in oil and gas processing facilities.
These systems also help operators reduce unexpected shutdowns, improve equipment availability, and maintain safe operating conditions. According to the U.S. Energy Information Administration, U.S. marketed natural gas production reached a record 118.5 billion cubic feet per day in 2025, representing an increase of 5.3 billion cubic feet per day compared with 2024. This expansion in natural gas production supports the need for reliable turbine-driven compression and processing equipment, creating opportunities for advanced turbine monitoring and control solutions.
By End User Analysis
Utilities dominate the market due to their large-scale power generation operations and continuous requirement for reliable turbine performance.
In 2025, “Utilities” held a dominant market position, capturing more than a 42.00% share. Utility companies represent a major end-user segment because they operate power generation facilities that depend on gas and steam turbines for electricity production. Turbine control systems help utilities regulate speed, manage power output, monitor operating conditions, and protect generating equipment against unexpected failures. Demand is supported by electricity infrastructure modernization, rising power consumption, and the need for uninterrupted electricity supply.
According to the U.S. Energy Information Administration (EIA), utility-scale electricity generation in the United States reached approximately 4,429 billion kilowatt-hours in 2025. Natural gas accounted for 40.0% of total utility-scale generation capacity, highlighting the importance of turbine-based generation infrastructure and reliable control technologies.
According to the U.S. Energy Information Administration’s 2025 Electric Power Annual, independent power producers generated electricity from multiple sources, including natural gas, coal, nuclear, solar, and other renewables. Their natural gas generation reached approximately 619.8 million megawatt-hours in 2015, demonstrating the established role of gas-based generation in this ownership category. The expansion of privately financed generation projects creates opportunities for digital turbine controllers, automated monitoring, and advanced protection systems.
Key Market Segments
By Component
- Hardware
- Software
- Services
By Turbine Type
- Gas Turbines
- Steam Turbines
- Hydro Turbines
- Wind Turbines
By Control System
- Speed Control Systems
- Load Control Systems
- Temperature Control Systems
- Vibration Monitoring and Control Systems
- Safety and Protection Systems
By Function
- Turbine Monitoring
- Turbine Protection
- Turbine Regulation
- Turbine Automation
By Application
- Power Generation
- Oil and Gas
- Industrial Manufacturing
- Marine
- Aerospace
By End User
- Utilities
- Independent Power Producers
- Industrial Facilities
- Oil and Gas Operators
Driver Analysis
Gas-Turbine Delivery Expansion
New gas-turbine deliveries create a direct control-system attachment opportunity because each commissioned machine requires validated sequencing, fuel regulation, monitoring and protection interfaces. GE Vernova’s July 2026 update reported 116 GW of combined gas-equipment backlog and slot reservations, comprising 53 GW of equipment backlog and 63 GW of reservations; reservations are not equivalent to firm orders and should not be assigned the same probability or delivery timing. The company targeted annual manufacturing capability of 20 GW in the third quarter of 2026, 24 GW in 2028 and 30 GW in 2030, indicating a substantial potential delivery ramp rather than a current controls-market revenue figure.
Its 2025 annual report also records approximately 7,000 installed gas turbines and equipment contracts across markets including Malaysia, Poland, Mexico and Kuwait, supporting geographic breadth without establishing global market share. In an illustrative procurement program, 100 additional turbines carrying $500,000 of turbine-control hardware, software and directly associated engineering each produce $50 million of addressable revenue; both the unit count and package value are assumptions, and included scope must be separated from plant-wide automation.
Suppliers monetize this demand through OEM integration, project engineering and commissioning acceptance, with revenue tied to executable machine schedules rather than announced power capacity alone. The +1.0 pp contribution assumes 20% of addressable revenue grows 5 percentage points faster through new gas-turbine deliveries, excluding data-centre demand as a separate additive driver because it already contributes to the same equipment pipeline.
Drivers Impact Analysis
| Driver | (~) % Impact on CAGR Forecast | Geographic Relevance | Impact Timeline |
|---|---|---|---|
| Gas-turbine delivery expansion | +1.0 pp | US, Gulf, Southeast Asia, Europe | Medium term (2–4 years) |
| Legacy-control modernization | +0.8 pp | US, EU, Japan, Middle East | Short term (≤ 2 years) |
| Flexible-generation control upgrades | +0.6 pp | EU, UK, US, Brazil | Short term (≤ 2 years) |
| Wind-turbine deployment | +0.6 pp | China, Europe, India, US | Medium term (2–4 years) |
| Cybersecurity-led system renewal | +0.4 pp | US, Canada core | Short term (≤ 2 years) |
| Hydro-turbine capacity additions | +0.4 pp | China, India, Southeast Asia, Brazil | Medium term (2–4 years) |
Restraint Analysis
New-Build Project Deferrals
Strong turbine order pipelines do not translate immediately into control-system revenue when enabling infrastructure, equipment availability or project economics push construction beyond the customer’s original schedule. The IEA’s World Energy Outlook 2025 identifies strained gas-turbine supply chains, longer delivery waits and rising project costs, alongside grid-development lead times often exceeding a decade for major transmission projects. Its November 2026 renewables update reports approximately 3,000 GW of advanced-stage renewable and storage projects awaiting grid connections, 60% above the previous year; this is not a turbine-only queue and must not be converted directly into lost turbine-control orders.
Gas-project pipeline quality also requires careful interpretation: GE Vernova’s July 2026 disclosure separated 53 GW of equipment backlog from 63 GW of slot reservations within its 116 GW combined total, so reservations should not receive the same probability weighting as firm equipment commitments. In an illustrative control-supply portfolio of 100 projects averaging $500,000 each, shifting 20 projects beyond a forecast year defers $10 million of delivery-linked scope; it does not necessarily destroy the orders or mean revenue recognition follows a single commissioning milestone.
Suppliers must therefore forecast contract-specific delivery schedules, distinguish reservations from orders and avoid allocating manufacturing capacity solely against headline gigawatts. The −0.5 pp deduction assumes 20% of addressable revenue grows 2.5 percentage points more slowly because otherwise prospective projects move outside executable schedules, excluding investment permanently diverted to non-turbine technologies.
Restraint Impact Analysis
| Restraint | (~) % Impact on CAGR Forecast | Geographic Relevance | Impact Timeline |
|---|---|---|---|
| New-build project deferrals | −0.5 pp | US, EU, Gulf | Medium term (2–4 years) |
| Unattractive retrofit payback | −0.4 pp | EU, US, Japan | Short term (≤ 2 years) |
| Retiring turbine fleets | −0.3 pp | US, UK, Western Europe | Medium term (2–4 years) |
| Partial-replacement scope compression | −0.3 pp | US, EU, Middle East | Long term (≥ 4 years) |
| Non-turbine flexibility substitution | −0.2 pp | US, EU, Australia | Medium term (2–4 years) |
Opportunity Analysis
Hydrogen-Conversion Control Packages
Fuel-transition projects offer incremental control-system scope where existing turbines require validated fuel-management, purge-sequencing, monitoring and protection changes to operate on a new hydrogen blend. GE Vernova explicitly identifies controls and, depending on the site, HMI changes among potential hydrogen-conversion requirements, alongside fuel-system, package and combustion modifications. Its portfolio has operated on fuels containing approximately 5–100% hydrogen by volume, but capability is model- and combustor-specific; the cited HA configuration supports blends up to 50% hydrogen by volume, not universal 100% operation.
This is an opportunity beyond routine modernization because the purchase must be attributable to an executable fuel conversion—not an existing “hydrogen-ready” label or ordinary controller replacement. Volume percentage also must not be equated with hydrogen’s share of thermal energy or an equal percentage reduction in emissions. In an illustrative program converting 40 eligible turbines, $250,000 of incremental control hardware, software and engineering per unit creates $10 million of addressable orders; a $2 million platform-development investment requires approximately 27 installations to recover at an assumed 30% contribution margin, before financing and ongoing support.
These are screening assumptions, not supplier quotations. Commercial execution requires turbine-OEM coordination, fuel availability and unit-specific validation; software alone cannot confer a combustion capability. The +0.30 pp contribution assumes 6% revenue exposure grows 5 percentage points faster through genuinely additional conversion packages, excluding mechanical equipment and projects already counted as base modernization.
Opportunity Impact Analysis
| Opportunity | (~) % Potential CAGR Upside | Geographic Relevance | Execution Window |
|---|---|---|---|
| Hydrogen-conversion control packages | +0.30 pp | EU, Japan, US, Gulf | Medium term (2–4 years) |
| Turbine–battery coordination modules | +0.25 pp | US, EU, Australia, Japan | Short term (≤ 2 years) |
| Simulation-linked lifecycle software | +0.25 pp | North America, EU, Japan | Short term (≤ 2 years) |
| Multi-OEM retrofit platforms | +0.20 pp | US, EU, Middle East | Medium term (2–4 years) |
| Performance-linked control contracts | +0.20 pp | US, EU, UK, Gulf | Short term (≤ 2 years) |
Challenges Analysis
Legacy Interface Integration
GE Vernova’s August 2026 platform guidance explicitly states that existing-plant integration requires understanding installed cabling, networking, cybersecurity arrangements and control philosophies, with phased implementation potentially needed around outages. Its documentation lists interfaces including Modbus, PROFINET, Profibus DP, Foundation Fieldbus, IEC 61850, IEC 60870-5-104 and HART; protocol availability does not guarantee identical signal meanings, timing or failure behaviour across connected equipment.
In an illustrative migration involving 2,000 I/O points, a 2% mapping discrepancy creates 40 items requiring investigation; reducing that rate to 0.5% leaves ten. At an assumed four engineering hours per discrepancy and $150/hour, the direct difference is $18,000 per project before field work, repeat testing or scheduling effects. These are modeling assumptions, not measured error rates or standard engineering allowances.
Suppliers need verified as-built records, signal-level ownership, interface test cases and rollback plans, while owners must distinguish retained equipment that is merely communicable from equipment that is demonstrably compatible. The −0.30 pp friction estimate assumes 15% of addressable revenue grows 2 percentage points more slowly because reconciliation, staged commissioning and repeated acceptance work consume deployment capacity; it excludes retrofit proposals rejected outright on economic grounds.
Challenges Impact Analysis
| Challenge | (~) % CAGR Friction Drag | Geographic Relevance | Mitigation Horizon |
|---|---|---|---|
| Legacy interface integration | −0.30 pp | US, EU, Japan, Middle East | Medium term (2–4 years) |
| Real-time protection coordination | −0.25 pp | North America, EU, China, Gulf | Long term (≥ 4 years) |
| Cybersecure change management | −0.25 pp | US, Canada; EU operators | Medium term (2–4 years) |
| Simulation-to-plant validation fidelity | −0.25 pp | US, EU, Japan, South Korea | Medium term (2–4 years) |
| Component lifecycle synchronization | −0.20 pp | Global fleets; APAC supply chains | Long term (≥ 4 years) |
Geopolitical Impact Analysis
Geopolitical Impact of the US-Iran War on the Turbine Control System Market
The ongoing US-Iran war in 2026 is creating uncertainty across the global energy industry, affecting the Turbine Control System Market through fuel supply disruptions, higher energy costs, and delays in industrial investment. Attacks on energy infrastructure and disruptions in the Strait of Hormuz have affected oil and liquefied natural gas (LNG) transportation, increasing pressure on power producers and industrial operators. These conditions are influencing decisions related to turbine maintenance, control system upgrades, and new power generation projects.
- According to the International Energy Agency (IEA), LNG shipments from Qatar and the United Arab Emirates declined by more than 60 billion cubic metres between March and October 2026. The IEA also projected a 3% decline in global LNG supply during 2026. These disruptions are increasing fuel procurement challenges for gas-fired power plants and industrial facilities.
For turbine control system manufacturers, the conflict is creating challenges through higher component transportation costs, uncertain delivery schedules, and pressure on project budgets. However, it is also encouraging investments in reliable turbine monitoring, automated protection, fuel management, and predictive maintenance. In the longer term, energy security concerns are expected to support modernization of existing power plants and investment in flexible generation infrastructure.
Regional Insights
Asia Pacific – Dominating Region (34.00% Share, USD 7.1 Billion)
Asia Pacific dominated the Turbine Control System Market in 2025, accounting for 34.00% of the market, with a reported value of USD 7.1 billion. The region’s leading position is supported by expanding electricity generation infrastructure, industrial development, and investments in thermal power plants, oil and gas facilities, and manufacturing operations. China, Japan, South Korea, and Southeast Asian countries contribute to regional demand through investments in power generation and industrial automation.
According to the International Energy Agency (IEA), electricity demand across Asia Pacific increased by 4.1% in 2025, while the region is expected to record average annual growth of 4.7% during 2026–2030. Rising electricity consumption is encouraging power producers to invest in advanced turbine monitoring, speed regulation, load management, and protection systems. The modernization of existing facilities and growing demand for reliable electricity are further supporting regional market development.
Asia Pacific is also expected to maintain strong growth opportunities through 2030, supported by increasing electricity consumption, industrial expansion, and investments in flexible power generation. China is expected to account for almost 70% of the region’s additional electricity demand during 2026–2030, while Southeast Asia is expected to contribute approximately 11%. This growing requirement for electricity is creating opportunities for turbine control system suppliers, particularly in gas-fired power plants, combined-cycle facilities, and industrial energy installations.
According to the IEA, solar and wind energy together are expected to meet 86% of additional electricity demand across Asia Pacific over its 2026–2030 outlook period. The increasing integration of renewable energy is also creating a need for flexible generation equipment that can respond to changing power supply conditions. Consequently, demand for automated turbine controls, real-time monitoring, and load management solutions is expected to increase.
Key Regions and Countries Insights
- North America
- US
- Canada
- Europe
- Germany
- France
- The UK
- Spain
- Italy
- Rest of Europe
- Asia Pacific
- China
- Japan
- South Korea
- India
- Australia
- Rest of APAC
- Latin America
- Brazil
- Mexico
- Rest of Latin America
- Middle East & Africa
- GCC
- South Africa
- Rest of MEA
Key Players Analysis
Synthite Industries Pvt. Ltd., established in 1972, is a global manufacturer of botanical extracts, spice oleoresins, and essential oils. The company operates 8 manufacturing facilities, employs more than 3,000 people, and serves customers in over 90 countries. Its portfolio includes more than 500 products for food, beverage, health, and fragrance applications. In fiscal 2025, the company reported consolidated revenue of approximately INR 3,074 crore and profit after tax of INR 194 crore.
Kalsec Inc., founded in 1958, is a family-owned manufacturer of natural food and beverage ingredients headquartered in Kalamazoo, Michigan. The company operates internationally through manufacturing, research, distribution, and sales facilities across North America, Europe, and Asia. In 2025, Kalsec introduced its KalHops solutions and opened an applications laboratory in Jakarta, Indonesia. In July 2026, it opened a new Spice Processing Center at its Kalamazoo headquarters to expand production capabilities and support global customer demand.
Plant Lipids Pvt. Ltd., established in 1979, specializes in natural spice extracts, essential oils, oleoresins, nutraceutical ingredients, and customized food solutions. The company serves customers in more than 85 countries and operates 14 manufacturing units supported by 4 research and development centres. Its global operations include manufacturing facilities in India, Sri Lanka, and Germany, along with sourcing networks across more than 30 countries.
Top Key Players Outlook
- Synthite Industries Pvt. Ltd.
- Kalsec Inc.
- Plant Lipids Pvt. Ltd.
- MANE Kancor Ingredients Pvt. Ltd.
- Chenguang Biotech Group Co., Ltd.
- AVT Natural Products Ltd.
- Akay Natural Ingredients Pvt. Ltd.
- Universal Oleoresins Pvt. Ltd.
- Givaudan SA
- PT Indesso Aroma
- Ozone Naturals Pvt. Ltd.
- Paprika Oleo’s India Ltd.
- Vidya Herbs Pvt. Ltd.
- Jean Gazignaire S.A.S.
- Ungerer & Company
Recent Developments
- In April 2026, MANE Kancor presented its science-backed botanical ingredients at in-cosmetics Global 2026 in Paris, highlighting product development for personal care applications. Its business developments mainly reflect investment in natural ingredient manufacturing, research, sustainable sourcing, and international expansion.
- In January 2026, Givaudan reported annual sales of CHF 7.472 billion for 2025, with 5.1% like-for-like sales growth, net income of CHF 1.071 billion, and capital investment of CHF 233 million in property, plant, and equipment.
Report Scope
| Report Features | Description |
|---|---|
| Market Value (2025) | USD 21.0 Bn |
| Forecast Revenue (2035) | USD 33.4 Bn |
| CAGR (2026-2035) | 4.8% |
| Base Year for Estimation | 2025 |
| Historic Period | 2020-2024 |
| Forecast Period | 2026-2035 |
| Report Coverage | Revenue Forecast, Market Dynamics, Competitive Landscape, Recent Developments |
| Segments Covered | By Component (Hardware, Software, Services), By Turbine Type (Gas Turbines, Steam Turbines, Hydro Turbines, Wind Turbines), By Control System (Speed Control Systems, Load Control Systems, Temperature Control Systems, Vibration Monitoring and Control Systems, Safety and Protection Systems), By Function (Turbine Monitoring, Turbine Protection, Turbine Regulation, Turbine Automation), By Application (Power Generation, Oil and Gas, Industrial Manufacturing, Marine, Aerospace), By End User (Utilities, Independent Power Producers, Industrial Facilities, Oil and Gas Operators) |
| Regional Analysis | North America – US, Canada; Europe – Germany, France, The UK, Spain, Italy, Rest of Europe; Asia Pacific – China, Japan, South Korea, India, Australia, Singapore, Rest of APAC; Latin America – Brazil, Mexico, Rest of Latin America; Middle East & Africa – GCC, South Africa, Rest of MEA |
| Competitive Landscape | Synthite Industries Pvt. Ltd., Kalsec Inc., Plant Lipids Pvt. Ltd., MANE Kancor Ingredients Pvt. Ltd., Chenguang Biotech Group Co., Ltd., AVT Natural Products Ltd., Akay Natural Ingredients Pvt. Ltd., Universal Oleoresins Pvt. Ltd., Givaudan SA, PT Indesso Aroma, Ozone Naturals Pvt. Ltd., Paprika Oleo’s India Ltd., Vidya Herbs Pvt. Ltd., Jean Gazignaire S.A.S., Ungerer & Company |
| Customization Scope | Customization for segments, region/country-level will be provided. Moreover, additional customization can be done based on the requirements. |
| Purchase Options | We have three licenses to opt for: Single User License, Multi-User License (Up to 5 Users), Corporate Use License (Unlimited User and Printable PDF) |