


Report Overview
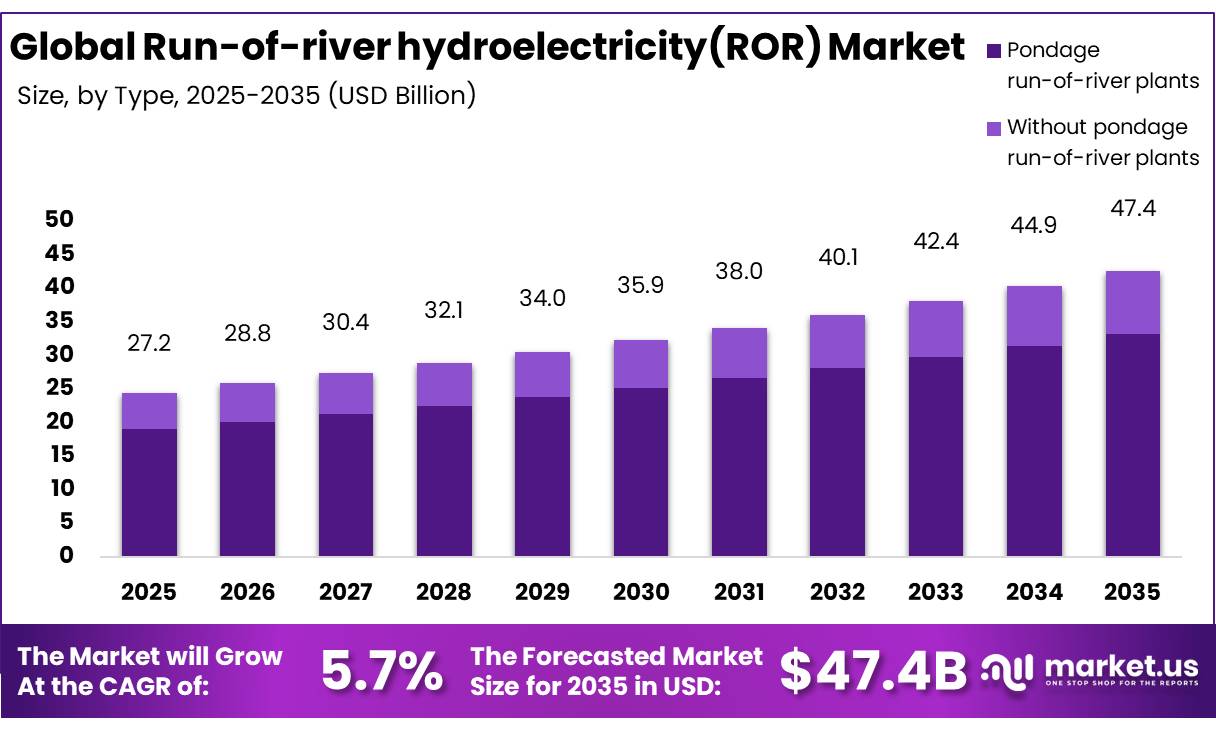
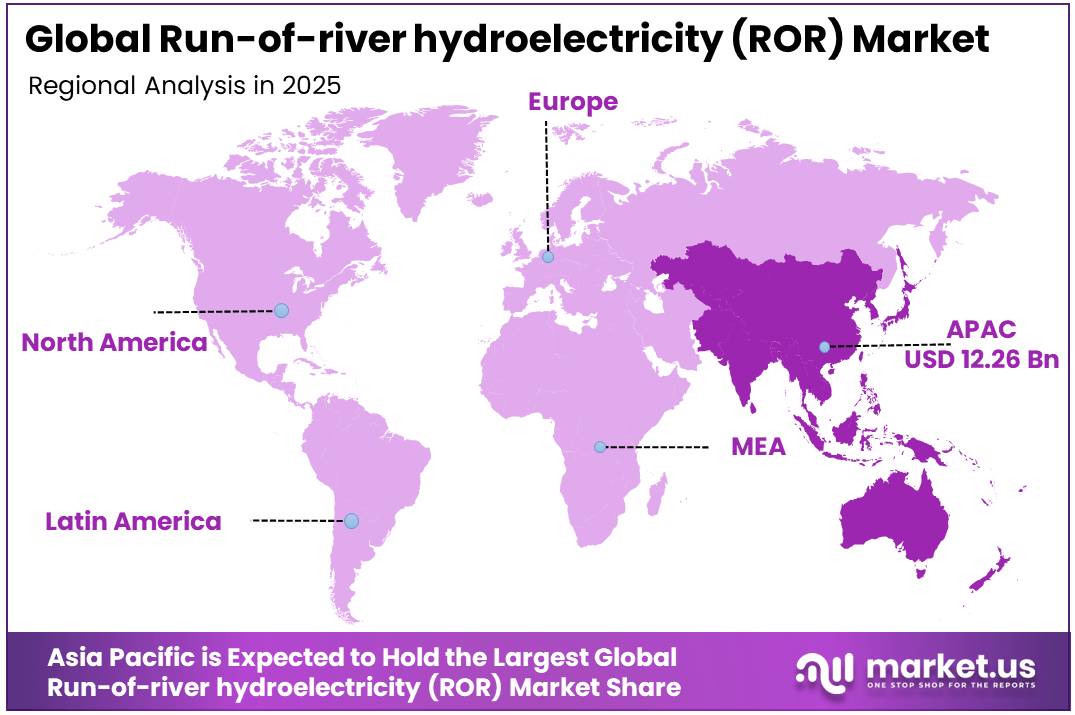
In 2025, the Global Run-of-river hydroelectricity (ROR) Market was valued at USD 27.2 billion, and between 2026 and 2035, this market is estimated to register a CAGR of 5.7%, reaching about USD 47.4 billion by 2035. In 2025, Asia Pacific led the market, achieving over 45.1% share with a revenue of USD 12.26 Billion.
Run-of-river (ROR) hydroelectricity is a renewable power generation technology that produces electricity by utilizing the natural flow and elevation drop of rivers without requiring large water storage reservoirs. Compared with conventional reservoir-based hydropower, ROR projects generally have a lower environmental footprint, reduced land inundation, and shorter construction timelines. These systems are increasingly being adopted to support national decarbonization strategies while providing reliable, low-carbon electricity.
- According to IEA Renewables 2025, Global hydropower capacity additions are projected to exceed 154 GW between 2025 and 2030, with generation expected to rise 7% over the same period to approximately 5,400 TWh annually under the IEA Net Zero Emissions Scenario, with momentum concentrated in India, ASEAN, and Africa.
Key Takeaways
- The global Run-of-river hydroelectricity (ROR) Market was valued at USD 27.2 billion in 2025.
- The market is projected to grow at a CAGR of 5.7% and is estimated to reach USD 47.4 billion by 2035.
- The market is primarily led by pondage-based run-of-river plants type, which account for the largest share at 70.1%, indicating a strong preference for systems with limited storage support to stabilize flow variability.
- By capacity, the 10–50 MW segment dominates at 44.1%, reflecting that mid-scale hydro installations are the most widely deployed, balancing efficiency, cost, and site feasibility.
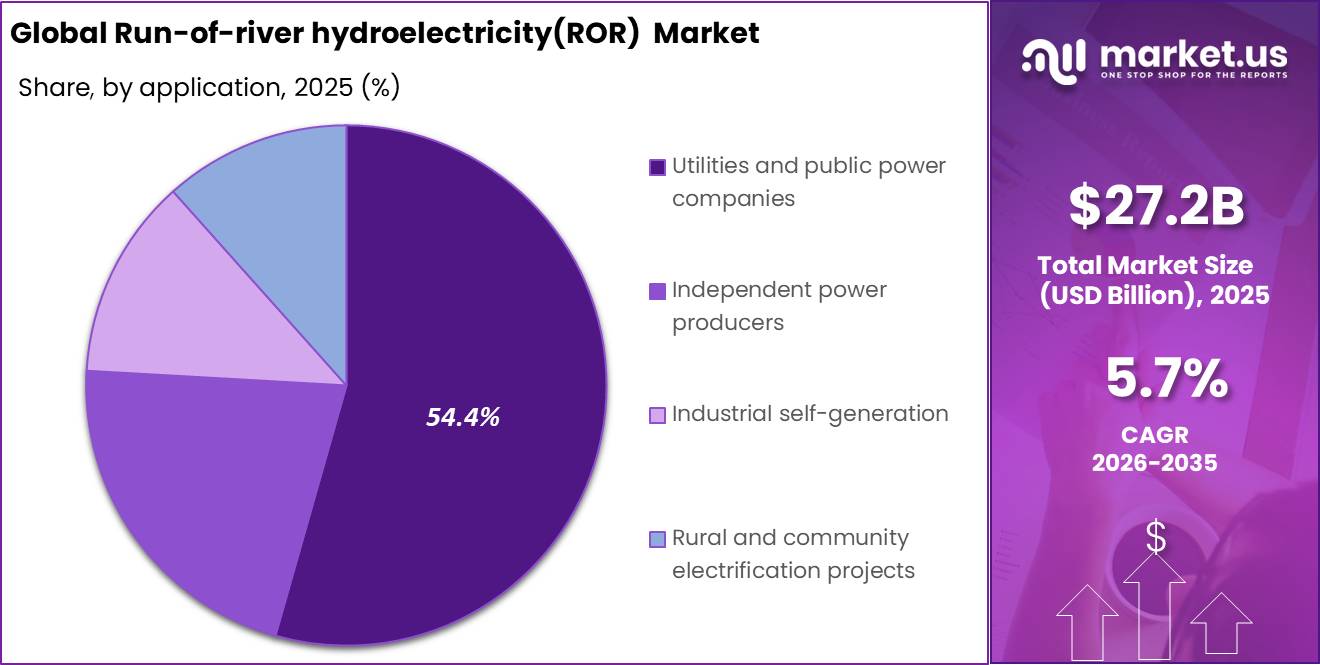
- In terms of application, utilities and public power companies hold the leading position with 54.4% share, showing that grid-oriented public generation remains the core demand driver rather than captive or niche industrial use.
- Regionally, Asia Pacific leads the market with 45.1% share, making it the most influential geography for ROR hydro expansion, driven by strong hydropower development and rising electricity demand.
A significant proportion of newly commissioned small and medium hydropower facilities utilize run-of-river configurations because they require lower capital investment than large reservoir projects while meeting stricter environmental standards. These trends continue to support sustained investment in ROR infrastructure across developed and emerging economies.
- The International Energy Agency (IEA) projects that global renewable electricity generation will increase by more than 90% between 2023 and 2030, with hydropower remaining a critical contributor to electricity system flexibility and grid stability.
Many governments are also modernizing hydropower licensing procedures, supporting grid expansion, and offering incentives for low-impact renewable generation to accelerate clean energy deployment. The run-of-river hydroelectricity industry are expected to emerge from the modernization of aging hydropower assets, digital monitoring technologies, and hybrid renewable energy systems.
- According to the International Renewable Energy Agency (IRENA), global renewable power capacity expanded by 585 GW in 2024, bringing total installed renewable capacity to approximately 4,448 GW, highlighting continued investment in clean energy infrastructure.
Digital technologies such as predictive maintenance, AI-enabled turbine optimization, and real-time river flow monitoring are improving plant efficiency while reducing operational costs. Furthermore, integrating run-of-river facilities with battery energy storage systems and smart grids is expected to enhance grid reliability and facilitate greater renewable energy penetration. Growing electrification, rising electricity demand, and continued policy support for low-carbon infrastructure are expected to position run-of-river hydropower as an important component of the global renewable energy transition.
Run-of-river hydroelectricity (ROR) Market Segment
Type Analysis
Pondage run‑of‑river plants represent dominant Segment in the Market.
Pondage run‑of‑river plants represent the dominant segment in the Run-of-river hydroelectricity (ROR) Market, accounting for 70.1% share due to structural requirement for short-term flow regulation to align generation with intra-day peak electricity demands without requiring massive reservoir flooding. Unlike pure diversion configurations, pondage setups integrate a localized weir or a small headpond that can store a few hours’ worth of water volume.
- According to the International Hydropower Association (IHA), global hydropower installed capacity reached 1,443 GW in 2024, with 6 GW of new hydropower capacity commissioned during the year. A large proportion of new small and medium hydropower developments, particularly in mountainous regions, utilize run-of-river schemes with pondage because they provide several hours of water storage for peak-load balancing while avoiding the environmental impacts associated with large reservoirs.
Ultra-low head micro-hydro tech is booming, with its global market projected to double. Driven by composite blades and low-RPM generators, these zero-construction riverbed turbines harvest energy from slow streams. Despite high initial manufacturing costs, localized microgrid incentives and smart controllers are rapidly accelerating adoption across remote communities.
Capacity Analysis
10–50 MW held Majority Share in Market.
10-50 MW, accounting for 44.1% of the run-of-river hydroelectricity market, represents the dominant material segment due to by the sweet spot this capacity tier occupies, combining utility-scale power generation with localized environmental compatibility. Installations within this power band are ideally sized to match the natural seasonal discharge profiles of secondary river branches and major tributaries without requiring massive land acquisition or capital-intensive valley excavations.
- The European Commission’s Joint Research Centre reported that run-of-river facilities larger than 10 MW represented European Union’s total 152 GW hydropower fleet.
The sub-ten megawatt segment leads growth through decentralized mini and micro installations across rural, off-grid landscapes. This expansion is driven by localized feed-in tariffs and community renewable mandates. Governments leverage these small-scale systems to anchor isolated microgrids, providing resilient baseload power that avoids long-distance transmission losses and reduces localized energy costs.
Application Analysis
Run-of-river hydroelectricity (ROR) Are Mostly Utilized in the Utilities and Public Power Companies.
The Utilities and Public Power Companies segment, accounting for 54.4% of the Run-of-river hydroelectricity (ROR) Market, remains the dominant in application category due to the structural requirement for state-backed entities to secure massive volumes of non-intermittent, low-carbon electricity to meet national climate mandates and stabilize aging transmission grids. Public power utilities possess the massive balance sheets and long-term capital horizons required to absorb the heavy initial civil engineering expenditures of run-of-river installations.
- In Uganda, the 250 MW Bujagali run-of-river facility supplied 45% of national electricity generation, displaced more than 100 MW of diesel capacity and reduced marginal electricity costs by over 65%.
The independent power producers segment is emerging as the fastest-growing application vertical, driven by private capital targeting deregulated wholesale power markets and corporate power purchase agreements. This rapid scaling is fueled by regional electricity market liberalization and open-access grid transmission policies.
Key Market Segments
By Type
- Pondage run‑of‑river plants
- Without pondage run‑of‑river plants
By Capacity
- 10–50 MW
- Up to 10 MW
- Above 50 MW
By Application
- Utilities and public power companies
- Independent power producers
- Industrial self‑generation
- Rural and community electrification projects
Driver Analysis
Government Policy Push & Targeted Fiscal Incentives
The single most proximate catalyst accelerating RoR hydroelectricity deployment in 2026 is the direct fiscal and regulatory architecture erected by sovereign governments most prominently India’s Union Cabinet-approved Small Hydro Power (SHP) Development Scheme for FY 2026–27 to FY 2030–31, backed by a USD 310 million financial outlay targeting the installation of approximately 1,500 MW of new SHP capacity across the country. Under the operational guidelines issued by MNRE in May 2026, Central Financial Assistance (CFA) is structured at up to 30% of benchmark project cost for North-Eastern states and international border districts, and up to 20% for all other regions.
The CERC Tariff Regulations 2024-29 introduce a direct monetary incentive of 50 paisa/kWh for RoR stations where saleable scheduled energy during peak hours exceeds average daily scheduled energy an innovation that fundamentally reshapes the revenue model for RoR operators by rewarding peaking contribution rather than just baseload delivery. Return on equity for new run-of-river hydro stations commissioned after April 1, 2024 has been fixed at a base rate of 15.5% under CERC regulations, providing a bankable floor return that materially de-risks project financing.
The scheme’s phased CFA disbursement 50% upon achievement of 50% physical and financial progress, and the balance upon commercial operation achieving at least 80% of projected generation enforces execution discipline while maintaining developer liquidity. SECI has been designated the National Programme Implementing Agency (NPIA), centralising procurement and oversight to reduce transaction costs and improve project bankability at the portfolio level.
Drivers Impact Analysis
| Driver | (~) % Impact on CAGR Forecast | Geographic Relevance | Impact Timeline |
|---|---|---|---|
| Government Policy Push & Targeted Fiscal Incentives | +2.2% | India core, North-Eastern States, Himalayan corridors, APAC spill-over | Short term (≤ 2 years) |
| Grid Flexibility Imperative & VRE Balancing Demand | +1.8% | India, EU, North America, APAC corridors | Medium term (2–4 years) |
| Cross-Border Hydropower Trade Agreements | +1.5% | South Asia core (Nepal, Bhutan, India, Bangladesh) | Medium term (2–4 years) |
| Untapped Hydropower Basin Development Brahmaputra & APAC Corridors | +1.9% | India (Northeast, Arunachal Pradesh), Indonesia, Bhutan, Africa | Long term (≥ 4 years) |
| Low Lifecycle Carbon Intensity & Carbon Credit Market Integration | +1.2% | Global; EU ETS, India ICM, voluntary markets; South America spill-over | Medium term (2–4 years) |
| Digitalization & SCADA-Driven Operational Efficiency | +1.0% | North America core, EU, India, APAC corridors | Medium term (2–4 years) |
Restraint Analysis
Hydrological Variability & Climate-Induced Streamflow Disruption
Run-of-river hydropower is uniquely and structurally vulnerable to hydrological volatility because, unlike storage hydropower, it carries no reservoir buffer to smooth inflow variability into dispatchable output the generation profile is a near-direct function of instantaneous river discharge. The severity of this structural vulnerability was empirically confirmed in FY 2023–24, when India’s hydroelectric power generation declined by 16.3% the steepest fall in 38 years driven by the lowest monsoon rainfall recorded since 2018, causing India’s hydro share in the national energy mix to fall to a historic low of 8.3% against a ten-year average of 12.3%; this single-year output collapse was sufficient to force a significant substitution toward coal-fired generation, creating both commercial revenue destruction for hydro developers and stranded fixed-cost exposure.
The global dimension was equally pronounced: worldwide hydropower generation fell by an estimated 99.74 terawatt-hours year-on-year in 2023, with China the world’s largest hydropower producer experiencing droughts and heat waves that severely impaired reservoir levels and cascaded into supply reliability failures.
The U.S. Geological Survey’s 2025 analysis of future U.S. water availability confirms that increased mean temperature, extreme heat, and precipitation extremes are prevalent cross-sector drivers of water cycle disruption, while UNEP FI quantified in 2025 that the loss of glacier-fed freshwater supplies could put $4 trillion in global GDP at risk, with water scarcity potentially reducing economic productivity by up to 6% of GDP in affected regions parameters that directly undermine the long-term bankability of RoR projects whose financial models assume stable 30–40-year hydrology anchored to historical flow records that are rapidly becoming obsolete.
Restraint Impact Analysis
| Restraint | (~) % Impact on CAGR Forecast | Geographic Relevance | Impact Timeline |
|---|---|---|---|
| Mandatory E-Flow Regulation & Environmental Clearance Burden | -1.8% | South Asia (India, Nepal), EU (WFD jurisdictions), North America (FERC states) | Medium term (2–4 years) |
| Multi-Year Regulatory Licensing & Permitting Gridlock | -1.5% | North America (FERC corridors), EU member states, South/Southeast Asia | Medium to Long term (3–7 years) |
| Hydrological Variability & Climate-Induced Streamflow Disruption | -2.0% | Himalayan corridors (India, Nepal, Bhutan), Central Asia, Andean LATAM, EU Alpine | Long term (≥ 4 years) |
| High Upfront CapEx, Geotechnical Risk & Cost Overrun Exposure | -1.6% | APAC (Himalayan/HKH region), Sub-Saharan Africa, LATAM | Medium to Long term (3–6 years) |
| Transboundary Water Disputes & Geopolitical Treaty Friction | -1.2% | South Asia (India–Pakistan, India–Bangladesh), Central Asia, Mekong Basin, Nile Basin | Long term (≥ 4 years) |
| Tariff Competitiveness Erosion from Solar/Wind & Short-Tenor Debt Structure | -1.0% | India (state utility offtake), EU, Southeast Asia | Short to Medium term (1–3 years) |
Opportunity Analysis
Ancillary Services & GridBalancing Revenue Stacking on Existing RoR Fleets
A 2026 peer reviewed study explicitly identified run of river plants as “a considerably robust option with the best potential” for ancillary services and contract based revenue stacking among storage comparable technologies; ancillary services markets in the UK, DACH region, and the Nordic countries each operate dedicated mechanisms, including dynamic containment, balancing reserves, and frequency response markets where revenue per MW can range from €20,000 to €80,000/MW/year depending on market and contract type, representing a potential 15–25% uplift to plant level revenue with zero incremental capital expenditure beyond control system software upgrades and SCADA modernization.
The U.S. DOE’s Water Power Technical Collaboration Program explicitly supports digital twin and advanced controls development for hydropower facilities with a cost share model of up to USD 240,000 per party providing a subsidized pathway for operators to develop the realtime control capability needed for ancillary market participation.
The incremental margin opportunity is estimated at 12–20 percentage points of net revenue improvement for assets that successfully transition from energy only to energy-plus-ancillaries commercial models, with the largest available pools concentrated in EU markets where grid flexibility is a top regulatory priority given the rapid increase in variable renewable penetration now exceeding 40–60% of generation mix in leading markets.
Opportunity Impact Analysis
| Opportunity | (~) % Potential CAGR Upside | Geographic Relevance | Execution Window |
|---|---|---|---|
| Non-Powered Dam (NPD) RoR Electrification Roll-Up | +1.8% | North America (US core), South Asia (India, Nepal) | Short term (≤ 2 years) |
| Hybrid RoR-Solar PV Co-location on Shared Transmission | +1.5% | APAC (Turkey, India), EU (Alpine, Balkan corridors) | Short term (≤ 2 years) |
| Hyperscaler 24/7 CFE Direct-PPA Monetization | +2.2% | North America (PJM, MISO), EU (Nordics, Alpine), India | Medium term (2–4 years) |
| RoR-Tethered Green Hydrogen Production in Himalayan & African Basins | +1.6% | South Asia (Nepal, Bhutan), Sub-Saharan Africa (Congo, East Africa) | Medium term (2–4 years) |
| Sub-Saharan Africa Untapped RoR Basin Development via Blended Finance | +2.5% | Sub-Saharan Africa (DRC, East Africa, West Africa) | Long term (≥ 4 years) |
| Ancillary Services & Grid-Balancing Revenue Stacking on Existing RoR Fleets | +1.3% | EU (DACH, Nordics, UK), North America (PJM, CAISO) | Medium term (2–4 years) |
Challenges Analysis
Sediment Abrasion & Turbine Degradation
Unlike reservoir-based projects where settlement time reduces sediment concentration at intakes, ROR schemes by design operate on near-natural river flows with negligible impoundment storage, exposing turbines and hydraulic components to suspended sediment concentrations (SSC) that routinely spike above 5,000 parts per million (ppm) during monsoon peaks in Himalayan rivers a threshold at which NHPC and SJVN operational protocols mandate forced plant shutdowns to prevent runner damage.
India’s Central Board of Irrigation and Power (CBIP) has documented that abrasive erosion of Francis and Pelton turbine components in high-silt projects is directly proportional to the 0.384th power of SSC and to particle velocity, translating into runner replacement cycles of 5–8 years instead of the design-lifecycle norm of 15–20 years, and imposing per-unit O&M cost inflation estimated at 30–45% above low-silt baseline operations. The structural root of this challenge lies in catchment degradation: unsustainable land-use practices, deforestation along river embankments, and road construction for project access increase upstream soil erosion rates, worsening the sediment yield into the river even after desilting chambers and excluders are installed.
The National Mission for Clean Ganga’s National Framework for Sediment Management acknowledges that existing desilting infrastructure designed around 0.2 mm exclusion thresholds provides only “qualitative” protection based on empirical thumb rules rather than dynamic silt-load modelling, and calls for permanent hydrographic observation stations, catchment area treatment investments, and coordinated cascade flushing protocols across adjacent projects. Strategically, operators must invest in turbine coatings, automated desilting chamber sensors, real-time sediment forecasting tied to SCADA systems, and annual bathymetric reservoir surveys each representing continuous, non-deferrable capital allocation that directly compresses project-level IRR and drags realized sector CAGR below potential.
Challenges Impact Analysis
| Challenge | (~) % CAGR Friction Drag | Geographic Relevance | Mitigation Horizon |
|---|---|---|---|
| Sediment Abrasion & Turbine Degradation | -1.4% | APAC Himalayan corridors; South Asia (India, Nepal, Bhutan); Andean LATAM | Long term (≥ 4 years) |
| Hydrological Variability & Climate-Induced Flow Uncertainty | -1.1% | Global; High severity: South Asia monsoon belts, Mekong Basin, Alpine EU | Long term (≥ 4 years) |
| Environmental Flow (E-Flow) Compliance & Regulatory Drift | -0.9% | EU Water Framework Directive zones; India NGT/MoEFCC jurisdictions; U.S. FERC relicensing corridors | Medium term (2–4 years) |
| Specialized Workforce Shortage & Knowledge Attrition | -0.8% | North America (Pacific NW, Southeast); APAC emerging markets; Global talent pipeline | Medium term (2–4 years) |
| Transmission Infrastructure Gaps & Grid Evacuation Bottlenecks | -1.0% | India (Himalayan NE states); Remote mountainous APAC; Latin American headwater regions | Long term (≥ 4 years) |
| Transboundary Water Governance & Geopolitical Flow Risk | -0.7% | South Asia (Indus, Brahmaputra basins); Mekong riparian states; Nile headwaters | Long term (≥ 4 years) |
Geopolitical Impact Analysis
Impact of Geopolitical Conflicts on the Run-of-River Hydropower Market.
Ongoing military conflicts have had a noticeable impact on the global run-of-river (ROR) hydroelectricity market, bringing both challenges and new momentum for change. In war-affected regions like Ukraine, energy infrastructure has come under direct attack, with drones and artillery damaging key ROR facilities and disrupting local electricity supply.
At the same time, these conflicts have pushed governments to rethink their energy strategies. Rising fuel prices and uncertain supply chains have highlighted the risks of depending heavily on imported fossil fuels. As a result, many countries are now accelerating their shift toward cleaner, more secure energy sources.
Within this shift, run-of-river hydropower is gaining more attention because it can generate steady, renewable electricity without requiring large reservoirs or extensive land use. This makes it an attractive option for faster deployment and government-backed projects. However, the market is still facing real hurdles. Higher equipment costs, shortages of raw materials, and disrupted global shipping routes are making project development more expensive and slower than before.
Regional Analysis
Asia Pacific Held the Largest Share of the Run-of-river hydroelectricity (ROR) Market.
In 2025, the Asia Pacific dominated the Run-of-river hydroelectricity (ROR) Market, holding about 45.1% of the total market share, driven by rapid industrialization, high population density, and aggressive infrastructure development in China and India. This market growth is supported by substantial state-backed financing and the need to meet surging energy demand through low-carbon sources.
Conversely, Europe focuses on modernizing existing infrastructure within strict environmental frameworks, while North America concentrates on upgrading aging assets and decentralized, community-scale projects. Emerging markets in Latin America and Africa are slowly unlocking untapped potential through international funding, focusing on niche sustainability and regional power security.
Key Regions and Countries Covered
- North America
- The US
- Canada
- Europe
- Germany
- France
- The UK
- Spain
- Italy
- Russia & CIS
- Rest of Europe
- APAC
- China
- Japan
- South Korea
- India
- ASEAN
- Rest of APAC
- Latin America
- Brazil
- Mexico
- Rest of Latin America
- Middle East & Africa
- GCC
- South Africa
- Rest of MEA
Key Players Analysis
The global run-of-river (ROR) hydroelectricity market is highly concentrated with oligopolistic market behaviour. The industry is shaped by top engineering companies and large, state-supported utility groups that have a strong grip on the market. This concentration makes it very hard for new companies to enter because setting up a project requires a lot of money, goes through complicated environmental approval processes, and takes a long time to get permission to use local water sources and transmission lines.
ABB Ltd. remains a major technology provider in the global run-of-river (ROR) hydroelectricity market through its advanced generators, digital automation systems, protection relays, and grid integration solutions. In 2025, the company generated US$32.9 billion in revenue and operated in more than 100 countries with approximately 110,000 employees.
Alstom Hydro continues to support the global run-of-river hydroelectricity market through its turbine, generator, and hydro-mechanical technologies, now operating as part of GE Vernova’s hydropower business. The company has contributed equipment to hydroelectric facilities with a combined installed capacity exceeding 400 GW worldwide. In 2025, GE Vernova reported approximately US$34.9 billion in revenue.
The Major Players In The Industry
- ABB Ltd
- Alstom Hydro
- Andritz Hydro (ANDRITZ Group)
- Voith Hydro
- GE Energy / GE Vernova
- Siemens Energy
- China Three Gorges Corporation
- Sinohydro Corporation
- China Hydroelectric Corporation
- Statkraft
- Hydro‑Québec
- Tata Power
- CPFL Energia S.A.
- Uniper Kraftwerke GmbH
- RWE Generation SE
- Other Players
Key Development
- In May 2026, Tata Power and Bhutan’s Druk Green Power Corporation (DGPC) updated their existing Memorandum of Understanding. This update includes the 404 MW Nyera Amari I & II Integrated Hydropower Project, increasing the combined capacity of their joint projects to 5,033 MW. The amendment was signed in the presence of Bhutan’s Prime Minister.
- In April 2026, Statkraft signed two long-term power purchase agreements with Hydro Energi AS. These agreements ensure the delivery of 9 TWh of electricity per year from 2029 to 2030 and 1.3 TWh per year from 2031 to 2038. This means a total of 12.3 TWh of hydropower will be supplied over 10 years to Hydro’s main aluminum production facilities in Norway.
Report Scope
| Report Features | Description |
|---|---|
| Report Features | Description |
| Market Value (2025) | USD 27.2 Bn |
| Forecast Revenue (2035) | USD 47.4 Bn |
| CAGR (2026-2035) | 5.7% |
| Base Year for Estimation | 2025 |
| Historic Period | 2020-2024 |
| Forecast Period | 2026-2035 |
| Report Coverage | Revenue Forecast, Market Dynamics, Competitive Landscape, Recent Developments |
| Segments Covered | By Type (Pondage run‑of‑river plants, Without pondage run‑of‑river plants), By Capacity (10–50 MW, Up to 10 MW, Above 50 MW), By Application (Utilities and public power companies, Independent power producers, Industrial self‑generation, Rural and community electrification projects) |
| Regional Analysis | North America – The US & Canada; Europe – Germany, France, The UK, Spain, Italy, Russia & CIS, Rest of Europe; APAC– China, Japan, South Korea, India, ASEAN & Rest of APAC; Latin America– Brazil, Mexico & Rest of Latin America; Middle East & Africa– GCC, South Africa, & Rest of MEA |
| Competitive Landscape | ABB Ltd, Alstom Hydro, Andritz Hydro (ANDRITZ Group), Voith Hydro, GE Energy / GE Vernova, Siemens Energy, China Three Gorges Corporation, Sinohydro Corporation, China Hydroelectric Corporation, Statkraft, Hydro‑Québec, Tata Power, CPFL Energia S.A., Uniper Kraftwerke GmbH, RWE Generation SE, and Other Players. |
| Customization Scope | Customization for segments, region/country-level will be provided. Moreover, additional customization can be done based on the requirements. |
| Purchase Options | We have three licenses to opt for: Single User License, Multi-User License (Up to 5 Users), Corporate Use License (Unlimited Users and Printable PDF) |





































