


Report Overview
In 2025, the Global Public Cloud Market was valued at USD 806.3 billion. The market is projected to grow at a CAGR of 16.5% during 2026–2035, reaching approximately USD 3713.4 billion by 2035. North America dominated the global market in 2025, accounting for more than 37.4% of the total market share and generating approximately USD 301.6 billion in revenue.
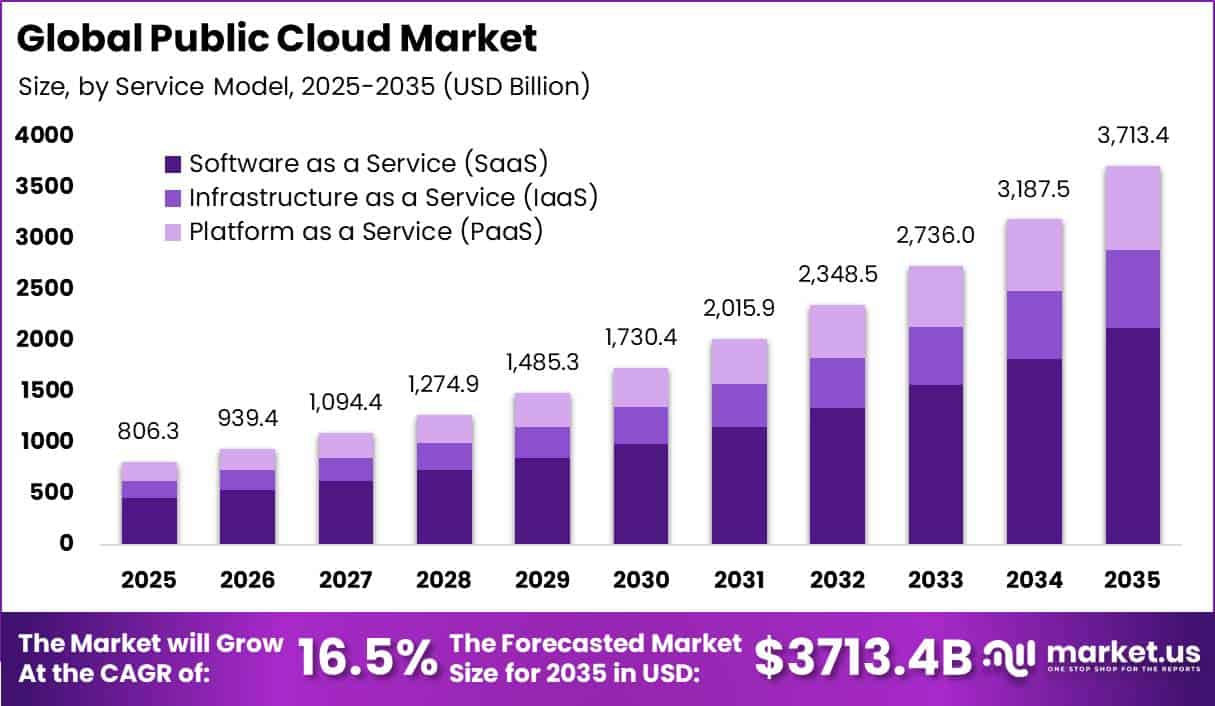
Growth is supported by the shift of e-mail, office software, file storage, cybersecurity, finance, accounting, databases, analytics, software development, and AI workloads from company-owned servers to pay-as-you-use cloud platforms. According to Eurostat, 52.7% of EU enterprises used paid cloud services in 2025, up 7.4 percentage points from 2023 and well above 17.8% in 2014.
Adoption among large enterprises reached 84.7%. Among cloud users, 85.2% used e-mail services, 71.7% office software, 71.5% file storage, 65.5% security applications, 58.2% finance or accounting software, and 45.5% database hosting. The IEA expects global data-centre electricity demand to increase from about 415 TWh in 2024 to around 945 TWh by 2030, an increase of approximately 530 TWh, or more than 2.2 times.
The United States accounted for about 45% of global data-centre electricity use in 2024, while demand could rise by roughly 240 TWh, or about 130%, between 2024 and 2030. U.S. data-centre construction spending also increased from roughly USD 10 billion in 2021 to nearly USD 40 billion in the first half of 2025. UNCTAD reported more than USD 530 billion in greenfield digital-economy projects across developing economies during 2020–2024.
Key Takeaway
- The Public Cloud Market was valued at USD 806.3 billion in 2025 and is projected to reach USD 3713.4 billion by 2035 at a 16.5% CAGR.
- In 2025, SaaS led the public cloud market with a 57.1% share, driven by strong demand for ready-to-use, web-based business applications.
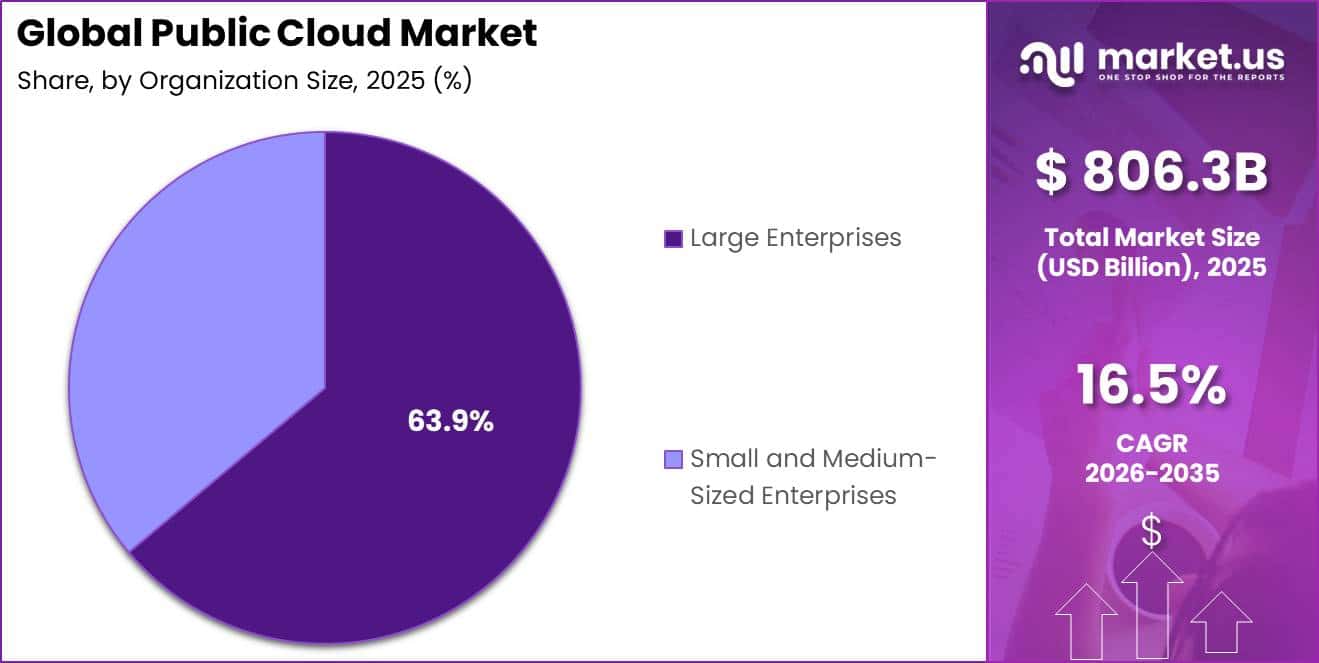
- In 2025, large enterprises held a 63.9% share, supported by complex operations, high data volumes, and large-scale cloud requirements.
- In 2025, BFSI captured a 22.5% share, driven by growing demand for secure transaction processing, data management, fraud detection, and regulatory compliance.
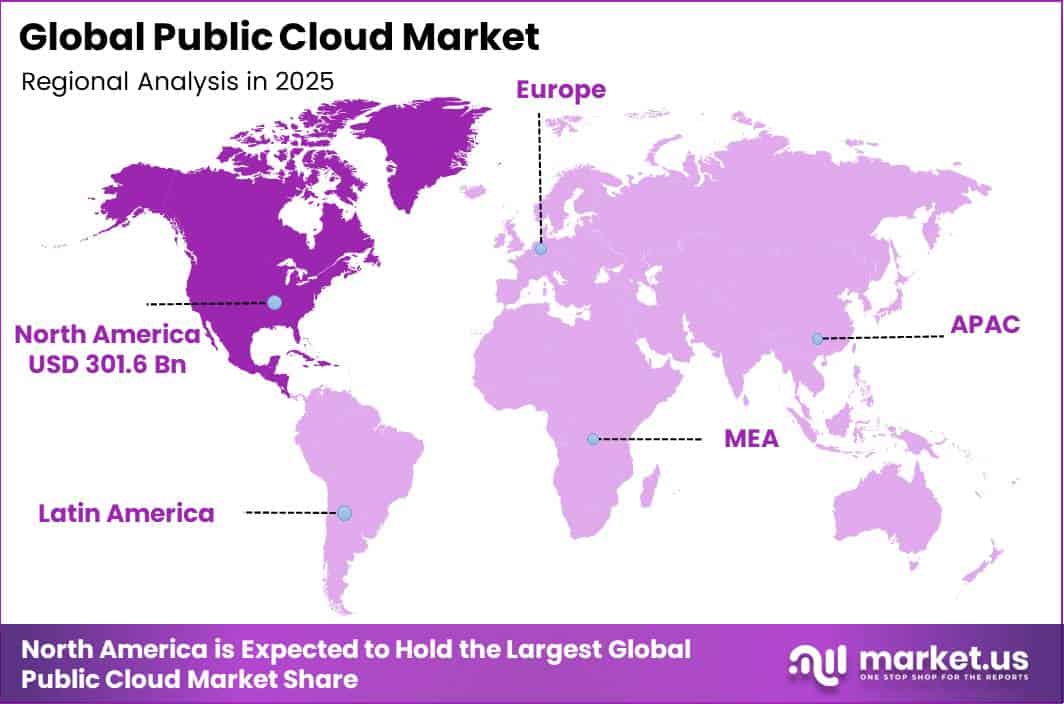
- North America led the market in 2025 with a 37.4% share, worth approximately USD 301.6 billion.
Market Statistics and Data Insights
- Eurostat reported that 52.7% of EU enterprises purchased cloud computing services in 2025, up 7.4 percentage points from 2023 and from only 17.8% in 2014. Among cloud users, 85.2% purchased e-mail services, 71.7% office software, 71.5% file storage, 65.5% security software, 58.2% finance/accounting software, 45.5% database hosting, and 28.2% computing power for their own applications.
- In 2025, 20.0% of EU enterprises used AI, up from 13.5% in 2024, 8.1% in 2023, and 7.7% in 2021. AI adoption reached approximately 55% among large businesses, compared with 19% among SMEs. Written-language analysis was used by 11.8% of enterprises, image/video/audio generation by 9.5%, and written or spoken language generation by 8.8%.
- UNCTAD reported that announced foreign investment in data centres exceeded USD 270 billion in 2025. Data centres represented more than one-fifth of global greenfield project values, while overall global FDI increased 14% to about USD 1.6 trillion. Announced semiconductor project values also increased 35%, supporting the broader computing infrastructure needed by cloud operators.
- IEA estimates data centres consumed about 415 TWh of electricity in 2024, equal to roughly 1.5% of worldwide electricity consumption. Demand is projected to reach around 945 TWh by 2030, growing about 15% annually, and approximately 1,200 TWh by 2035 in its base case. Accelerated servers, largely driven by AI, are expected to increase electricity use by around 30% annually.
- Eurostat reported that approximately 53% of EU businesses purchased cloud services in 2025. Adoption reached around 85% among large businesses, compared with only 52% among SMEs, leaving a substantial addressable base for cloud migration among smaller firms.
- Microsoft reported that Azure surpassed USD 75 billion in annual revenue in FY2025, growing 34%. The company operated more than 400 data centres across 70 regions and added more than 2 GW of new data-centre capacity during 12 months. Microsoft also stated that every Azure region had become AI-first.
- Microsoft reported in FY2025 that it operated more than 400 data centres across 70 cloud regions and added more than 2 GW of new data-centre capacity during the year.
- Oracle’s FY2026 customer disclosures reported that Skyone’s move to Oracle Cloud Infrastructure produced a 35% cost reduction and approximately 3× performance improvement.
- In 2025, 30.1% of cloud-using EU enterprises purchased ERP applications, 28.2% purchased computing power for their own software, 27.9% used CRM software, and 26.1% used cloud platforms for application development, testing, or deployment.
- AWS analyzed more than 71,000 opted-in customers in 2026 and found a median cloud Cost Efficiency score of 83 versus a mean of 79. Only 17.7% of eligible customers enabled EC2 memory metrics, although doing so was associated with 8–30 percentage points higher savings per optimization recommendation.
- In a 2026 AWS optimization case, a SaaS company reduced cloud costs by 39% within 12 weeks while preparing for 10× growth and consolidated more than 150 Network Load Balancers into 5 Application Load Balancers with zero downtime.
By Service Model
In 2025, Software as a Service (SaaS) dominated the public cloud market with a 57.1% share, supported by strong enterprise demand for ready-to-use software delivered through web-based platforms. SaaS reduces the need for companies to purchase, install, maintain, and regularly update software on their own servers.
According to Eurostat, 46.45% of EU enterprises used enterprise resource planning (ERP) software in 2025, while 28.51% used customer relationship management (CRM) software and 16.28% adopted business-intelligence tools. Overall, 53.47% of enterprises used at least one of these specialised business systems. Adoption was significantly higher among large enterprises, where ERP usage reached 88.71%, compared with 41.08% among small enterprises.
CRM adoption among large companies also reached 65%. These applications support important functions such as finance, procurement, inventory management, sales, customer information, and business reporting. SaaS platforms are well suited to these requirements because they offer subscription-based access, automatic updates, remote availability, and easier integration across business locations.
By Organization Size
In 2025, Large Enterprises dominated the public cloud market with a 63.9% share, mainly due to their complex operations, large data volumes, and presence across multiple offices, countries, suppliers, and customer networks. Their scale creates strong demand for cloud computing, storage, cybersecurity, system integration, and AI infrastructure.
According to Eurostat, 55.03% of large EU enterprises used artificial intelligence in 2025, compared with 30.36% of medium-sized enterprises and 17% of small enterprises. Higher AI adoption increases the need for scalable computing power, large data-storage capacity, and secure cloud access. Large companies also showed stronger overall digital adoption, with 96% reaching at least a basic level of digital intensity in 2025, compared with 69% of small enterprises.
Their high level of online business activity further supports cloud demand. In 2024, 48.4% of large EU enterprises conducted e-sales, while e-sales accounted for 24.2% of their total turnover. These businesses depend on continuous access to applications, payment platforms, order-management systems, customer databases, analytics, and security tools.
By Industry Vertical
In 2025, the BFSI segment led the public cloud market with a 22.5% share, supported by the growing need of banks, insurers, payment companies, and investment firms to manage large volumes of transactions, customer data, fraud checks, and regulatory reporting. According to the World Bank’s Global Findex 2025, 79% of adults worldwide had a financial account in 2024, while about two-thirds of government-payment recipients received their payments digitally.
Growth potential also remains strong because nearly 900 million unbanked adults already own a mobile phone, including around 530 million with a smartphone. As digital payments and mobile financial services expand, BFSI companies are expected to increase spending on cloud security, databases, AI-based analytics, backup systems, and compliance solutions, supporting the segment’s leading 22.5% market position.
Key Market Segments
By Service Model
- Software as a Service (SaaS)
- Infrastructure as a Service (IaaS)
- Platform as a Service (PaaS)
By Organization Size
- Small and Medium-Sized Enterprises
- Large Enterprises
By Industry Vertical
- BFSI
- IT and Telecommunication
- Manufacturing
- Healthcare
- Retail
- Government
- Media and Entertainment
- Other
Geopolitical Impact Analysis
Geopolitical disruption is increasing the cost and delivery time of physical infrastructure used to support public cloud services, including servers, storage systems, networking equipment, cooling systems, backup generators, power distribution units, and semiconductors. According to UN Trade and Development (UNCTAD), Red Sea disruptions forced ships to reroute around the Cape of Good Hope, reducing Suez Canal transits by 70% and vessel tonnage through the Gulf of Aden by 76% by mid-2024.
On the Shanghai–Europe route, spot freight rates increased 256% to USD 2,648 per TEU by February 2024, while the China Containerized Freight Index rose 120% between October 2023 and June 2024. Longer shipping routes increase fuel costs, insurance expenses, inventory requirements, and delivery times for servers, racks, power systems, and replacement components.
These factors can raise data-centre construction costs and delay cloud-capacity expansion. Trade policies are adding further pressure. In 2025, U.S. Section 232 tariffs on imported steel, aluminium, and derivative products increased from 25% to 50%. These materials are widely used in data-centre buildings, server racks, electrical enclosures, cooling equipment, cable trays, and backup-power systems. Energy costs are another major concern.
The International Energy Agency expects data-centre electricity consumption to increase by around 15% annually from 2024 to 2030. As geopolitical conflicts affect shipping routes, energy supplies, and equipment availability, cloud providers are likely to diversify suppliers, maintain larger hardware inventories, select lower-risk locations, and secure longer-term electricity contracts.
Regional Analysis
North America led the global public cloud market in 2025, accounting for 37.4% of total revenue, equal to approximately USD 301.6 billion. The region benefits from a strong base of hyperscale data centres, enterprise software companies, financial institutions, technology firms, retailers, and users of AI, analytics, cybersecurity, and digital platforms. The United States remains the main growth driver.
According to UN Trade and Development (UNCTAD), announced U.S. greenfield data-centre projects reached about USD 38 billion in the first three quarters of 2025, while semiconductor projects attracted another USD 137 billion. These investments are expanding computing, storage, networking, and AI capacity.
The International Energy Agency (IEA) also expects U.S. electricity demand to increase by about 2% annually during 2025–2027, with rising data-centre demand identified as a key factor. Asia Pacific is expected to be the fastest-growing regional market, supported by rapid digitalisation across China, India, Southeast Asia, Japan, South Korea, and Australia.
UNCTAD reported that the Republic of Korea attracted approximately USD 21 billion in announced greenfield data-centre investment during the first three quarters of 2025, making it the third-largest recipient globally. India received around USD 7 billion, while Malaysia attracted about USD 4 billion.
Key Regions and Countries
North America
- US
- Canada
Europe
- Germany
- France
- The UK
- Spain
- Italy
- Rest of Europe
Asia Pacific
- China
- Japan
- South Korea
- India
- Australia
- Rest of APAC
Latin America
- Brazil
- Mexico
- Rest of Latin America
Middle East & Africa
- GCC
- South Africa
- Rest of MEA
Market Dynamics
Drivers
| Driver | (~) % CAGR | Geographic Relevance | Impact Timeline |
|---|---|---|---|
| AI Computing Demand | +2.4% | Global | Short term (2 years or less) |
| Enterprise Software Modernization | +1.8% | North America and Europe | Medium term (2 to 4 years) |
| Digital Public Services | +1.1% | Asia Pacific and Europe | Medium term (2 to 4 years) |
| Cloud Security Adoption | +1.0% | Global | Short term (2 years or less) |
| Industry Platform Migration | +0.8% | Global | Long term (4 years or more) |
AI Computing Demand
AI is becoming a major growth driver for public cloud services because model training, inference, vector databases, high-speed networking, and data pipelines require large computing capacity. According to the IEA, global data-centre electricity consumption is projected to increase from about 415 TWh in 2024 to approximately 945 TWh by 2030, with AI workloads contributing strongly to this growth. Consumption could reach around 1,200 TWh by 2035.
Enterprise AI adoption is also increasing recurring cloud demand. Eurostat reported that 20% of EU enterprises used AI technologies in 2025, while OECD data shows cloud adoption averaging about 49% among firms with at least 10 employees.
As organisations shift AI computing, data management, and cybersecurity workloads to usage-based cloud platforms, spending moves from one-time hardware purchases toward recurring cloud services. This trend could provide an estimated +2.4% incremental CAGR upside to public cloud market growth.
Restraints
| Restraint | (~) % CAGR | Geographic Relevance | Impact Timeline |
|---|---|---|---|
| Power Grid Connection Limits | -1.7% | North America and Europe | Short term (2 years or less) |
| Data Sovereignty Restrictions | -1.2% | Europe, China, India and Middle East | Medium term (2 to 4 years) |
| High Financing Costs | -0.8% | Global | Short term (2 years or less) |
| Export Controls on Chips | -0.7% | China and selected emerging markets | Medium term (2 to 4 years) |
| Public Procurement Constraints | -0.5% | Europe and emerging markets | Medium term (2 to 4 years) |
Power Grid Connection Limits
Electricity availability is a major restraint for public cloud expansion because new data-centre regions require sufficient generation, transmission, and grid-connection capacity before operations can begin. According to the IEA, global data-centre electricity demand is expected to rise from about 415 TWh in 2024 to approximately 945 TWh by 2030.
In the United States, data-centre electricity demand could increase by around 240 TWh between 2024 and 2030, representing nearly 130% growth. Grid development often takes several years, while data-centre demand can increase much faster.
The U.S. Federal Energy Regulatory Commission reports that interconnection queues contain more than 2,600 GW of proposed generation and storage capacity. Limited grid access can delay new facilities and increase spending on backup generation, private power systems, and long-term electricity contracts. These constraints could reduce baseline public cloud market growth by an estimated -1.7%.
Challenges
| Challenge | (~) % CAGR | Geographic Relevance | Mitigation Horizon |
|---|---|---|---|
| Cybersecurity Skills Shortage | -1.3% | Global | Long term (4 years or more) |
| Advanced Chip Supply | -1.0% | Global | Medium term (2 to 4 years) |
| Water Use Management | -0.6% | Water-stressed regions | Long term (4 years or more) |
| Multi-Cloud Integration Complexity | -0.5% | Global | Medium term (2 to 4 years) |
| Network Latency Requirements | -0.4% | Asia Pacific and emerging markets | Medium term (2 to 4 years) |
Cybersecurity Skills Shortage
Cybersecurity capability remains a key growth challenge for public cloud adoption because cloud environments require skilled teams for configuration, identity management, monitoring, incident response, and application security.
According to ISC2, the global cybersecurity workforce gap reached approximately 4.8 million professionals in 2024, highlighting a major shortage of specialised talent. The skills gap increases labour costs, slows complex cloud migrations, and raises dependence on managed-security services.
Financial institutions also face higher operational and concentration risks as critical technology services become more centralised. Without faster improvement in cybersecurity capabilities, this challenge could create an estimated -1.3% drag on maximum market growth, although the overall public cloud outlook remains positive.
Opportunities
| Opportunity | (~) % CAGR | Geographic Relevance | Execution Window |
|---|---|---|---|
| Sovereign Cloud Platforms | +2.0% | Europe, Middle East and Asia Pacific | Medium term (2 to 4 years) |
| Industry-Specific AI Clouds | +1.5% | Global | Medium term (2 to 4 years) |
| Cloud Switching Services | +1.0% | European Union | Short term (2 years or less) |
| Edge Cloud Monetization | +0.9% | Asia Pacific and North America | Long term (4 years or more) |
| Green Cloud Contracts | +0.7% | Europe and North America | Medium term (2 to 4 years) |
Sovereign Cloud Platforms
Sovereign cloud remains a future growth opportunity as many public-sector, defence, healthcare, and financial workloads still require local data control and strict compliance before moving to the cloud. The EU Data Act became applicable on 12 September 2025, while cloud switching charges must be eliminated by 12 January 2027, which could reduce migration barriers.
OECD data also shows that cloud adoption ranges from only 16% to more than 70% among firms with at least 10 employees, leaving significant room for compliant local cloud services. Sovereign cloud platforms can help governments and regulated industries improve security, data governance, and operational resilience.
Providers that establish local infrastructure, partnerships, certifications, and dedicated operations could benefit from higher-value managed-service contracts. Wider adoption of these platforms could create an estimated incremental CAGR upside of around +2.0% above the baseline, particularly as regulated workloads gradually move toward locally controlled cloud environments.
Key Players Analysis
The public cloud market is led by Tier-1 hyperscalers AWS, Microsoft Azure, and Google Cloud, which are estimated to account for around 60%–70% of global public-cloud spending. This is an analyst estimate rather than a company-reported market share. AWS generated USD 128.7 billion in 2025 revenue, increasing 20%, with operating income of USD 45.6 billion.
Amazon’s cash capital expenditure reached USD 128.3 billion, with a large portion supporting AWS infrastructure. Microsoft reported USD 143.0 billion in FY2025 Intelligent Cloud revenue, up 21%, while Azure exceeded USD 75 billion in annual revenue and grew 34%. Google Cloud generated USD 58.7 billion in 2025, up 36%. Alphabet invested USD 91.4 billion, with about 60% allocated to servers and 40% to data centres and networking.
Among Tier-2 competitors, Oracle reported USD 44.0 billion in FY2025 cloud services and licence-support revenue, up 12%, representing 43% of total revenue, while R&D spending reached USD 9.9 billion. IBM generated USD 30.0 billion in software revenue, including USD 26.5 billion from subscriptions and licences, and spent USD 8.3 billion on R&D; Red Hat-related hybrid-cloud revenue rose 12.9%.
Salesforce recorded USD 39.4 billion in FY2026 subscription and support revenue, equal to 95% of total revenue, with USD 6.0 billion in R&D spending. SAP generated EUR 21.0 billion in 2025 cloud revenue, up 23%, including EUR 18.1 billion from Cloud ERP Suite.
Alibaba Cloud reported RMB 118.0 billion (USD 16.3 billion) in FY2025 revenue, up 11%, with AI-product revenue achieving triple-digit growth for 7 consecutive quarters. Capital expenditure increased from RMB 86.0 billion in FY2025 to RMB 126.1 billion in FY2026. Tencent reported RMB 73.1 billion in FY2025 operating capital expenditure, up 15%, while R&D increased 21%.
Top Key Players in the Market
- Amazon Web Services, Inc.
- Microsoft Corporation
- Google LLC
- IBM Corporation
- Oracle Corporation
- Alibaba Cloud
- Salesforce, Inc.
- SAP SE
- Tencent Cloud
Recent Developments
- In 2026, Microsoft launched its India South Central cloud region in Hyderabad, bringing its total number of operating cloud regions in India to 4. The development is backed by Microsoft’s combined USD 20.5 billion cloud and AI investment commitment, including USD 3 billion announced in 2025 and another USD 17.5 billion planned for 2026–2029.
- In 2026, Google completed its acquisition of cloud-security company Wiz, following the definitive USD 32 billion all-cash agreement announced in March 2025. Wiz became part of Google Cloud while continuing to support customers across major cloud environments.
Report Scope
| Report Features | Description |
|---|---|
| Market Value (2025) | USD 806.3 Billion |
| Forecast Revenue (2035) | USD 3713.4 Billion |
| CAGR (2026-2035) | 16.5% |
| Base Year for Estimation | 2025 |
| Historic Period | 2020-2024 |
| Forecast Period | 2026-2035 |
| Report Coverage | Revenue Forecast, Market Dynamics, Competitive Landscape, Recent Developments |
| Segments Covered | By Service Model (SaaS, IaaS, PaaS); By Organization Size (Small and Medium-Sized Enterprises, Large Enterprises); By Industry Vertical (BFSI, IT and Telecommunications, Manufacturing, Healthcare, Retail, Government, Media and Entertainment, Other) |
| Regional Analysis | North America – US, Canada; Europe – Germany, France, The UK, Spain, Italy, Rest of Europe; Asia Pacific – China, Japan, South Korea, India, Australia, Singapore, Rest of APAC; Latin America – Brazil, Mexico, Rest of Latin America; Middle East & Africa – GCC, South Africa, Rest of MEA |
| Competitive Landscape | Amazon Web Services, Inc., Microsoft Corporation, Google LLC, IBM Corporation, Oracle Corporation, Alibaba Cloud, Salesforce, Inc., SAP SE, Tencent Cloud |
| Customization Scope | Customization for segments, region/country-level will be provided. Moreover, additional customization can be done based on the requirements. |
| Purchase Options | We have three licenses to opt for: Single User License, Multi-User License (Up to 5 Users), Corporate Use License (Unlimited Users and Printable PDF) |





























