


Report Overview
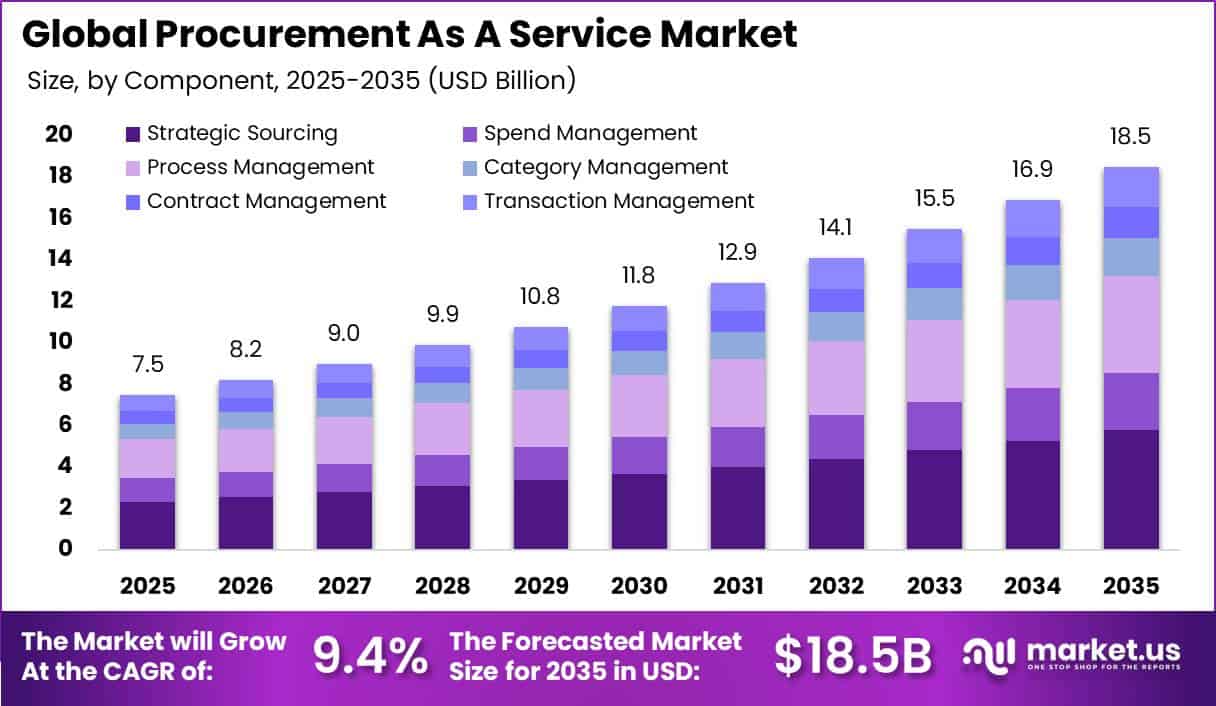
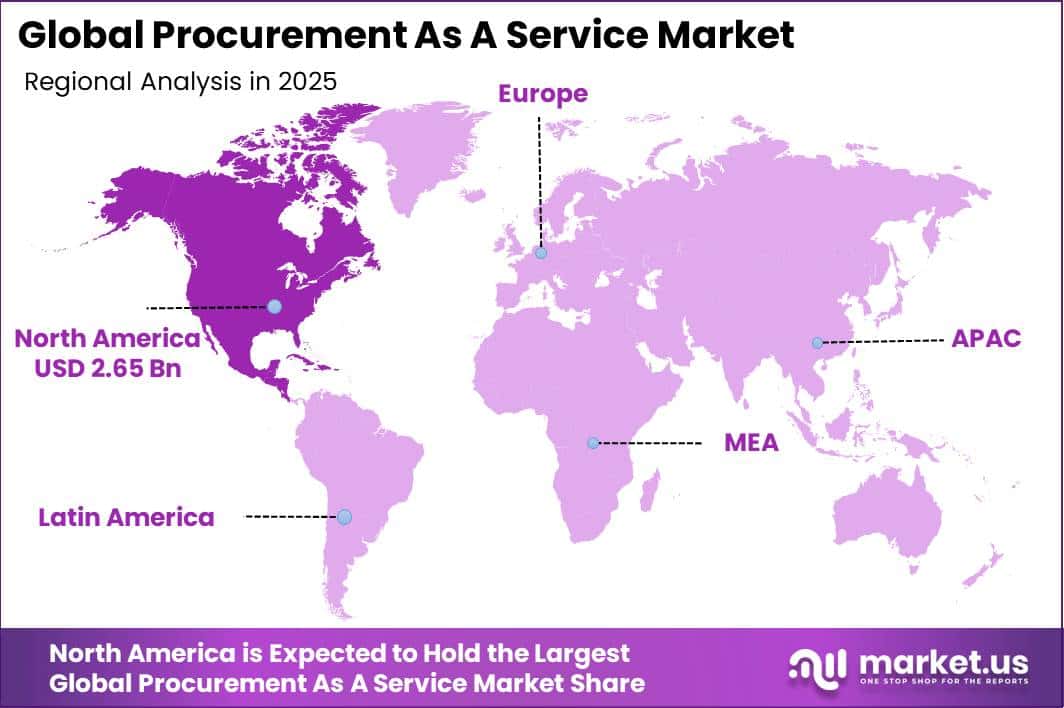
In 2025, the Global Procurement As A Service Market was valued at USD 7.5 billion. The market is projected to grow at a CAGR of 9.4% during 2026–2035, reaching approximately USD 18.5 billion by 2035. North America dominated the global market in 2025, accounting for more than 35.1% of the total market share and generating approximately USD 2.6 billion in revenue.
Market growth is supported by steady global economic activity and rising international trade. Global GDP expanded by 2.7% in 2025 and is expected to grow by 2.6% in 2026, showing continued business activity despite trade uncertainties. At the same time, global trade in goods and commercial services increased by 8% in 2025 to USD 34.8 trillion, compared with 4% growth in the previous year.
Manufacturing expansion is also strengthening demand for procurement services as companies require larger volumes of raw materials, components, equipment, and business services. China recorded economic growth of 4.9% in 2025, while India expanded by 7% in 2025, supporting greater sourcing and supplier-management activity across major manufacturing markets.
In the United States, real GDP increased by 2.1% in 2025, supported by consumer spending and business investment. Meanwhile, the euro area grew by 1.4% in 2025, while Japan expanded by 1.3%, encouraging companies in slower-growth economies to outsource procurement functions to reduce costs, improve supplier efficiency, and strengthen purchasing performance.
Key Takeaway
- The Procurement As A Service Market was valued at USD 7.5 billion in 2025 and is projected to reach USD 18.5 billion by 2035, growing at a CAGR of 9.4%.
- Strategic Sourcing held the largest component share at 31.3%, driven by volatile commodity and energy prices.
- Large Enterprises accounted for 68.2% of the market due to complex, global supplier networks.
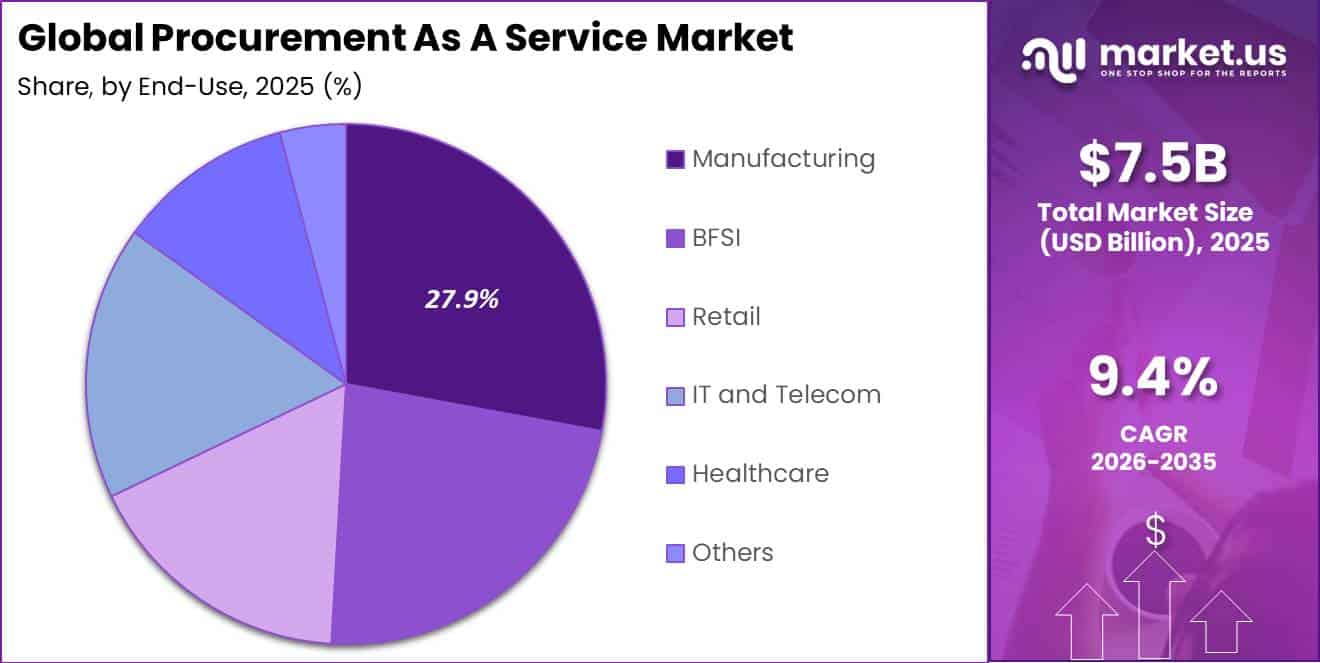
- Manufacturing led end-use segments with a 27.9% share, supported by rising global vehicle production.
- North America led the market in 2025 with a 35.1% share and approximately USD 2.6 billion in revenue.
Market Statistics and Data Insights
- World trade in goods and commercial services reached USD 34.8 trillion in 2025, increasing 8%, compared with 4% growth in the previous year. Services accounted for a record 27.5% of global trade. This increases the volume of cross-border purchasing and supplier-management activity.
- WTO members and observers introduced 644 goods-trade measures between mid-October 2024 and mid-May 2025. These included 296 trade-remedy measures, 141 other trade-related actions, and 207 trade-facilitating measures, increasing sourcing and compliance complexity.
- By May 2025, shipping tonnage through the Suez Canal remained approximately 70% below 2023 levels. Meanwhile, the Strait of Hormuz handles around 11% of global trade and roughly one-third of seaborne oil trade, highlighting the need for supplier diversification and logistics-risk management.
- Longer shipping routes caused global maritime ton-miles to increase by nearly 6% in 2024, almost 3 times faster than the increase in trade volumes. This raises freight, inventory, sourcing, and supplier-management complexity.
- The latest World Bank outlook forecasts global growth at 2.5% in 2026, down from 2.9% in 2025, while global inflation is projected at 4.0%, up from 3.3% in 2025. This supports stronger corporate focus on procurement savings and cost control.
- Deloitte’s 2025 survey covered more than 250 CPOs across 40 countries. Leading “Digital Master” procurement organizations allocate as much as 24% of their procurement budgets to technology and expect this to increase to 26%.
- Major barriers to procurement value delivery included siloed operations at 57%, competing priorities at 46%, execution capability gaps at 40%, and talent shortages at 34%. These gaps create an opening for external managed-procurement capabilities.
- Procurement organizations identified maintaining alternative sources (74%), improving supply-chain visibility (64%), and increasing supplier information sharing (61%) as their most effective risk-management strategies.
- In a U.S. and Canada procurement study, 90% of procurement leaders had considered or were already using AI agents, while nearly 40% of CPOs were looking to create enterprise value beyond traditional cost savings.
- Procurement leaders ranked AI adoption (66%) and improving speed-to-value and ROI (55%) as their top priorities. However, 88% cited integration problems, and 75% cited data-quality problems as barriers to AI confidence.
- Around 29% of procurement decision-makers identified AI as a major influence on procurement during the next 2 years, showing that buyers are moving toward AI-supported purchasing workflows.
By Component
Strategic Sourcing held a dominant position in the Procurement as a Service Market, accounting for a 31.3% share, as businesses increasingly depend on specialized sourcing support to manage changing input costs and supplier risks. According to the World Bank’s October 2025 Commodity Markets Outlook, the metals and minerals price index reached 109.8 in 2025, which was 13.6 points higher than earlier forecasts.
At the same time, oil traded near USD 68 per barrel, highlighting continued volatility in energy and raw material costs. These price movements make supplier negotiations, contract reviews, and cost planning more difficult for procurement teams. Strategic sourcing providers help companies compare suppliers, negotiate better terms, improve purchasing decisions, and reduce exposure to sudden price changes.
Demand is also supported by the large scale of government purchasing. OECD data shows that public procurement represented 12.7% of GDP across member countries in 2023 and 14.8% of GDP across OECD-EU countries. The high value of these contracts increases the need for competitive bidding, supplier assessment, and structured sourcing strategies, supporting the strong 31.3% market share of Strategic Sourcing.
By Organization Size
Large Enterprises held a dominant position in the Procurement as a Service Market, accounting for a 68.2% share, mainly due to their large purchasing volumes, complex supplier networks, and global operations. According to Fortune’s 2026 Global 500 rankings, the world’s 500 largest companies generated approximately USD 43.1 trillion in combined revenue in 2025, representing growth of 3.2%.
These companies accounted for more than one-third of global GDP and employed around 70.2 million people worldwide. Managing procurement across such large organizations requires standardized sourcing processes, advanced digital tools, supplier monitoring, contract management, and strong cost-control systems.
By End-Use
Manufacturing held a dominant position in the Procurement as a Service Market, accounting for a 27.9% share, supported by the sector’s high purchasing volume, large supplier base, and need for timely delivery of raw materials and components. According to UNIDO’s Q3 2025 report, global manufacturing output increased by 0.70% quarter-on-quarter, despite ongoing tariff and trade pressures.
This growth continues to raise demand for structured sourcing and supplier management. The automotive industry highlights the scale of procurement activity within manufacturing. OICA data shows global vehicle production increased from 92.7 million units in 2024 to 96.4 million units in 2025, representing growth of 3.9%.
China alone produced around 34.5 million vehicles in 2025, up 10.4%. Each vehicle requires a wide range of sourced inputs, including steel, semiconductors, electronics, plastics, and other components. As production volumes rise, manufacturers must manage more suppliers, contracts, purchase orders, and delivery schedules.
Key Market Segments
By Component
- Strategic Sourcing
- Spend Management
- Process Management
- Category Management
- Contract Management
- Transaction Management
By Organization Size
- Large Enterprise
- SMEs
By End-Use
- Manufacturing
- BFSI
- Retail
- IT and Telecom
- Healthcare
- Others
Geopolitical Impact Analysis
Geopolitical fragmentation is creating strong demand for Procurement as a Service as companies face higher tariffs, changing trade rules, and more complex supplier networks. According to the WTO’s World Tariff Profiles 2025, the global average applied Most Favored Nation tariff rate increased from 5.7% to 6.3%, while the U.S. simple average applied tariff rose from 3.4% in 2023 to 11.2% in 2025.
WTO data also shows that around USD 2,640 billion of global imports, equal to 11.1% of total trade, were affected by tariffs and trade measures between mid-2024 and mid-2025, more than four times the coverage recorded in the previous year. These changes increase landed costs and make sourcing decisions more difficult, especially for semiconductors, industrial components, and clean-energy inputs.
Shipping disruptions are adding further pressure. UNCTAD reported that Suez Canal transit tonnage remained around 70% below 2023 levels in 2025, as Red Sea security risks forced vessels to use longer routes around the Cape of Good Hope. The Strait of Hormuz also remains strategically important, carrying about 11% of global maritime trade and more than one-third of seaborne oil exports.
Energy prices have also remained volatile, with Brent crude declining from about USD 79 per barrel in January 2025 to USD 63 per barrel in December 2025. The IEA further projected a global oil surplus of around 4.09 million barrels per day in 2026. These shifts are encouraging companies to use procurement service providers for supplier diversification, contract renegotiation, cost monitoring, and faster sourcing decisions.
Regional Analysis
North America held a dominant position in the Procurement as a Service Market, accounting for a 35.1% share and generating approximately USD 2.6 billion in revenue in 2025. The region benefits from advanced digital infrastructure, strong adoption of outsourced business services, and a large base of multinational companies. U.S. real GDP expanded by 2.1% in 2025, supported by consumer spending and business investment.
The ISM Services PMI stood at 50.8% in June 2025, marking the 61st consecutive month of expansion. At the same time, the services sector price index reached 69.9 in July 2025, close to a three-year high. Rising operating costs are encouraging large U.S. and Canadian companies to adopt digital procurement platforms for supplier management, spending visibility, contract optimization, and cost control.
Asia Pacific is emerging as the fastest-growing region, supported by strong manufacturing activity, foreign investment, and expanding supply chains. According to UNCTAD, developing Asia attracted around USD 644 billion in FDI in 2025, representing nearly 40% of global inflows.
South-East Asia’s FDI increased from USD 222 billion to USD 244 billion, while the ASEAN Manufacturing PMI reached 52.7 at the end of 2025, recording its sixth consecutive month of expansion and strongest quarter in four years. Manufacturers also increased raw-material purchasing for five consecutive months. India’s FDI inflows rose by 44% in 2025, further increasing sourcing and supplier-management requirements across the region.
Key Regions and Countries
North America
- US
- Canada
Europe
- Germany
- France
- The UK
- Spain
- Italy
- Rest of Europe
Asia Pacific
- China
- Japan
- South Korea
- India
- Australia
- Rest of APAC
Latin America
- Brazil
- Mexico
- Rest of Latin America
Middle East & Africa
- GCC
- South Africa
- Rest of MEA
Market Dynamics
Drivers
| Driver | (~) % CAGR | Geographic Relevance | Impact Timeline |
|---|---|---|---|
| Procurement spend digitization | +2.0% | North America and Europe | Short term (2 years or less) |
| Trade-policy sourcing complexity | +1.6% | Global | Short term (2 years or less) |
| AI-led process automation | +1.4% | Global enterprise markets | Medium term (2 to 4 years) |
| Supplier-risk management demand | +1.1% | Europe and Asia Pacific | Short term (2 years or less) |
| Public-sector sourcing modernization | +0.9% | OECD economies | Medium term (2 to 4 years) |
Procurement spend digitization
Procurement spend digitization is a major growth driver as companies move source-to-pay activities from internal teams to technology-enabled managed services. OECD data shows public procurement represented 12.7% of GDP in 2023, up from 12.2% in 2019, and accounted for 29.9% of total government spending, highlighting the scale of purchasing activity requiring better sourcing, compliance, and supplier control.
UNCTAD’s 2025 assessment also highlights the role of AI in improving supply-chain planning and supplier selection. WTO monitoring recorded 644 goods-trade measures between mid-2024 and mid-2025, increasing the need for updated sourcing data and flexible procurement support. Together, these factors could contribute an estimated +2.0% upside to the 9.4% baseline CAGR by increasing adoption of recurring managed procurement services.
Restraints
| Restraint | (~) % CAGR | Geographic Relevance | Impact Timeline |
|---|---|---|---|
| Enterprise budget tightening | -1.5% | Europe and North America | Short term (2 years or less) |
| Data-residency restrictions | -1.2% | Europe, China, and India | Medium term (2 to 4 years) |
| Long procurement approval cycles | -1.0% | Public sector and regulated industries | Medium term (2 to 4 years) |
| Integration investment burden | -0.9% | Global | Short term (2 years or less) |
| Fragmented legacy systems | -0.8% | Asia Pacific and Latin America | Long term (4 years or more) |
Enterprise budget tightening
Enterprise budget tightening is a key short-term restraint because procurement outsourcing requires upfront spending on transition, system integration, legal review, and change management before savings are realized. The World Bank projected global economic growth of only 2.6% in 2026, while tighter financing conditions and policy uncertainty continue to limit discretionary transformation budgets.
Trade pressures are also increasing working-capital needs. WTO monitoring showed that import-restrictive measures covered 19.4% of global imports by May 2025, compared with 12.5% at the end of 2024. These pressures can delay Procurement as a Service projects, extend sales cycles, and reduce pricing flexibility, creating an estimated -1.5% drag against the 9.4% baseline CAGR.
Challenges
| Challenge | (~) % CAGR | Geographic Relevance | Mitigation Horizon |
|---|---|---|---|
| Supplier data quality | -1.3% | Global | Medium term (2 to 4 years) |
| Cross-border compliance variation | -1.1% | Global | Long term (4 years or more) |
| Procurement talent shortage | -0.9% | North America and Europe | Medium term (2 to 4 years) |
| Cybersecurity exposure | -0.8% | Global enterprise markets | Short term (2 years or less) |
| Supplier onboarding delays | -0.7% | Asia Pacific and emerging markets | Medium term (2 to 4 years) |
Supplier data quality
Supplier data quality remains a major operational challenge because providers must clean and standardize supplier records, product categories, contract terms, tax IDs, and payment information before automation can work effectively. UNCTAD’s 2025 technology assessment highlights data access and digital capability as key requirements for AI-based supply-chain management.
WTO tariff and import data now cover more than 150 economies, showing the scale of information required for cross-border sourcing. The challenge is even greater for large buyers, as public procurement represented 14.8% of GDP across OECD-EU countries in 2023.
Poor-quality master data can lead to incorrect supplier matching, weak spend visibility, and higher manual review needs. Until data governance, interoperability, and audit controls improve, this issue could create an estimated -1.3% friction drag on attainable market growth.
Opportunities
| Opportunity | (~) % CAGR | Geographic Relevance | Execution Window |
|---|---|---|---|
| Outcome-based procurement models | +1.8% | Global large enterprises | Medium term (2 to 4 years) |
| Mid-market managed sourcing | +1.4% | Asia Pacific and Europe | Medium term (2 to 4 years) |
| Public-procurement platforms | +1.2% | OECD and emerging economies | Long term (4 years or more) |
| Embedded supplier finance | +1.0% | Global supply chains | Medium term (2 to 4 years) |
| Carbon-aware sourcing services | +0.8% | Europe and North America | Long term (4 years or more) |
Outcome-based procurement models
Outcome-based procurement remains underused, as most contracts are still priced by headcount, transaction volume, or fixed service scope instead of measurable savings and performance. Public procurement represented 12.7% of GDP across OECD economies in 2023, while WTO tariff and import data now cover more than 150 economies, giving providers a stronger base for transparent landed-cost benchmarking and shared-savings models.
AI can also improve supply-chain decisions and support measurable gains in sourcing speed, savings, and risk control. Moving even a small share of contracts toward outcome-based pricing could improve procurement-processing costs by 10% to 20% per transaction. This opportunity could add around +1.8% upside to the 9.4% baseline CAGR, provided companies have shared data access, clear savings benchmarks, and agreed performance-measurement rules.
Key Players Analysis
The Procurement as a Service Market is largely led by Tier-1 global technology and business-process companies such as Accenture, IBM, Capgemini, TCS, Infosys, HCLTech, Wipro, Genpact, and WNS. These companies combine strategic sourcing, procurement operations, analytics, cloud integration, automation, and supplier-risk management within large enterprise contracts.
Accenture reported FY2025 revenue of USD 69.6 billion and operating profit of USD 10.2 billion, while IBM generated USD 67.5 billion in revenue and invested USD 8.3 billion in R&D. Capgemini recorded EUR 22.4 billion in revenue and EUR 2.5 billion in operating income. Accenture also spent USD 1.4 billion on acquisitions, while IBM deployed USD 8.2 billion.
Indian Tier-1 providers also maintain a strong competitive position through global delivery models and cost-efficient managed services. TCS reported FY2026 revenue of INR 2.6 trillion, operating profit of INR 668.3 billion, and capital expenditure of INR 37.7 billion. Infosys generated INR 1.8 trillion in revenue and INR 381.8 billion in operating profit.
HCLTech reported INR 1.3 trillion in revenue and INR 223.9 billion in operating profit, while Wipro recorded INR 926.2 billion in revenue and INR 149.8 billion in operating profit.
Tier-2 specialists including GEP, Corbus, Proxima, Simfoni, Pcura, Sastrify, and Vizient compete through focused procurement expertise. Genpact generated USD 5.08 billion in FY2025 revenue, USD 750.2 million in operating profit, and spent USD 80.3 million on acquisitions.
Top Key Players in the Market
- Accenture plc
- Capgemini
- Corbus LLC
- Genpact
- GEP
- HCL Technologies Ltd
- IBM Corporation
- Infosys Limited
- Proxima Group
- Tata Consultancy Services Limited
- Wipro Limited
- WNS (Holdings) Ltd
- Simfoni Limited
- Pcura Consulting Pvt Ltd
- Sastrify
- Vizient Inc.
Recent Developments
- In 2025, Capgemini completed the acquisition of WNS on October 17, 2025, following the definitive agreement. The transaction was valued at USD 3.3 billion, with Capgemini paying USD 76.5 per WNS share. The acquisition strengthens Capgemini’s position in Digital BPS and Agentic AI-powered Intelligent Operations, expanding its ability to manage complex enterprise processes and outsourced operations.
- In 2025, TCS signed a definitive agreement to acquire a 100% stake in Coastal Cloud for an all-cash consideration of USD 700 million. Coastal Cloud brings more than 400 professionals and over 3,000 multi-cloud certifications. Together with the earlier ListEngage acquisition, the transaction was expected to position TCS among the top 5 Salesforce advisory and consulting providers globally.
Report Scope
| Report Features | Description |
|---|---|
| Market Value (2025) | USD 7.5 Billion |
| Forecast Revenue (2035) | USD 18.5 Billion |
| CAGR (2026-2035) | 9.4% |
| Base Year for Estimation | 2025 |
| Historic Period | 2020-2024 |
| Forecast Period | 2026-2035 |
| Report Coverage | Revenue Forecast, Market Dynamics, Competitive Landscape, Recent Developments |
| Segments Covered | By Component – (Strategic Sourcing, Spend Management, Process Management, Category Management, Contract Management, Transaction Management), By Organization Size – (Large Enterprise, SMEs), By End-Use – (Manufacturing, BFSI, Retail, IT and Telecom, Healthcare, Others) |
| Regional Analysis | North America – US, Canada; Europe – Germany, France, The UK, Spain, Italy, Rest of Europe; Asia Pacific – China, Japan, South Korea, India, Australia, Singapore, Rest of APAC; Latin America – Brazil, Mexico, Rest of Latin America; Middle East & Africa – GCC, South Africa, Rest of MEA |
| Competitive Landscape | Accenture plc, Capgemini, Corbus LLC, Genpact, GEP, HCL Technologies Ltd, IBM Corporation, Infosys Limited, Proxima Group, Tata Consultancy Services Limited, Wipro Limited, WNS (Holdings) Ltd, Simfoni Limited, Pcura Consulting Pvt Ltd, Sastrify, Vizient Inc. |
| Customization Scope | Customization for segments and region/country-level will be provided. Moreover, additional customization can be done based on the requirements. |
| Purchase Options | We have three licenses to opt for: Single User License, Multi-User License (Up to 5 Users), Corporate Use License (Unlimited Users and Printable PDF) |





























