


Report Overview
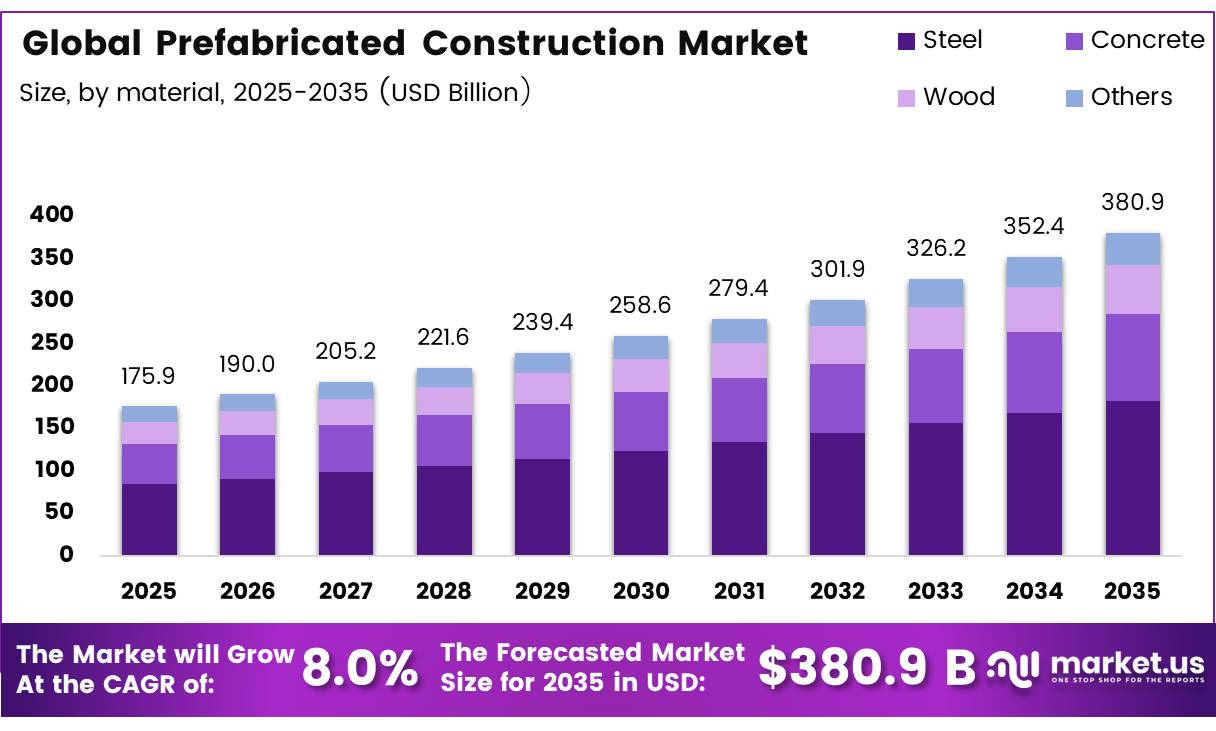
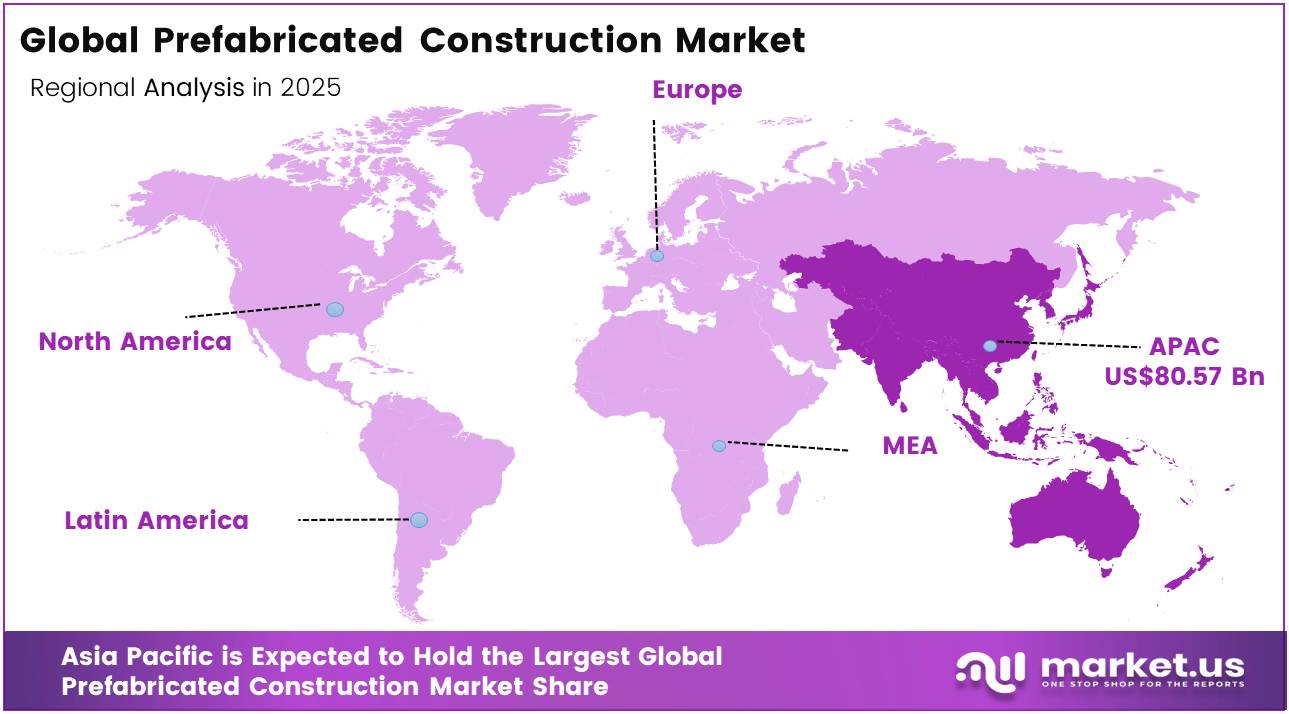
In 2025, the Global Prefabricated Construction Market was valued at USD 175.9 billion, and between 2026 and 2035, this market is estimated to register a CAGR of 8.0%, reaching about USD 380.9 billion by 2035. In 2025, Asia Pacific held a dominant market position, capturing more than a 45.80% share, holding USD 80.57 Billion revenue.
Prefabricated construction is moving from a specialist method toward a mainstream delivery model for housing, schools, healthcare facilities, hotels and industrial projects. It shifts wall panels, structural frames, service assemblies and complete volumetric rooms into controlled factories before final installation. This improves repeatability, allows manufacturing to proceed alongside foundation work and reduces dependence on weather-sensitive site activity. It is suitable for projects with standard layouts, tight schedules or limited urban work areas.
- In May 2025, U.S. construction spending was running at an annualized USD 2.244 trillion, while expenditure during the first five months reached USD 882.2 billion. However, U.S. housing starts ended December 2025 at an annualized 1.404 million units, representing a 7.3% decline from December 2024. Europe showed similar pressure.
Prefabricated construction is becoming an industrial production model for structural frames, wall panels, façades and volumetric modules. In June 2026, U.S. housing completions reached a seasonally adjusted annual rate of 1.392 million units, 3.3% above May, highlighting the housing scale that faster assembly methods can support. European Commission research indicates that offsite construction can shorten project schedules by 20% to 60% and reduce production and manufacturing waste by 10% to 15%.
The construction ecosystem provides a commercial base. Across the European Union, it includes 6.6 million companies, employs more than 27 million people and contributes 12% of gross value added. However, labour productivity per hour has declined by 8% since 2019, while only 55% of construction firms use advanced digital technologies, compared with 76% across other industrial ecosystems. These gaps strengthen demand for factory automation, standardized components, BIM and precision manufacturing.
Environmental pressures also support adoption. UNEP reports that buildings and construction consume 32% of global energy and generate 34% of global carbon emissions, while cement and steel account for 18% of emissions. Future opportunities remain strong in modular housing, hospitals, schools, mass-timber systems, renovation modules and low-carbon prefabricated façades.
Key Takeaways
- The global Prefabricated Construction market was valued at USD 175.9 billion in 2025.
- The global market is projected to grow at a CAGR of 8.0% and is estimated to reach USD 380.9 billion by 2035.
- On the basis of Construction Type, the Modular construction dominated the market, constituting 47.40% of the total market share.
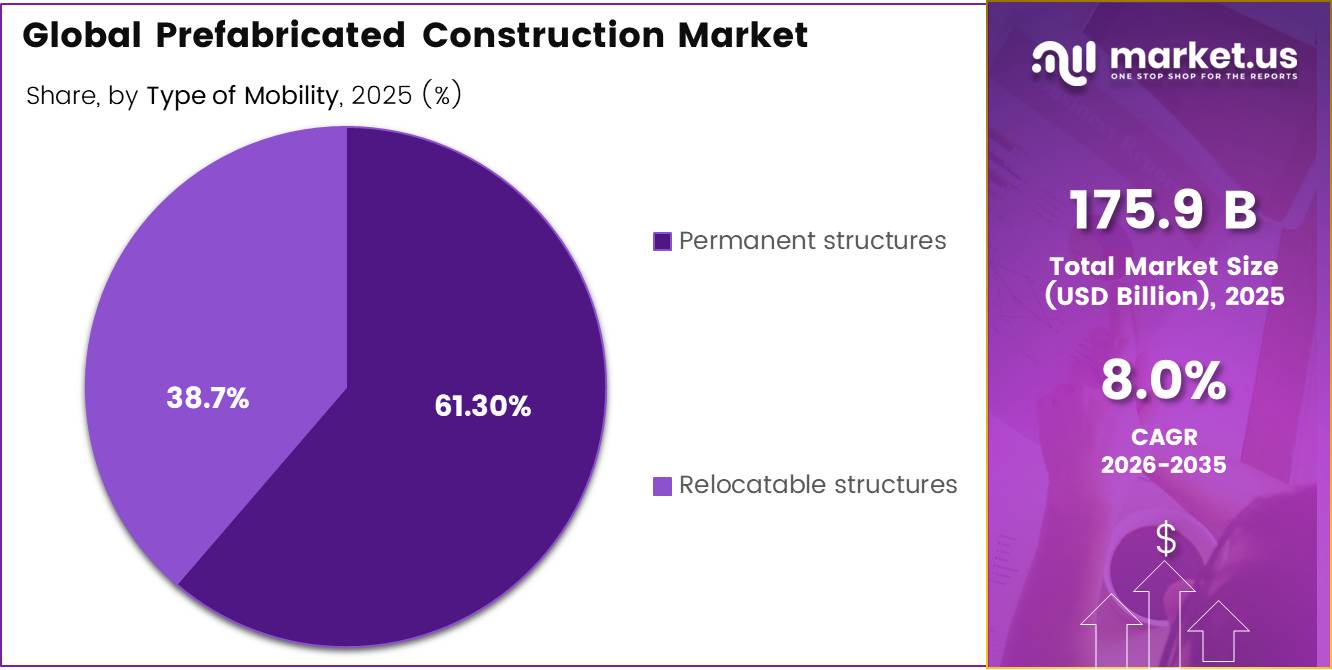
- Based on the Type of Mobility, the Permanent structures dominated the Prefabricated Construction market, with a substantial market share of around 61.3%.
- Among the Material, the Steel held a major share in the Prefabricated Construction market, 47.80% of the market share.
- Among the Application, the Residential prefabricated construction is the most considerable within the market, accounting for around 45.0% of the revenue.
- In 2025, the Asia Pacific was the most dominant region in the Prefabricated Construction market, accounting for 45.80% of the total global consumption.
Construction Type Analysis
Modular construction represents dominant Segment in the Market.
Modular construction leads the prefabricated construction market with a 47.40% share. Its advantage comes from producing complete rooms or building sections in factories, which improves quality control, limits weather disruption and reduces on-site coordination. The U.S. Census Bureau reported that housing completions reached an annualized 1.392 million units, including 413,000 units in buildings with five or more homes. This delivery pressure supports faster modular adoption. A U.S. Department of Energy program also demonstrated potential savings of USD 23 per square foot for modular construction compared with conventional site-built work in Atlanta.
Panelized construction is emerging as the growing segment because walls, floors, roofs and façades can be factory-made without transporting complete rooms. The format fits housing, renovation and energy-efficient envelope projects. European Commission research indicates that offsite methods can shorten construction schedules by 20% to 60% and reduce production and manufacturing waste by 10% to 15%, supporting wider use of timber panels, insulated wall systems and digitally designed building envelopes.
Type of Mobility Analysis
Permanent structures a significant type of Mobility.
Permanent structures dominate the prefabricated construction market with a 61.30% share, supported by sustained demand for fixed residential, institutional and commercial buildings. Factory-produced sections help developers maintain consistent specifications while reducing weather-related delays during assembly. The U.S. Census Bureau reported that housing starts reached an annualized 1.427 million units, including 895,000 single-family homes, indicating a substantial construction pipeline for durable prefabricated systems.
Relocatable structures are gaining traction where building capacity must be added quickly without committing to permanent expansion. Their reusable format suits classrooms, temporary healthcare facilities, offices, disaster accommodation and remote work sites. The U.S. National Center for Education Statistics found that 31% of public schools used at least one non-permanent portable building, demonstrating established demand for flexible space that can be installed, moved or repurposed as operational needs change.
Material Type Analysis
Steel Is the Most Widely Used Material Type.
Steel remains the leading material in prefabricated construction, accounting for a 47.80% share. Its strength-to-weight ratio, dimensional accuracy and ability to support large spans make it suitable for factory-built frames, industrial buildings and multi-storey modules. The U.S. Department of Energy states that the country produces about 80 million tonnes of steel annually, while the U.S. Geological Survey notes that iron and steel represent around 95% of all metal tonnage produced each year. This established supply base supports standardized fabrication, rapid assembly and dependable structural performance.
Wood is gaining momentum as developers adopt lighter, lower-carbon panels and mass-timber systems. The UK government’s Timber in Construction Roadmap links wider timber use with its commitment to deliver 1.5 million homes during the parliamentary term. It also reports that timber can reduce embodied emissions in a building by 20% to 60%, while engineered timber can store up to 400% more carbon than concrete in larger buildings. These benefits are creating opportunities across housing, schools and mid-rise projects.
Application Analysis
Residential Prefabricated Construction Held a Major Share of the Prefabricated Construction Market.
Residential construction leads the prefabricated construction market with a 45.00% share, driven by repeatable housing designs, controlled factory production and faster on-site assembly. In May 2026, U.S. private residential construction spending reached a seasonally adjusted annual rate of USD 930.2 billion, increasing 0.3% from the revised April level of USD 927.1 billion. This large construction pipeline creates steady demand for modular rooms, wall panels, floor systems and prefabricated structural frames.
Transportation facilities are gaining attention because prefabricated sections can shorten installation work at airports, railway stations and transit buildings while limiting disruption to operating networks. U.S. public transportation construction spending reached an annualized USD 52.18 billion in May 2026, up 3.0% from USD 50.68 billion a year earlier. This increase supports opportunities for standardized terminals, platform structures and service buildings.
Key Market Segments
By Construction Type
- Modular construction
- Panelized construction
- Volumetric construction
- Hybrid construction
- Pre-cut construction
By Type of Mobility
- Permanent structures
- Relocatable structures
By Material
- Steel
- Concrete
- Wood
- Others
By Application
- Residential
- Single-family housing
- Multifamily housing
- Commercial
- Office buildings
- Retail buildings
- Hotels and hospitality
- Institutional
- Educational facilities
- Healthcare facilities
- Government buildings
- Industrial
- Manufacturing facilities
- Warehouses
- Data centers
- Infrastructure
- Transportation facilities
- Utility buildings
- Others
Driver Analysis
India Public Housing Mission (PMAY-U 2.0) and State-Level Mass Housing Programs
India’s Union Budget 2025-26 analysis shows the combined rural and urban Pradhan Mantri Awas Yojana allocation reaching Rs 78,126 crore, a 64% year-on-year increase, while the Ministry of Housing and Urban Affairs’ total 2025-26 allocation of Rs 96,777 crore represented a 52% increase over the 2024-25 revised estimate. At the state level, Maharashtra’s Housing Policy 2025 targets construction of 3.5 million EWS/LIG houses by 2030 (an estimated Rs 70,000 crore investment) and 5 million houses over the following decade, alongside a proposed Rs 20,000 crore viability-gap-funding vehicle for affordable and inclusive housing.
These government-mandated unit-count targets, set against compressed multi-year timelines, make conventional site-built construction throughput mathematically insufficient, pushing state housing boards and PPP developers toward precast and modular delivery formats capable of higher monthly unit-completion rates per crew.
Note that the FY2026-27 Union Budget documentation shows a nominal moderation in PMAY-U 2.0 disbursement relative to initial 2025-26 estimates, reflecting execution-phase recalibration rather than a strategic pullback, since the underlying unit targets and FSI/land-bank incentives embedded in state policy remain intact.
Drivers Impact Analysis
| Driver | (~) % Impact on CAGR Forecast | Geographic Relevance | Impact Timeline |
|---|---|---|---|
| Structural housing supply deficit forcing offsite production adoption | +2.2% | North America core, India metro corridors, EU | Medium term (2-4 years) |
| Federal/state policy push toward offsite housing certification and code reform | +1.6% | US federal + state (HUD Offsite Action Plan), select EU states | Short to medium term (1-3 years) |
| Skilled labor shortage in traditional trades accelerating factory-built substitution | +1.9% | North America core, EU, APAC | Short term (≤2 years) |
| Section 232 tariff-driven input cost volatility on steel/aluminum reshaping BOM sourcing | -0.8% (drag, partly offset by localization) | North America core, tariff-exposed APAC exporters | Short term (≤2 years) |
| India public housing mission (PMAY-U 2.0) and state-level mass housing programs | +1.4% | South Asia (India), Maharashtra/Gujarat/Tamil Nadu corridors | Medium term (2-4 years) |
| Building energy-code and decarbonization mandates reshaping panel/module specification | +1.1% | EU, US state-level (NYC, California, Massachusetts), APAC spill-over | Long term (≥4 years) |
Restraint Analysis
High-rate demand drag
Higher-for-longer financing costs remain the cleanest near-term restraint because prefabricated construction still depends on project sponsors converting a nominal factory-efficiency advantage into an acceptable all-in cost of capital, and that conversion weakens when residential and commercial absorption slows; in the United States, private construction activity was essentially flat month on month in May 2026 while total construction spending was 1.5% below May 2025 and first-five-month spending was 2.7% below the prior-year period, while new single-family home sales fell 7.3% month on month and 6.8% year on year in May 2026, with 496,000 new homes for sale and a median price of $424,900, all of which implies slower project release velocity for modular developers selling into rate-sensitive housing and light commercial formats.
For prefabrication platforms that carry fixed plant overhead, even a 5% to 8% delay in monthly order intake can push factory utilization below the roughly 70% to 75% threshold where standardized volumetric production begins to outperform site-built economics, which in turn compresses EBITDA margins by an estimated 150 to 250 basis points through under-absorbed labor, engineering, and transport overhead; strategically, that suppresses near-term CapEx approvals for new lines, elongates payback periods by 12 to 24 months, and reduces the addressable share of projects willing to shift from traditional procurement into off-site models.
Restraint Impact Analysis
| Restraint | (~) % Impact on CAGR Forecast | Geographic Relevance | Impact Timeline |
|---|---|---|---|
| High-rate demand drag | -1.4% | North America core, UK, EU | Short term (≤ 2 years) |
| Material cost volatility | -1.1% | North America core, EU, APAC importers | Medium term (2-4 years) |
| Trade/tariff exposure | -0.8% | US core, LatAm-linked flows, EU metal users | Medium term (2-4 years) |
| Skilled labor mismatch | -1.0% | US, Canada, Western Europe, Australia | Medium term (2-4 years) |
| Permitting/code friction | -0.9% | EU, US states, India metros, Australia | Long term (≥ 4 years) |
| Pipeline slowdown | -1.2% | US residential, EU housing, China-linked APAC | Short term (≤ 2 years) |
Opportunity Analysis
Public housing platformization
This is an opportunity rather than a baseline driver because most current prefabricated activity still monetizes one-off project delivery, whereas the upside lies in converting recurring public housing demand into platformized procurement with repeatable unit libraries, pre-approved designs, and framework contracts that compress bid-to-install cycles by 25% to 40% and raise factory utilization from a typical subscale 50% to 65% range toward 75% to 85%; the addressable upside is reinforced by government housing shortages and industrial-policy moves, including Canada’s 2024 consultation on an industrial strategy for homebuilding, the Netherlands’ stated intention to leverage modular construction, and Homes England’s long-horizon MMC evidence program across about 1,800 homes, all of which reduce adoption risk but do not yet fully capture procurement standardization economics.
For suppliers able to secure multi-year municipal or state-backed pipelines, the commercial impact can exceed baseline market growth because standardized public-housing platforms can cut customer acquisition cost by roughly 15% to 25%, reduce engineering hours per project by 20% to 30%, and expand contribution margins by 300 to 500 basis points through repeat design amortization, while tapping even 1% to 2% of the U.S. residential construction spending base of $930.2 billion annualized implies a very large monetizable wedge for offsite systems above current penetration levels.
Opportunity Impact Analysis
| Opportunity | (~) % Potential CAGR Upside | Geographic Relevance | Execution Window |
|---|---|---|---|
| Public housing platformization | +2.4% | North America core, UK, EU | Short term (≤ 2 years) |
| Retrofit prefab envelopes | +1.9% | EU core, UK, North America | Medium term (2-4 years) |
| Cross-border modular standard kits | +1.6% | EU, Gulf-linked export markets | Medium term (2-4 years) |
| Modular data center shells | +2.1% | North America, Nordics, APAC developed | Short term (≤ 2 years) |
| Factory roll-up + regional hubs | +2.7% | India, Southeast Asia, North America | Medium term (2-4 years) |
| Disaster and defense rapid-build fleets | +1.4% | U.S., Canada, Australia, Japan | Long term (≥ 4 years) |
Challenges Analysis
Skilled prefab labor gap
Persistent shortages of skilled construction and manufacturing labor are structurally constraining the rate at which prefabricated capacity can be brought online, with the U.S. construction sector alone needing an estimated 349,000 net new workers in 2026 to meet demand across all project types and roughly 3,450 jobs required per additional USD 1 billion of construction spending, translating into a sustained 4–6 percent gap between required and available headcount in offsite factories and onsite assembly crews.
Given that prefabricated projects rely on a higher share of precision fabrication, digital modeling, and mechanized installation than conventional builds, a shortage of supervisory trades, welders, crane operators, and CAD/BIM technicians increases project cycle times by 10–18 percent and drives overtime premiums that raise labor cost per module by an estimated 8–12 percent versus a fully staffed baseline, yielding an implied drag of around 1.2 percentage points on achievable market CAGR as projects are phased, delayed, or downsized rather than cancelled outright.
The strategic response requires long-horizon workforce investments such as multi-year apprenticeship pipelines, reskilling programs in collaboration with technical institutes, and targeted migration and mobility schemes; for example, with construction unemployment at roughly mid-single digits and wage inflation running ahead of broader CPI in many economies, firms must assume a 5–7 year horizon to structurally close skills gaps and should therefore reconfigure operating models around higher factory automation, cross-training to reduce skill bottleneck variance, and modular system designs that reduce onsite skilled labor intensity by 20–30 percent per unit while maintaining quality and safety compliance.
Challenges Impact Analysis
| Challenge | (~) % CAGR Friction Drag | Geographic Relevance | Mitigation Horizon |
|---|---|---|---|
| Skilled prefab labor gap | -1.2% | North America, EU, GCC, East Asia | Long term (≥ 4 years) |
| Volatile input cost stack | -0.9% | EU, UK, North America, MENA | Medium term (2-4 years) |
| Cross-border logistics risk | -0.8% | APAC corridors, EU trade lanes, US imports | Medium term (2-4 years) |
| Fragmented codes and permitting | -1.0% | EU regulatory hubs, US states, Asia metros | Long term (≥ 4 years) |
| Limited digitalization & standardization | -0.7% | Global tier-2/3 markets | Long term (≥ 4 years) |
| Financing and pipeline uncertainty | -0.6% | Emerging markets, affordable housing programs | Short term (≤ 2 years) |
Geopolitical Impact Analysis
Tariff Escalation and Carbon Border Rules Reshaping Prefabricated Construction Supply Chains
The prefabricated construction industry faces greater trade exposure because modular frames, panels and façades rely heavily on steel and aluminium. The United States doubled Section 232 tariffs from 25% to 50% in June 2025. By April 2026, domestic capacity utilization had risen from 72.3% to 77.2% for steel and from 39.0% to 50.4% for aluminium. The United Kingdom also cut tariff-free steel quotas by 51% from July 2026 and imposed a 50% duty above quota.
Carbon regulation is adding further pressure. The EU’s CBAM became operational in January 2026 with a 50-tonne annual threshold. During its first six reporting days, covered imports reached 1,655,613 tonnes, with iron and steel representing 98%. UK construction-material prices rose 3.2% year over year in April 2026, while fabricated structural steel increased 8.5%.
Qualitatively, these changes are pushing prefabricators toward regional suppliers, low-carbon metals, timber hybrids and contract price-adjustment clauses. Local sourcing can improve supply security and delivery visibility, although smaller manufacturers may face heavier compliance, certification and procurement costs
Regional Analysis
Asia Pacific Held the Largest Share of the Global Prefabricated Construction Market.
Asia-Pacific leads the prefabricated construction market with a 45.80% share, supported by large housing programs, extensive construction activity and established manufacturing capacity for steel, concrete and engineered building components. China’s National Bureau of Statistics reported that construction enterprises generated CNY 8,642.5 billion in value added during 2025. The government also started or made available 1.21 million units of subsidized and public rental housing, creating a sizeable pipeline for standardized modules, panels and factory-built structural systems.
Middle East & Africa is gaining momentum as governments expand housing supply and accelerate urban development. Saudi Arabia’s official Housing Program reported that homeownership exceeded 66.24% by the end of 2025, moving closer to the 70% target for 2030. The Ministry of Municipalities and Housing also launched nearly 26,000 off-plan homes during the first half of 2025, supporting demand for faster, repeatable and cost-controlled prefabricated building methods
Key Regions and Countries Covered
- North America
- The US
- Canada
- Europe
- Germany
- France
- The UK
- Spain
- Italy
- Russia & CIS
- Rest of Europe
- APAC
- China
- Japan
- South Korea
- India
- ASEAN
- Rest of APAC
- Latin America
- Brazil
- Mexico
- Rest of Latin America
- Middle East & Africa
- GCC
- South Africa
- Rest of MEA
Key Players Analysis
Prefabricated construction companies focus on strengthening design flexibility, production efficiency, and supply chain coordination to maintain competitiveness. A key priority is continuous product innovation, including the development of lightweight steel frames, engineered timber modules, insulated concrete panels, and energy-efficient building envelopes that improve structural performance, durability, and thermal efficiency. Companies also invest in automated factories, digital fabrication, and building information modelling to improve dimensional accuracy and shorten project timelines.
Strategic manufacturing expansion near major urban and housing development zones enables producers to respond more quickly to demand from residential, commercial, healthcare, education, and infrastructure projects. In addition, manufacturers emphasize standardized designs, modular certification, quality control, and regulatory compliance to ensure consistent performance at scale, while forming long-term agreements with developers and public agencies to secure project pipelines and strengthen their position in high-value construction segments.
The Major Players In The Industry
- Skanska AB
- Bouygues Construction
- Lendlease Group
- Daiwa House Industry Co., Ltd.
- Sekisui Chemical Co., Ltd.
- Clayton Homes, Inc.
- Laing O’Rourke
- ATCO Ltd.
- Cavco Industries, Inc.
- Skyline Champion Corporation
- WillScot Holdings Corporation
- Modulaire Group
- Red Sea International Company
- Larsen & Toubro Limited
- Tata Steel Nest-In
Key Development
- In July 2025, Cavco Industries, Inc. agreed to acquire American Homestar for a base cash price of USD 190 million, strengthening its manufactured and modular housing presence across Texas and South-Central markets.
- In October 2025, ATCO Ltd. secured a CAD 179 million contract to manufacture and install modular housing for more than 1,000 workers at an Idaho mine, with module production beginning in the fourth quarter and onsite installation planned for 2026.
Report Scope
| Report Features | Description |
|---|---|
| Market Value (2025) | USD 175.9 Bn |
| Forecast Revenue (2035) | USD 380.9 Bn |
| CAGR (2026-2035) | 8.0% |
| Base Year for Estimation | 2025 |
| Historic Period | 2020-2024 |
| Forecast Period | 2026-2035 |
| Report Coverage | Revenue Forecast, Market Dynamics, Competitive Landscape, Recent Developments |
| Segments Covered | By Construction Type (Modular Construction, Panelized Construction, Volumetric Construction, Hybrid Construction and Pre-cut Construction), By Type of Mobility (Permanent structures and Relocatable structures), By Material (Steel, Concrete, Wood and Others), By Application (Residential, Commercial, Institutional, Industrial, Infrastructure, Transportation facilities, Utility buildings and Others) |
| Regional Analysis | North America – The US & Canada; Europe – Germany, France, The UK, Spain, Italy, Russia & CIS, Rest of Europe; APAC– China, Japan, South Korea, India, ASEAN & Rest of APAC; Latin America– Brazil, Mexico & Rest of Latin America; Middle East & Africa– GCC, South Africa, & Rest of MEA |
| Competitive Landscape | Skanska AB, Bouygues Construction, Lendlease Group, Daiwa House Industry Co., Ltd., Sekisui Chemical Co., Ltd., Clayton Homes, Inc., Laing O’Rourke, ATCO Ltd., Cavco Industries, Inc., Skyline Champion Corporation, WillScot Holdings Corporation, Modulaire Group, Red Sea International Company, Larsen & Toubro Limited, Tata Steel Nest-In. |
| Customization Scope | Customization for segments, region/country-level will be provided. Moreover, additional customization can be done based on the requirements. |
| Purchase Options | We have three licenses to opt for: Single User License, Multi-User License (Up to 5 Users), Corporate Use License (Unlimited Users and Printable PDF) |





































