


Report Overview
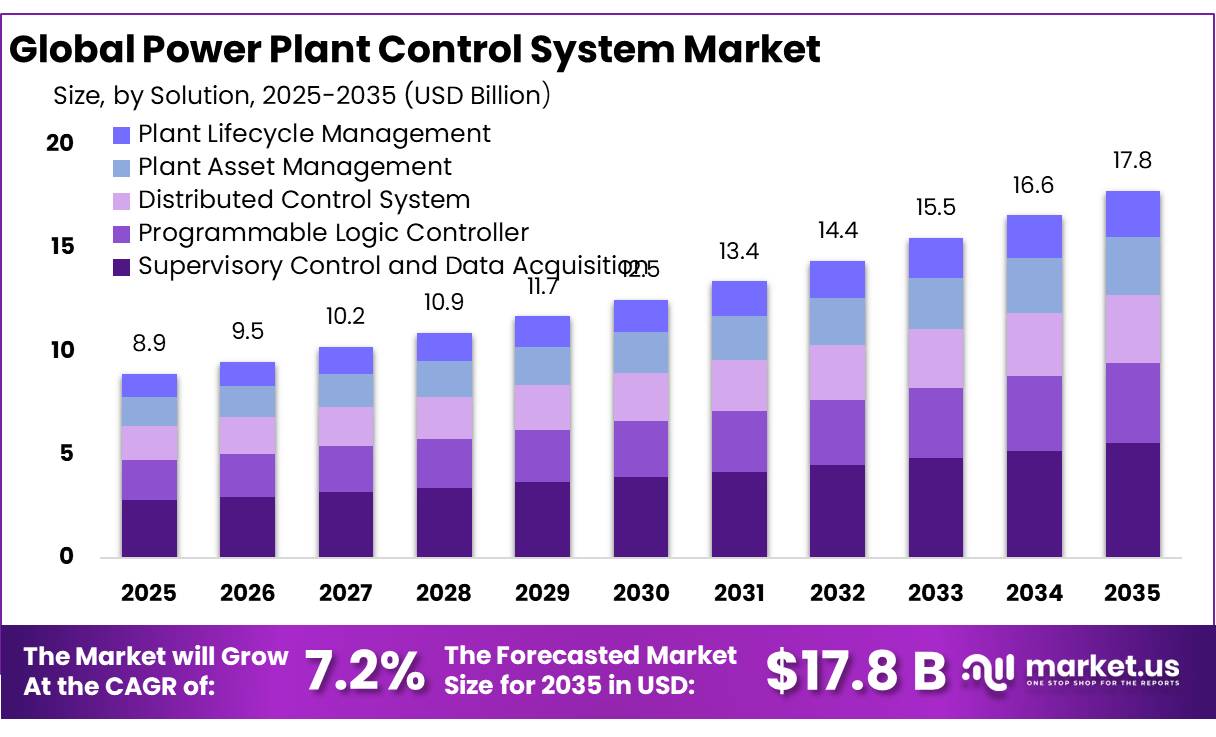
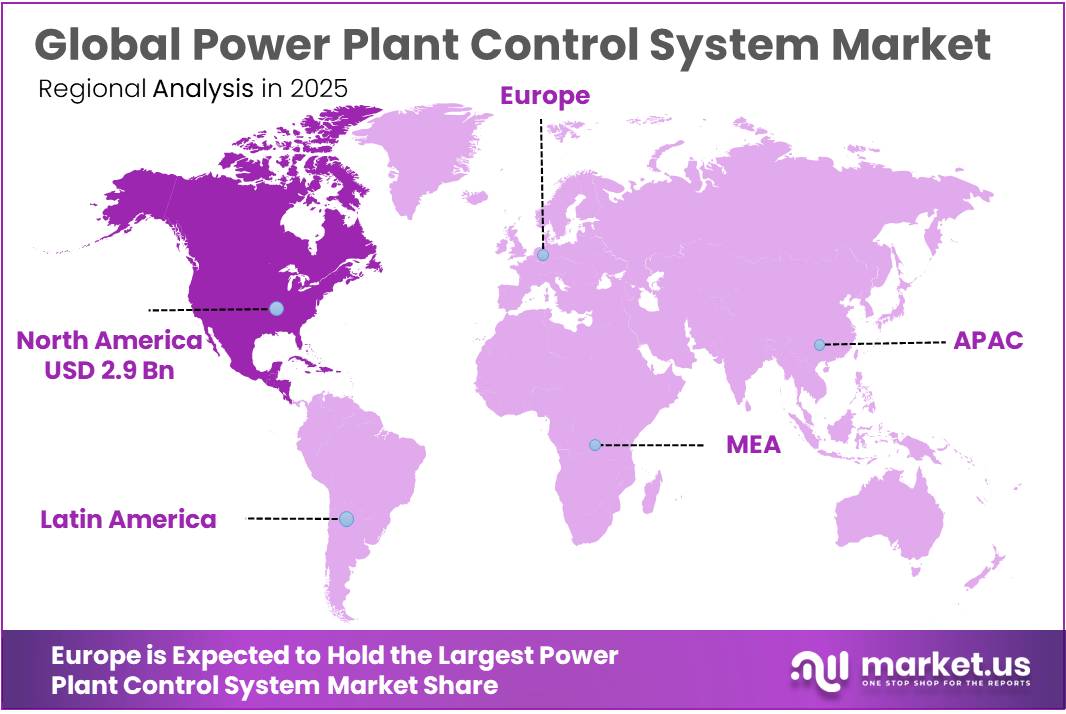
The Global Power Plant Control System Market size is expected to be worth around USD 17.8 Billion by 2035, from USD 8.9 Billion in 2025, growing at a CAGR of 7.2% during the forecast period from 2026 to 2035. In 2025, Europe held a dominant market position, capturing more than a 33.11% share, holding USD 2.9 Billion revenue.
Power Plant Control Systems are essential technologies used to monitor, regulate, and coordinate the operations of electricity generation facilities. They combine hardware, software, sensors, controllers, and communication networks to manage equipment such as boilers, turbines, generators, fuel systems, cooling units, and emissions-control equipment. Distributed Control Systems (DCS), Programmable Logic Controllers (PLCs), Supervisory Control and Data Acquisition (SCADA), and turbine control platforms help operators maintain stable generation, improve operating efficiency, and reduce equipment-related risks.
- According to the International Energy Agency (IEA), global electricity demand increased by 4.3% in 2024, compared with 2.5% in 2023. The increase was supported by industrial activity, electrification, higher cooling requirements, and expanding data centre operations. This growth is encouraging power producers to improve plant availability and operational flexibility.
The expansion and modernization of the power generation industry are important factors driving demand for advanced control systems. The US Energy Information Administration reported that the United States generated approximately 4,309 billion kilowatt-hours of electricity in 2024. Managing generation at this scale requires dependable monitoring and control infrastructure to coordinate equipment performance and respond to changes in electricity demand.
Digitalization is creating additional opportunities through artificial intelligence, industrial internet of things technologies, predictive maintenance, and digital twins. These solutions help operators analyse equipment data, identify abnormal operating conditions, and plan maintenance before major failures occur.
Cybersecurity is another major consideration as power plants connect operational technology networks with enterprise systems and remote monitoring platforms. NIST’s guidance on industrial control systems covers DCS, SCADA, and PLC security, highlighting the importance of protecting these technologies while maintaining reliability and safety.
Key Takeaways
- Power Plant Control System Market size is expected to be worth around USD 17.8 Billion by 2035, from USD 8.9 Billion in 2025, growing at a CAGR of 7.2%.
- Supervisory Control and Data Acquisition (SCADA) held a dominant market position, capturing more than a 31.23% share.
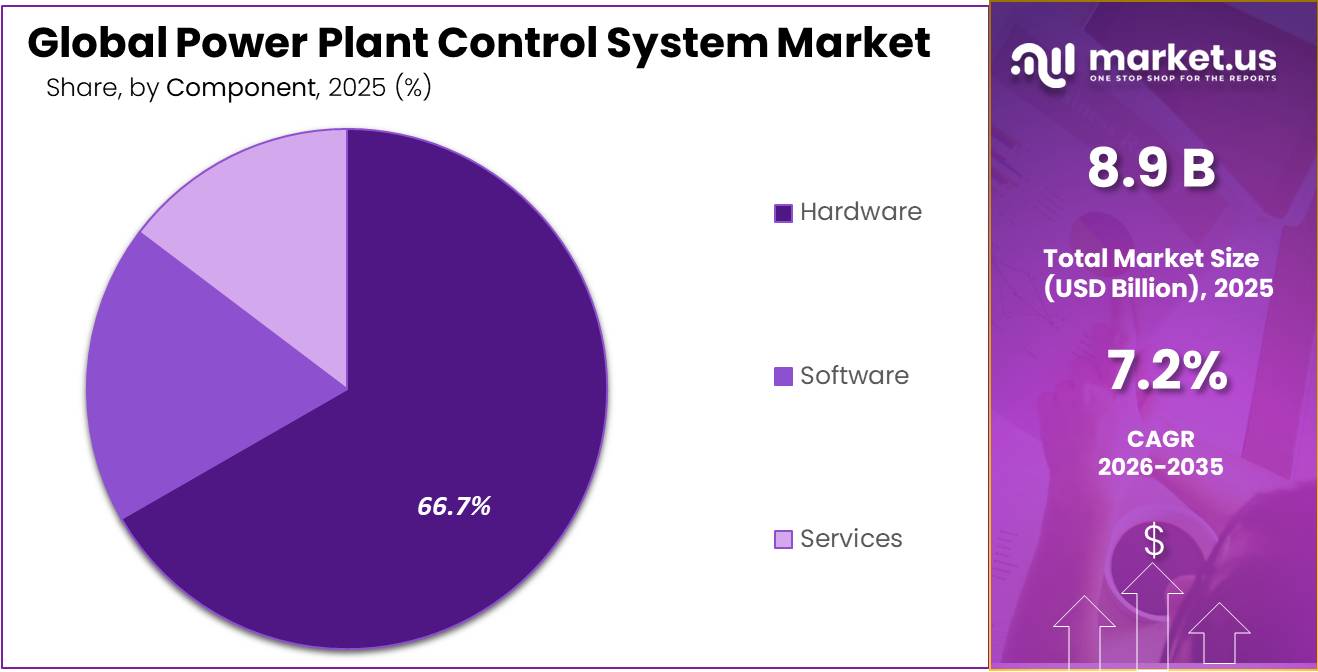
- Hardware held a dominant market position, capturing more than a 66.78% share of the Power Plant Control System Market.
- Thermal held a dominant market position, capturing more than a 48.55% share of the Power Plant Control System Market.
- Boiler & Auxiliaries Control held a dominant market position, capturing more than a 39.5% share.
- Europe held a dominant position in the Power Plant Control System Market, accounting for 33.11% share and a market value of USD 2.9 billion.
By Solution Analysis
Supervisory Control and Data Acquisition (SCADA) – Leading Solution Segment
In 2025, Supervisory Control and Data Acquisition (SCADA) held a dominant market position, capturing more than a 31.23% share of the Power Plant Control System Market. SCADA systems are widely used in power plants because they allow operators to monitor equipment, collect operating data, and supervise plant activities from a central control room. They provide real-time visibility into important operating conditions, including equipment status, process measurements, and system alarms. This helps plant operators identify irregular conditions quickly and coordinate corrective action.
Programmable Logic Controller (PLC) systems play an important role in power plant automation by controlling individual machines, equipment processes, and electrical operations. They are used to manage functions such as pump operation, valve positioning, motor control, conveyor systems, and auxiliary equipment. Their fast response, reliable operation, and ability to work in demanding industrial environments make them suitable for power generation facilities. PLCs can also communicate with SCADA and Distributed Control Systems, allowing plant operators to coordinate equipment activities and monitor operating conditions from a central location.
In 2025, the US Energy Information Administration recorded 27,918 utility-scale electricity generators across all sectors, including 24,506 generators in the electric power sector. This provides an indication of the scale of the power-generation asset base requiring monitoring and control, although it does not represent the number of PLC installations. As power plants modernize equipment and automate auxiliary operations, PLC systems remain important for improving process control, operating consistency, and equipment reliability.
By Component Analysis
Hardware – Dominant Component Supported by Essential Plant Equipment
In 2025, Hardware held a dominant market position, capturing more than a 66.78% share of the Power Plant Control System Market. Hardware forms the physical foundation of plant automation, as it includes sensors, transmitters, input and output modules, control panels, communication devices, and other field equipment. These components collect operating information and transfer signals between plant machinery and control platforms. Power generation facilities depend on this equipment to monitor pressure, temperature, flow, voltage, and other operating conditions.
Controllers are essential components of Power Plant Control Systems because they process signals from field instruments and automatically regulate plant equipment according to programmed operating conditions. They help manage functions such as turbine speed, boiler temperature, pressure, generator output, pump operation, and valve movement. By maintaining consistent operating parameters, controllers support stable generation, reduce manual intervention, and help prevent equipment from operating outside safe limits.
In 2025, the US Energy Information Administration recorded 24,506 utility-scale generators in the US electric power sector, with a combined generator nameplate capacity of approximately 1,339,991.5 megawatts. Although these figures do not represent controller installations, they demonstrate the scale of generation infrastructure that depends on reliable monitoring and automated control. As power facilities upgrade their automation systems, demand for controllers with faster processing, reliable communication, and compatibility with existing plant equipment is expected to remain important.
By Plant Type Analysis
Thermal – Leading Plant Type Supported by Large-Scale Electricity Generation
In 2025, Thermal held a dominant market position, capturing more than a 48.55% share of the Power Plant Control System Market. Thermal power plants use control systems to coordinate boilers, steam turbines, generators, fuel supply, cooling equipment, and emissions-control processes. These systems help operators maintain the required temperature and pressure levels, regulate fuel combustion, and manage changes in electricity demand. Thermal facilities also require continuous monitoring because equipment performance and operating conditions directly affect plant efficiency and reliability.
In 2025, the US Energy Information Administration reported that nuclear power generated approximately 780 billion kilowatt-hours of electricity, representing around 18% of total US electricity generation. This level of generation highlights the importance of dependable control infrastructure across operating nuclear facilities. As nuclear operators invest in plant life extensions, equipment upgrades, and advanced reactor technologies, demand for modern digital instrumentation and control systems is expected to gain importance.
By Application Analysis
Boiler & Auxiliaries Control – Leading Application for Stable Plant Operations
In 2025, Boiler & Auxiliaries Control held a dominant market position, capturing more than a 39.5% share of the Power Plant Control System Market. Boiler and auxiliary control systems are important for maintaining stable and efficient power generation, particularly in thermal power plants. They regulate key operating conditions such as steam pressure, temperature, water levels, fuel supply, and combustion.
Turbine & Auxiliaries Control systems are important for managing turbine performance and supporting equipment in power generation facilities. These systems regulate turbine speed, steam pressure, temperature, vibration, and operating load while coordinating auxiliary equipment such as lubrication pumps, cooling systems, valves, and sealing systems. They help maintain stable turbine operation, protect critical machinery, and support efficient electricity generation.
In 2025, the US Energy Information Administration reported an average time-adjusted capacity of 292,281.3 megawatts for natural gas combined-cycle generators, with a capacity factor of 58.7%. Natural gas gas-turbine generators recorded an average time-adjusted capacity of 134,388.3 megawatts and a capacity factor of 13.6%. These figures demonstrate the significant operating scale of turbine-based generation in the United States and the importance of dependable monitoring and control.
Key Market Segments
By Solution
- Supervisory Control and Data Acquisition (SCADA)
- Programmable Logic Controller (PLC)
- Distributed Control System (DCS)
- Plant Asset Management (PAM)
- Plant Lifecycle Management (PLM)
By Component
- Hardware
- Controllers
- Input/Output Devices
- Workstations
- Others
- Software
- Services
By Plant Type
- Thermal
- Nuclear
- Renewables
- Solar
- Wind
- Biofuels
By Application
- Boiler & Auxiliaries Control
- Turbine & Auxiliaries Control
- Generator Excitation & Electrical Control
- Others
Driver Analysis
Gas-Generation Project Pipeline — +0.7 Percentage Points
New gas-fired projects create discrete procurement events for turbine controls, balance-of-plant automation, protection interfaces and plant-wide supervisory systems, making the committed equipment pipeline more informative than annual electricity output alone. Siemens Energy reported sales of 194 gas turbines in FY2025, approximately twice the FY2024 number, and Gas Services orders of EUR 23.0 billion, up 42.9% on a comparable basis; those segment orders include substantial non-control content and therefore cannot be used as control-market revenue.
The generation outlook is also uneven: IEA’s mid-year 2026 update forecast broadly flat global gas-fired output in 2026 because of higher gas prices, with a rebound expected in 2027, superseding any assumption of uninterrupted near-term generation growth. In a constructed twenty-project cohort averaging 500 MW each, an eligible plant-control package of USD 4–8 million creates USD 80–160 million of supplier opportunity across 10 GW of projects; the package boundary excludes turbines, generators and unrelated electrical equipment. If 75% reaches control procurement within the forecast period, realized opportunity falls to USD 60–120 million.
The +0.7-point sensitivity assumes 25% of terminal counterfactual revenue is exposed to new gas projects and realizes approximately 13.6% cumulative outperformance, contributing 3.4% market-wide terminal upside. Strategically, suppliers gain from early OEM and EPC integration, standardized engineering and lifecycle-support agreements; however, turbine reservations and announced capacity are not automatically firm control orders, and delayed commissioning can push revenue outside 2031.
Drivers Impact Analysis
| Driver | (~) % Impact on CAGR | Geographic Relevance | Impact Timeline |
|---|---|---|---|
| Gas-generation project pipeline | +0.7 pp | US, Middle East, Taiwan, ASEAN | Medium term (2–4 years) |
| Legacy-control modernization | +0.6 pp | US, EU, Japan, India | Long term (≥ 4 years) |
| Renewable plant-level coordination | +0.6 pp | China, EU, US, India, Australia | Medium term (2–4 years) |
| Flexible-operation economics | +0.5 pp | EU, US, India, China | Short term (≤ 2 years) |
| Operational cybersecurity upgrades | +0.4 pp | US, Canada, EU, UK | Medium term (2–4 years) |
| Nuclear and hydro refurbishment | +0.4 pp | US, France, Japan, China, Brazil | Long term (≥ 4 years) |
Restraint Analysis
Retirement-Limited Retrofit Economics — −0.5 Percentage Points
Uncertain remaining operating life restricts control-system investment at plants where owners cannot recover modernization costs before retirement, conversion or declining dispatch materially reduces earnings. IEA reports that global coal-fired generation fell approximately 0.5% in 2025, while its 2026 mid-year assessment shows substantial regional differences as fuel prices, nuclear availability and renewable production alter dispatch; falling generation therefore does not imply a uniform or immediately scheduled retirement wave.
In a constructed plant case, a USD 6 million control upgrade delivering USD 1.2 million of annual net operating benefit has a five-year simple payback, but the present value of five annual benefits at an assumed 10% discount rate is only approximately USD 4.55 million, producing a negative USD 1.45 million net present value. Extending the same benefit stream to eight years raises present value to approximately USD 6.40 million, turning the project marginally positive before terminal value, taxes and execution risk. The decisive restraint is thus the recoverable operating horizon rather than the technical availability of modern controls.
The −0.5-point sensitivity assumes 20% of terminal counterfactual revenue is exposed to retirement-sensitive conventional units and suffers an 11.5% realization shortfall, equivalent to approximately 2.3% market-wide terminal erosion. Suppliers face smaller maintenance-only packages, deferred full migrations and limited software commitments; replacement capacity may generate new control orders, but those orders must be recognized separately rather than assumed to offset every cancelled retrofit within 2026–2031.
Restraint Impact Analysis
| Restraint | (~) % Impact on CAGR Forecast | Geographic Relevance | Impact Timeline |
|---|---|---|---|
| Retirement-limited retrofit economics | −0.5 pp | EU, UK, US, Japan | Long term (≥ 4 years) |
| Migration and outage costs | −0.5 pp | US, EU, India, China | Medium term (2–4 years) |
| Nuclear qualification requirements | −0.4 pp | US, France, UK, Japan | Long term (≥ 4 years) |
| Owner financing constraints | −0.3 pp | South Asia, Sub-Saharan Africa | Medium term (2–4 years) |
| Generation-project timing risk | −0.3 pp | US, ASEAN, Middle East | Medium term (2–4 years) |
| Secure-access deployment limits | −0.3 pp | US, Canada; qualified export markets | Medium term (2–4 years) |
Opportunity Analysis
Fleet Remote-Operation Platforms — +0.5 Percentage Points
The opportunity is to extend qualified remote-operation platforms across multi-plant fleets that currently use largely site-specific control and supervision, rather than merely sell replacement DCS hardware. Siemens Energy’s October 2025 Volkswagen reference demonstrates a bounded application: two SGT-800 gas turbines at Wolfsburg were tested for seventy-two hours without constant onsite supervision, responding to remote load commands and completing a controlled shutdown; this establishes one validated operating concept, not general permission for unattended operation at every power station.
Its remote-operation-center offering separately describes centralized monitoring, diagnostics and dispatch integration across single assets or fleets. In a constructed ten-plant program, USD 1.2 million per site for eligible control modifications, communications and integration creates USD 12 million of initial supplier revenue; USD 150,000 annually per site for platform software and technical support adds USD 1.5 million recurring revenue, excluding outsourced operating staff. If recurring delivery expense is USD 900,000, annual contribution is USD 600,000 before product development and corporate overhead.
A shared USD 3 million engineering and validation investment would require five years to recover from that recurring contribution alone, illustrating why initial project margins and fleet scale matter. The +0.5-point sensitivity requires approximately 2.4% incremental terminal market revenue from new platform deployments and support, net of displaced site-level expenditure. Execution requires plant-specific safety cases, communications resilience, local emergency capability and jurisdictional acceptance; the strategic upside is coordinated fleet monetization, not an unsupported assumption that remote control eliminates onsite staffing.
Opportunity Impact Analysis
| Opportunity | (~) % Potential CAGR Upside | Geographic Relevance | Execution Window |
|---|---|---|---|
| Fleet remote-operation platforms | +0.5 pp | US, Germany, UK, Middle East | Medium term (2–4 years) |
| Digital-twin subscription services | +0.5 pp | US, EU, Japan, South Korea | Short term (≤ 2 years) |
| Data-center generation orchestration | +0.5 pp | US, EU, Japan, Singapore | Medium term (2–4 years) |
| Verified-performance control contracts | +0.4 pp | US, EU, India, Middle East | Medium term (2–4 years) |
| Power-to-X control adjacency | +0.3 pp | EU, Australia, Middle East, India | Long term (≥ 4 years) |
| Capability-led acquisition platforms | +0.3 pp | US, Germany, UK, Singapore | Short term (≤ 2 years) |
Challenges Analysis
Multi-Vendor Control Coordination — −0.4 Percentage Points
The technical challenge is coordinating plant supervisory controls, turbine or inverter controllers, protection, excitation and auxiliary systems so that individually functional components deliver stable plant-level behavior. NERC’s February 2025 technical presentation identifies conflicts between inverter responses at low-voltage terminals, whole-plant requirements and transformer tap-changer behavior; it also notes that standard plant controllers and historians typically capture one to two samples per second, compared with up to 100 samples per second for advanced systems with compatible equipment.
These are presentation-specific observations, not universal specifications, but they explain why nominal protocol compatibility does not establish adequate dynamic coordination. In a constructed twenty-project portfolio, three additional integration iterations per project at 200 engineering-hours each require 12,000 hours; at USD 120 per hour, incremental engineering expenditure is USD 1.44 million. If five projects also require USD 80,000 of additional interface hardware and testing, total unplanned delivery cost reaches USD 1.84 million.
Across USD 40 million of fixed-price contracts initially budgeted at a 25% gross margin, that reduces aggregate margin to approximately 20.4% before other overruns. The −0.4-point sensitivity assumes 20% of terminal opportunity-enabled revenue is coordination-sensitive and suffers a 9.5% realization shortfall, producing approximately 1.9% market-wide terminal friction through slower deployment and customer acceptance.
Challenges Impact Analysis
| Challenge | (~) % CAGR Friction Drag | Geographic Relevance | Mitigation Horizon |
|---|---|---|---|
| Multi-Vendor Control Coordination | −0.4 pp | US, EU, China, India, Australia | Long term (≥ 4 years) |
| Model and Configuration Synchronization | −0.3 pp | US, EU, Japan, South Korea | Medium term (2–4 years) |
| Operational Cybersecurity Lifecycle Management | −0.3 pp | US, Canada, EU, UK | Long term (≥ 4 years) |
| Cross-Disciplinary Workforce Development | −0.3 pp | US, EU, Japan, India | Long term (≥ 4 years) |
| Commissioning and Handover Coordination | −0.3 pp | US, Middle East, ASEAN, India | Medium term (2–4 years) |
| Performance Attribution and Verification | −0.2 pp | US, EU, India, Middle East | Medium term (2–4 years) |
Geopolitical Impact Analysis
Geopolitical Impact of Ongoing Wars on the Power Plant Control System Market
The ongoing Russia-Ukraine war and Middle East conflict are increasing pressure on power generation infrastructure and strengthening the need for reliable Power Plant Control Systems. Repeated attacks on Ukrainian electricity facilities have damaged power stations, substations, and transmission assets, creating greater demand for equipment monitoring, automated protection, backup controls, and rapid fault detection.
According to the United Nations, between October 2025 and March 2026, at least 423 attacks targeted Ukraine’s electricity generation, transmission, and distribution facilities, while 74 attacks affected combined heat and power plants and other heating infrastructure. These disruptions have highlighted the importance of resilient control systems that can help operators maintain safe operations and restore equipment after damage.
The Middle East conflict has also disrupted energy supply routes and increased uncertainty around fuel availability and project costs. The International Energy Agency reported that electricity grid investment is expected to approach USD 550 billion in 2026, reflecting growing attention to energy security and infrastructure resilience.
Regional Insights
Dominating Region: Europe – Strong Demand from Power Plant Modernization and Energy Transition
In 2025, Europe held a dominant position in the Power Plant Control System Market, accounting for 33.11% share and a market value of USD 2.9 billion, based on the supplied market estimates. The region benefits from its established power generation infrastructure, strong industrial base, and continued investment in modernizing existing facilities. Power producers are adopting advanced control systems to improve plant efficiency, monitor equipment performance, and manage changing electricity generation patterns.
According to Eurostat, renewable sources accounted for 47.3% of electricity generated in the European Union in 2025. This changing generation mix increases the need for flexible control technologies that can coordinate conventional power plants, renewable energy assets, and grid operations. Nuclear and thermal facilities also require reliable automation to maintain stable output and operational safety.
Asia-Pacific is expected to remain an important growth region as electricity consumption increases and power generation capacity expands. The International Energy Agency reported that electricity demand in Asia-Pacific increased by 4.1% in 2025 and is expected to grow by an average of 4.7% annually between 2026 and 2030. China is expected to account for almost 70% of the region’s additional electricity demand, while Southeast Asia is expected to contribute 11%.
This growth is encouraging utilities and independent power producers to improve plant reliability and operating efficiency. New generation projects, ageing facility upgrades, and the expansion of gas-fired and renewable power assets are creating opportunities for SCADA, distributed control systems, programmable logic controllers, and advanced turbine control solutions.
Key Regions and Countries Insights
- North America
- US
- Canada
- Europe
- Germany
- France
- The UK
- Spain
- Italy
- Rest of Europe
- Asia Pacific
- China
- Japan
- South Korea
- India
- Australia
- Rest of APAC
- Latin America
- Brazil
- Mexico
- Rest of Latin America
- Middle East & Africa
- GCC
- South Africa
- Rest of MEA
Key Players Analysis
ABB Ltd maintains a strong position in power plant automation through its control, electrification, instrumentation, and digital solutions. Its portfolio supports power generation facilities with monitoring, process control, and equipment management technologies. In 2025, ABB reported total revenue of USD 33.22 billion and orders of USD 36.77 billion. Its operational EBITA reached USD 6.31 billion, while research and development investment stood at USD 1.32 billion. The company also employed approximately 111,900 people, supporting its global industrial and automation operations.
Siemens AG offers automation, digitalization, and industrial control technologies used across power generation and energy infrastructure. Its Smart Infrastructure business provides grid control, automation, power distribution, and monitoring solutions that support reliable electricity operations. In fiscal 2025, Siemens recorded total revenue of EUR 78.91 billion, compared with EUR 75.93 billion in fiscal 2024. Its Smart Infrastructure business generated EUR 22.99 billion in revenue and reported EUR 4.51 billion in profit. These results reflect the company’s established presence in industrial automation and energy infrastructure.
GE Vernova is an important supplier of power generation and electrification technologies, including gas turbine systems, generator solutions, plant services, and digital technologies that support power plant operations. Its technologies help power producers improve generation performance, equipment reliability, and operational efficiency. In 2025, GE Vernova reported total revenue of USD 38.1 billion, while customer orders reached USD 59.3 billion. Its total backlog increased by USD 31.2 billion year over year. The company also recorded USD 3.2 billion in adjusted EBITDA, reflecting its position in the global power and electrification industry.
Top Key Players Outlook
- ABB Ltd
- Siemens AG
- General Electric Company
- Emerson Electric Co.
- Schneider Electric SE
- Honeywell International Inc.
- Mitsubishi Power Ltd.
- Yokogawa Electric Corporation
- Rockwell Automation Inc.
- Toshiba Energy Systems & Solutions
- Endress+Hauser AG
- Valmet Oyj
- Hitachi Energy Ltd.
- DF Power Systems Pvt. Ltd.
- Doosan Enerbility Co., Ltd.
- Other Key Players
Recent Developments
- In June 2026, Emerson’s Ovation Green SCADA software supported renewable generation management across 4 sites operated by Holy Cross Energy, serving more than 45,000 members and managing a peak load of approximately 300 MW.
- In October 2026, Schneider Electric signed a definitive agreement to acquire PTC for approximately USD 22.6 billion in equity value, with an enterprise value of approximately USD 23.7 billion.
Report Scope
| Report Features | Description |
|---|---|
| Market Value (2025) | USD 8.9 Bn |
| Forecast Revenue (2035) | USD 17.8 Bn |
| CAGR (2026-2035) | 7.2% |
| Base Year for Estimation | 2025 |
| Historic Period | 2020-2024 |
| Forecast Period | 2026-2035 |
| Report Coverage | Revenue Forecast, Market Dynamics, Competitive Landscape, Recent Developments |
| Segments Covered | By Solution (Supervisory Control and Data Acquisition (SCADA), Programmable Logic Controller (PLC), Distributed Control System (DCS), Plant Asset Management (PAM), Plant Lifecycle Management (PLM)), By Component (Hardware, Software, Services), By Plant Type (Thermal, Nuclear, Renewables, Solar, Wind, Biofuels), By Application (Boiler & Auxiliaries Control, Turbine & Auxiliaries Control, Generator Excitation & Electrical Control, Others) |
| Regional Analysis | North America – US, Canada; Europe – Germany, France, The UK, Spain, Italy, Rest of Europe; Asia Pacific – China, Japan, South Korea, India, Australia, Singapore, Rest of APAC; Latin America – Brazil, Mexico, Rest of Latin America; Middle East & Africa – GCC, South Africa, Rest of MEA |
| Competitive Landscape | ABB Ltd, Siemens AG, General Electric Company, Emerson Electric Co., Schneider Electric SE, Honeywell International Inc., Mitsubishi Power Ltd., Yokogawa Electric Corporation, Rockwell Automation Inc., Toshiba Energy Systems & Solutions, Endress+Hauser AG, Valmet Oyj, Hitachi Energy Ltd., DF Power Systems Pvt. Ltd., Doosan Enerbility Co., Ltd., Other Key Players |
| Customization Scope | Customization for segments, region/country-level will be provided. Moreover, additional customization can be done based on the requirements. |
| Purchase Options | We have three licenses to opt for: Single User License, Multi-User License (Up to 5 Users), Corporate Use License (Unlimited User and Printable PDF) |








