


Report Overview
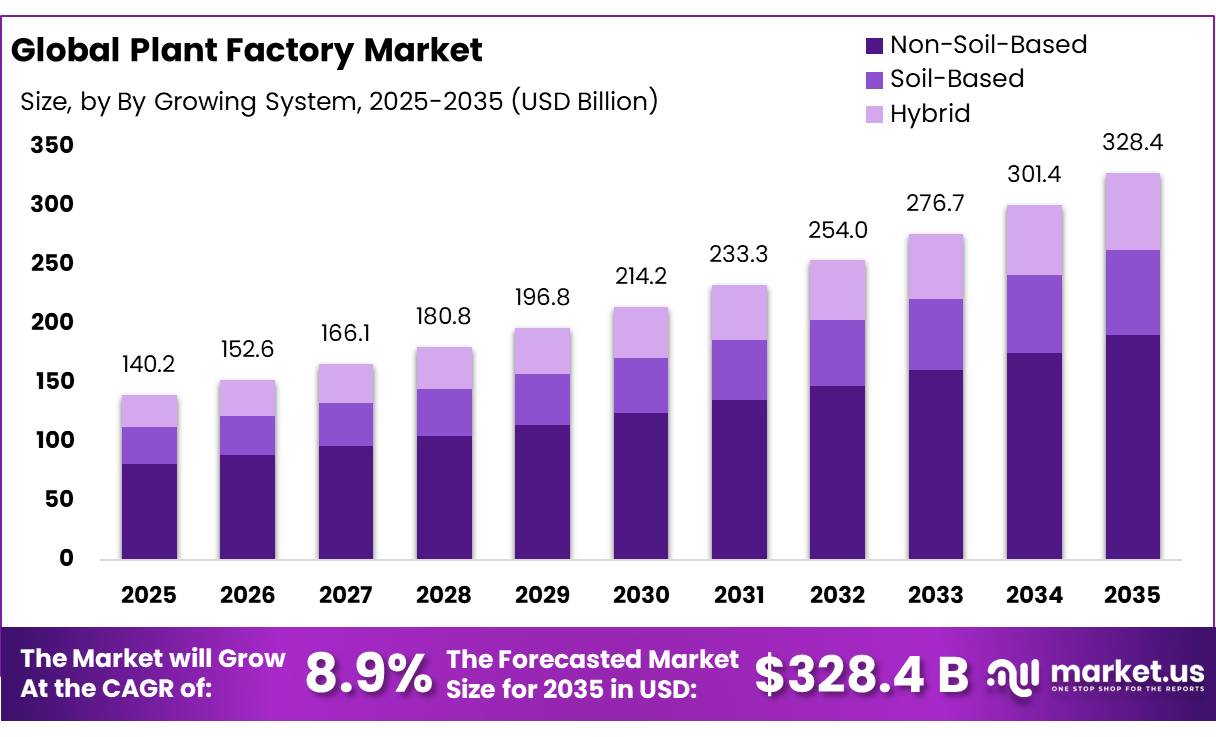
The Global Plant Factory Market size is expected to be worth around USD 328.4 Million by 2035, from USD 140.2 Million in 2025, growing at a CAGR of 8.9% during the forecast period from 2026 to 2035. In 2025, North America held a dominant market position, capturing more than a 32.50% share, holding USD 45.58 Million revenue.
Plant factories are becoming an important part of controlled-environment agriculture, where crops are produced inside highly managed facilities using artificial lighting, hydroponics, sensors, climate-control systems, automation, and digital monitoring. These facilities are designed to control temperature, humidity, light, nutrients, airflow, and water throughout the growing cycle.
- FAO reported in 2025 that commercial urban agriculture had developed into a business worth more than USD 5 billion globally. Its cross-regional study included about 950 participants, nearly 200 companies, and operations across 65 countries. High-tech facilities increasingly use robotics, LED lighting, remote-control systems, hydroponics, and automated environmental management, creating opportunities for equipment suppliers, software companies, nutrient providers, and greenhouse technology firms.
Government statistics also show a strong controlled-production base. USDA reported in February 2026 that the United States had 23,060 horticultural operations with total sales of USD 18.3 billion during 2024. Food crops produced under protection generated USD 1.01 billion, representing a 44% increase compared with 2019. These figures indicate growing commercial acceptance of protected and enclosed food-production systems that can support wider plant-factory development.
Resource efficiency remains one of the strongest driving factors. USDA Agricultural Research Service noted in 2026 that controlled-environment systems using hydroponics and vertical farming can use up to 90% less water than conventional farming. Plant factories can also reduce exposure to drought, rainfall variation, pests, and seasonal temperature changes because most production factors are managed internally.
- Energy efficiency is becoming equally important because plant factories depend heavily on lighting, HVAC, pumps, and environmental controls. The U.S. Department of Energy has invested USD 2.5 million to support deployment of controlled-environment agriculture technologies and business models. DOE has also highlighted heat pumps, waste-heat recovery, automation, and robotics as areas that could improve operating efficiency and address labor constraints.
Future growth opportunities are expected around high-efficiency LEDs, AI-based crop management, robotics, automated harvesting, precision fertigation, heat recovery, renewable electricity, and new crop varieties developed specifically for controlled environments. The European Commission is also supporting agricultural innovation through Horizon Europe, where around EUR 9 billion is allocated to Cluster 6 for food, bioeconomy, natural resources, agriculture, and environmental research during 2021–2027.
Key Takeaways
- Plant Factory Market size is expected to be worth around USD 328.4 Million by 2035, from USD 140.2 Million in 2025, growing at a CAGR of 8.9%.
- Non-Soil-Based held a dominant market position, capturing more than a 58.00% share.
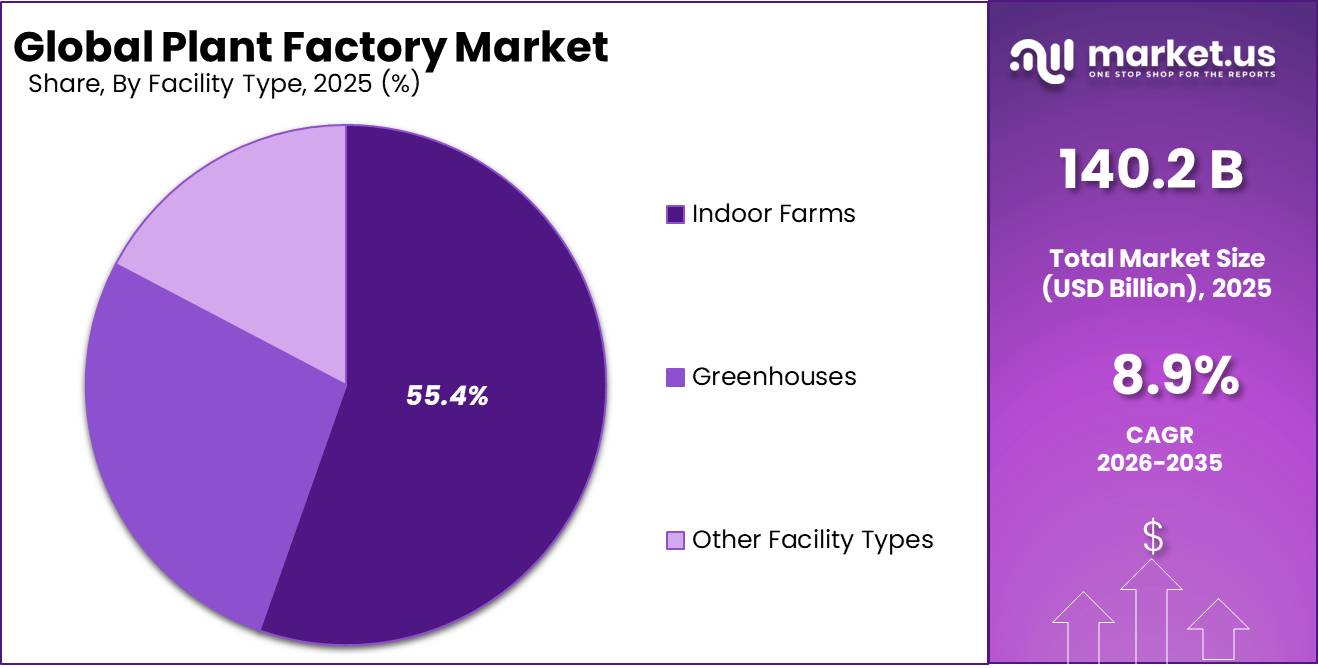
- Indoor Farms held a dominant market position, capturing more than a 55.00% share.
- Full Artificial Light held a dominant market position, capturing more than a 64.60% share.
- Vegetables held a dominant market position, capturing more than a 58.20% share.
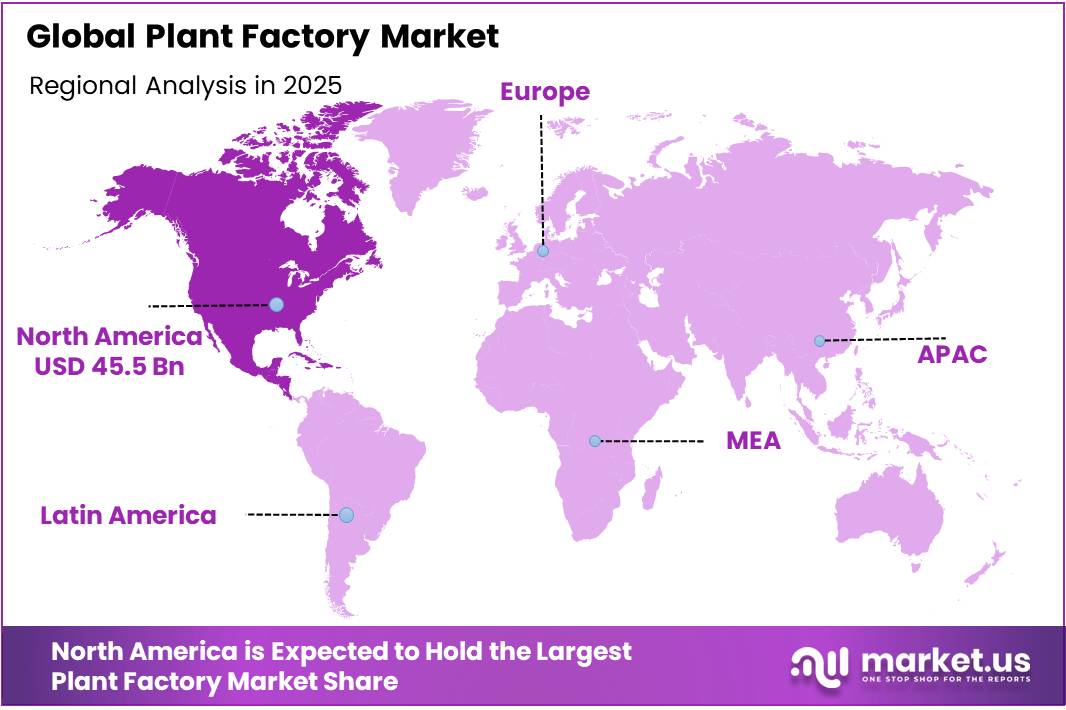
- North America held a dominant position in the Plant Factory Market, capturing more than a 32.50% share and reaching approximately USD 45.58 billion.
By Growing System Analysis
Non-Soil-Based Systems Lead with More Than 58.00% Share, Supported by Water Efficiency and Precise Crop Control
In 2025, “Non-Soil-Based” held a dominant market position, capturing more than a 58.00% share. The segment remains widely used in plant factories because hydroponic and substrate-based systems allow growers to control water, nutrients, root-zone conditions, and crop cycles without depending on field soil. According to the USDA Agricultural Research Service, controlled-environment systems using technologies such as hydroponics and vertical farming can use up to 90% less water than traditional farming.
Government research is also improving the technical performance of non-soil systems. In 2025, USDA ARS continued work on soilless culture technologies covering mineral nutrition, substrate management, water treatment, lighting, airflow, and automation. The programme is designed to improve crop productivity while reducing water, agrichemical, and nutrient losses in protected cultivation. A separate USDA-supported controlled-environment project, running from 2024 to 2027, is testing hydroponic and drip-irrigation systems, water quality, and automatic irrigation controls for vegetable production.
Soil-Based systems continue to hold an important place in the Plant Factory Market, particularly in greenhouse-style facilities and controlled environments where growers prefer natural or amended growing media. These systems are suitable for crops that benefit from established root-zone biology, organic matter, and familiar irrigation and fertilization practices. Soil-based plant factories can still use sensors, supplemental lighting, automated ventilation, computerized irrigation, and environmental controls to improve crop consistency.
By Facility Type Analysis
Indoor Farms Lead with More Than 55.00% Share, Supported by Fully Controlled Year-Round Production
In 2025, “Indoor Farms” held a dominant market position, capturing more than a 55.00% share. Indoor farms remain central to the Plant Factory Market because they allow growers to manage lighting, temperature, humidity, irrigation, nutrients, and airflow inside fully enclosed facilities. FAO reported in 2025 that modern indoor farming includes vertical farms, hydroponic systems, and other enclosed controlled environments that can support local and year-round food production. These facilities are increasingly designed around LED lighting, robotics, remote controls, and soilless cultivation.
Government statistics also show that enclosed production is becoming a visible part of commercial horticulture. The USDA 2024 Census of Horticultural Specialties, released in 2026, recorded around 38 million square feet of fixed enclosed horticultural structures in the United States. This category was collected for the first time in 2024 and covers facilities such as warehouses and growth chambers used for protected production.
Greenhouses continue to represent an important facility type in the Plant Factory Market because they combine protected cultivation with the use of natural sunlight. Growers can add heating, cooling, ventilation, supplemental lighting, hydroponics, sensors, and automated irrigation while maintaining a lower dependence on artificial lighting than fully enclosed plant factories. This makes greenhouse facilities suitable for vegetables, herbs, flowers, seedlings, and other high-value crops requiring stable growing conditions.
By Light Type Analysis
Full Artificial Light Leads with More Than 64.60% Share, Supported by Precise Spectrum and Year-Round Crop Control
In 2025, “Full Artificial Light” held a dominant market position, capturing more than a 64.60% share. The segment plays a major role in plant factories because artificial lighting gives growers direct control over light intensity, spectrum, and photoperiod without depending on seasonal sunlight or outdoor weather. LED systems are especially important in fully enclosed vertical farms, where they support continuous production of leafy greens, herbs, seedlings, and other high-value crops. FAO reported in 2025 that high-tech urban agriculture is increasingly using LED lighting together with robotics, remote-control systems, and hydroponics inside controlled growing environments.
Government-backed research is also helping improve the performance of artificial lighting. In June 2025, USDA Agricultural Research Service published research showing that programmable LED lighting can improve the growth and nutrient characteristics of red cabbage microgreens under controlled conditions. (ars.usda.gov) FAO AGRIS also recorded a 2025 study reporting that LED lighting can use about 25% of the energy required by conventional lighting systems, while allowing growers to select wavelengths suited to different stages of crop development.
Sunlight remains an important light source in the Plant Factory Market, mainly across greenhouse and hybrid controlled-environment facilities. Natural daylight helps growers reduce dependence on electric lighting while still using heating, cooling, irrigation, supplemental LEDs, sensors, and automated climate controls. This approach is suitable for tomatoes, peppers, cucumbers, herbs, flowers, and other crops that perform well under protected conditions while still benefiting from available sunlight.
By Crop Type Analysis
Vegetables Lead with More Than 58.20% Share, Supported by Strong Demand for Leafy Greens and Controlled Production
In 2025, “Vegetables” held a dominant market position, capturing more than a 58.20% share. Vegetables are widely produced in plant factories because leafy greens, lettuce, peppers, cucumbers, and similar crops respond well to controlled lighting, hydroponics, precise irrigation, and stable temperature conditions. Their relatively short growing cycles and high fresh-market demand also make them suitable for year-round indoor production.
Government data support the strong commercial importance of these crops. According to the USDA Vegetables 2025 Summary, published in February 2026, U.S. romaine lettuce production reached 46.7 million cwt in 2025, while leaf lettuce production totaled 16.1 million cwt and cucumber production reached 14.3 million cwt. Bell pepper production was also reported at 10.6 million cwt. (USDA NASS)
Fruits are developing as an important crop category within the Plant Factory Market, particularly for strawberries and other high-value produce that can benefit from controlled temperature, irrigation, lighting, and humidity. Indoor and greenhouse-based systems can help growers improve production consistency, reduce weather exposure, and extend the growing season.
Key Market Segments
By Growing System
- Soil-Based
- Non-Soil-Based
- Hybrid
By Facility Type
- Greenhouses
- Indoor Farms
- Other Facility Types
By Light Type
- Sunlight
- Full Artificial Light
By Crop Type
- Vegetables
- Fruits
- Flowers and Ornamentals
- Other Crops
Driver Analysis
Food-Security Localization
Plant factories are moving from experimental urban agriculture toward strategic, near-demand production infrastructure because urban concentration and import exposure increase the economic value of predictable local output: 55% of the global population already lived in urban areas in the UN’s baseline, the share is projected to reach 68% by 2050, and another 2.5 billion urban residents are expected, with almost 90% of the increase occurring in Asia and Africa.
The supply-chain value proposition is reinforced by physical loss—FAO estimated that 13.3% of global production, or 1.31 billion tonnes, was lost between harvest and retail, with fruit and vegetables carrying the highest loss rate at 25.4%—so production inside or near cities can monetize shorter transport, fewer handling events, year-round contracts and reduced safety stock rather than compete only on farm-gate cost.
USDA evidence shows the underlying operating base is already scaling: U.S. CEA operations more than doubled to nearly 3,000 between 2009 and 2019 while output rose 56%, from 502 million to 786 million pounds. This driver changes the vendor model from one-off rack, LED and HVAC sales toward turnkey capacity, multi-year uptime guarantees, crop-recipe licensing and offtake-linked financing; the independently modeled +2.1-point CAGR contribution reflects faster equipment refresh and greenfield deployment in import-dependent Asian and Gulf cities, but assumes investment remains concentrated in leafy greens, herbs, seedlings and premium fruit where freshness, continuity and logistics savings can absorb the plant factory’s energy and capital premium.
Drivers Impact Analysis
| Driver | (~) % Impact on CAGR Forecast | Geographic Relevance | Impact Timeline |
|---|---|---|---|
| Food-Security Localization | +2.1 pp | East Asia, GCC, Singapore, EU cities | Medium term (2–4 years) |
| Water-Land Productivity | +1.8 pp | GCC, North Africa, India, China, U.S. West | Long term (≥4 years) |
| LED-Control Efficiency | +1.6 pp | North America, EU, Japan, Korea | Short term (≤2 years) |
| Automation-Labor Substitution | +1.3 pp | Japan, Korea, EU, North America | Medium term (2–4 years) |
| Public Technology Funding | +1.1 pp | Singapore, Japan, EU, North America | Short term (≤2 years) |
| Compliance-Grade Production | +0.8 pp | U.S., EU, Japan, premium APAC | Medium term (2–4 years) |
Restraint Analysis
Capital Intensity
Plant factories require lighting, insulated structures, stacked cultivation racks, fertigation, HVAC-dehumidification, sensors and automation before biological yield or customer demand is proven, creating a financing profile closer to specialized manufacturing than conventional farming: USDA estimates vertical-farm startup expenditure at $150–$400 per square foot versus $50–$150 for a greenhouse, so a 100,000-square-foot project implies approximately $15–$40 million of initial facility cost before land, working capital, commissioning waste and downstream packing.
Credit remains expensive in the 2026 baseline—late-2025 U.S. farm operating-loan rates were 7.50%–7.78% and farm mortgage rates 6.80%–7.41%, still near levels unseen since 2007—meaning the illustrative facility could carry approximately $1.0–$3.1 million of annual interest before principal amortization, while Federal Reserve evidence in 2026 shows rising loan demand, more renewals and weaker repayment conditions.
This suppresses large greenfield equipment orders, extends investment-committee payback thresholds, and moves procurement toward modular expansion, leased hardware, retrofit projects and long-term offtake-backed financing; the modeled -2.4 percentage-point CAGR deduction reflects projects postponed or downsized because debt-service coverage and utilization assumptions fail lender stress tests rather than because crop demand disappears
Restraint Impact Analysis
| Restraint | (~) % Impact on CAGR | Geographic Relevance | Impact Timeline |
|---|---|---|---|
| Capital intensity | -2.4 pp | North America, EU, Japan | Medium term (2–4 years) |
| Electricity exposure | -2.1 pp | EU, Japan, Korea, U.S. coasts | Short term (≤ 2 years) |
| Narrow crop economics | -1.7 pp | Global; staple-crop projects | Long term (≥ 4 years) |
| Premium-price pressure | -1.2 pp | North America, Western Europe | Short term (≤ 2 years) |
| Biosecurity compliance | -0.9 pp | U.S., EU, export APAC | Medium term (2–4 years) |
| Skilled-labor scarcity | -0.7 pp | North America, EU, Japan, GCC | Medium term (2–4 years) |
Opportunity Analysis
Greenhouse Retrofit Stack
This is an untapped equipment-conversion opportunity rather than a baseline driver because most plant-factory vendors still sell complete greenfield facilities, while a much larger installed base of greenhouses and protected-crop farms can be monetized through modular LED, sensor, fertigation, climate-control and edge-compute retrofits without replacing the shell; the U.S. alone had 11,465 greenhouse-vegetable and fresh-herb operations in 2022 and produced an estimated 763 million lb of tomatoes under protected structures in 2023, while 2024 U.S. food crops under protection generated $1.01 billion, 44% above 2019, establishing a sizable conversion funnel outside pure vertical farms.
DOE evidence indicates horticultural LEDs use 24–30% less electricity than HPS and other conventional lighting, while full LED conversion of the previously characterized U.S. indoor-horticulture stock could cut lighting use by 34% and save about $350 million annually, making shared-savings retrofits commercially financeable.
The modeled +1.8-point upside assumes vendors convert only 3–5% of addressable protected-area customers annually, price hardware-and-controls packages at roughly 10–18% of greenfield replacement cost, attach five-year monitoring contracts worth 3–6% of installed value per year, and achieve 25–35% blended gross margins; this shifts revenue from irregular turnkey projects toward repeatable kits, commissioning and recurring optimization fees, lowers customer payback risk, and lets suppliers capture legacy estates that baseline plant-factory forecasts largely treat as separate greenhouse infrastructure.
Opportunity Impact Analysis
| Opportunity | (~) % Potential CAGR Upside | Geographic Relevance | Execution Window |
|---|---|---|---|
| Greenhouse retrofit stack | +1.8 pp | EU, North America, East Asia | Short term (≤2 years) |
| Propagation-as-a-Service | +1.5 pp | North America, EU, APAC | Short term (≤2 years) |
| Biofactory crop platforms | +1.4 pp | North America, EU, Japan, Canada | Long term (≥4 years) |
| Energy-flexibility monetization | +1.2 pp | EU, North America, Japan | Medium term (2–4 years) |
| Digital-twin subscriptions | +1.0 pp | EU, North America, East Asia | Medium term (2–4 years) |
| Modular regional licensing | +0.8 pp | GCC, India, Southeast Asia, Africa | Medium term (2–4 years) |
Challenges Analysis
Multi-System Integration Debt
Plant factories combine lighting, HVAC/dehumidification, nutrient dosing, water treatment, conveyors, imaging, robotics, ERP and cloud platforms whose vendors often use incompatible schemas and control protocols; this is an ongoing challenge rather than a sales restraint because farms can still be built, but each deployment accumulates custom middleware, manual data reconciliation and vendor-lock-in costs that impede replication.
A 2025 systematic review identified 27 smart-agriculture integration challenges across organizational, technological and data-governance domains, with lack of standardization appearing in 17 reviewed studies and interoperability hindered by incompatible formats, procedures and protocols.
For a commercial facility with 8–12 major subsystems and hundreds to thousands of sensing points, independent scenario modeling assigns a 10–18% engineering-hour penalty during integration, 4–8 additional commissioning weeks, and 2–4% of annual technology spend to connectors, data cleaning and version maintenance; even a one-week launch slippage forfeits roughly 1.9% of annualized rack availability.
The modeled -1.4-point CAGR friction reflects slower multi-site rollouts and elevated service overhead rather than cancelled demand; mitigation requires an open namespace, API and event-bus architecture, protocol gateways, digital commissioning tests, contractual data ownership, semantic standards such as agroXML/RDF/OWL, and an edge layer that allows one failed cloud or vendor service to degrade gracefully rather than interrupt climate control.
Challenges Impact Analysis
| Challenge | (~) % CAGR Friction Drag | Geographic Relevance | Mitigation Horizon |
|---|---|---|---|
| Multi-System Integration Debt | -1.4 pp | North America, EU, East Asia | Long term (≥4 years) |
| Hybrid Talent Scarcity | -1.2 pp | North America, EU, GCC, Japan | Long term (≥4 years) |
| Crop Recipe Reproducibility | -1.1 pp | Global commercial hubs | Medium term (2–4 years) |
| Closed-Loop Biosecurity Risk | -1.0 pp | Global hydroponic clusters | Long term (≥4 years) |
| Component Lifecycle Exposure | -0.8 pp | EU, North America, APAC | Medium term (2–4 years) |
| Cyber-Physical Farm Risk | -0.7 pp | North America, EU, East Asia | Long term (≥4 years) |
Geopolitical Impact Analysis
The ongoing 2026 Middle East war is increasing operating pressure on the Plant Factory Market because these facilities depend heavily on electricity, cooling, heating, LED lighting, pumps, and nutrient systems. The International Energy Agency reported that disruption around the Strait of Hormuz affected almost 20% of global LNG supply, pushing gas prices in Europe and Asia to their highest levels since the 2022–2023 energy crisis.
Higher energy prices directly affect plant factories because artificial lighting and HVAC systems operate for long hours. Fertilizer and nutrient costs are also rising. FAO reported in 2026 that around 1.3 million tonnes of fertilizer per month could no longer pass through the Strait during the disruption, while 39 countries introduced fertilizer-related policy measures. The IEA further reported that urea prices doubled between January and May 2026, increasing pressure on nutrient-intensive controlled farming.
At the same time, the conflict is strengthening interest in local food production. Plant factories can reduce dependence on long-distance supply chains and unstable weather conditions. This situation is likely to encourage greater use of renewable electricity, efficient LEDs, heat recovery, automated nutrient dosing, and closed-loop water systems to control operating costs and improve supply security
Regional Insights
In 2025, North America held a dominant position in the Plant Factory Market, capturing more than a 32.50% share and reaching approximately USD 45.58 billion in value. The region benefits from strong controlled-environment agriculture infrastructure, high adoption of hydroponics and LED lighting, and growing investment in automation and climate-control systems. In February 2026, USDA reported that U.S. horticultural operations generated USD 18.3 billion in sales across 23,060 operations, while food crops grown under protection reached USD 1.01 billion, up 44% from 2019. These figures show a large commercial base for plant factory technologies.
North America remains the dominant regional market as growers increasingly use enclosed production to reduce weather exposure and improve year-round crop consistency. In June 2026, USDA’s National Institute of Food and Agriculture announced USD 4 million for Urban, Indoor, and Emerging Agriculture projects, with individual awards ranging from USD 50,000 to USD 500,000. The funding supports research, education, and technologies across indoor production, harvesting, packaging, distribution, and related food systems.
Asia Pacific is positioned as the fastest-growing regional landscape, supported by labor shortages, urban food-security needs, and government-backed smart agriculture programs. Japan’s Ministry of Agriculture reported in 2025 that the country’s core agricultural workforce could fall from 1.16 million to about 300,000 over the next 20 years, increasing the need for automation and data-driven cultivation. Singapore is also expanding high-tech urban farming; a government-highlighted indoor vertical farm uses 16 growing levels and automated crop movement.
Key Regions and Countries Insights
- North America
- US
- Canada
- Europe
- Germany
- France
- The UK
- Spain
- Italy
- Rest of Europe
- Asia Pacific
- China
- Japan
- South Korea
- India
- Australia
- Rest of APAC
- Latin America
- Brazil
- Mexico
- Rest of Latin America
- Middle East & Africa
- GCC
- South Africa
- Rest of MEA
Key Players Analysis
AeroFarms, Inc. is a major plant-factory operator focused on indoor vertical production of microgreens using aeroponics, LED lighting, automation, and environmental controls. In January 2025, the company said it had fully commercialized its vertical-farming model for large-scale microgreen production. In June 2025, AeroFarms marked 8 years of partnership with Whole Foods Market and offered 7 microgreen products nationwide. The company also stated that its technology uses about 90% less water and 230 times less land than conventional outdoor farming.
Plenty Unlimited Inc. develops indoor vertical farms using proprietary growing towers, sensors, robotics, computer vision, and machine learning. Its Richmond, Virginia farm was designed to produce more than 4 million pounds of strawberries annually within less than 40,000 square feet, using 30-foot vertical towers. In March 2025, Plenty entered Chapter 11 with USD 20.7 million in debtor-in-possession financing. By May 2025, it had completed restructuring and shifted its main commercial focus toward year-round strawberry production and farm-technology sales.
Gotham Greens Holdings, LLC operates hydroponic, climate-controlled greenhouses that combine natural sunlight, automated irrigation, environmental controls, and data-based crop management. The company operates 13 greenhouses across 9 U.S. states, covering more than 1.8 million square feet, or roughly 40 acres. Its Texas and Georgia facilities each span about 210,000 square feet, while its Virginia greenhouse covers 540,000 square feet. Gotham Greens states that its greenhouse technology can use up to 90% less water and 97% less land than conventional farming.
Top Key Players Outlook
- AeroFarms, Inc.
- Plenty Unlimited Inc.
- Gotham Greens Holdings, LLC
- Spread Co., Ltd.
- Mirai Co., Ltd.
- Freight Farms, Inc.
- CubicFarm Systems Corp.
- Intelligent Growth Solutions Ltd.
- Sky Greens
- Lufa Farms Inc.
- Signify N.V.
- Netafim Ltd.
- Priva Holding B.V.
- Argus Control Systems Ltd.
- Heliospectra AB
Recent Developments
- March 2025, CubicFarm Systems Corp closed a private placement that raised about CAD 2.5 million in its first tranche through 8,340,781 units priced at CAD 0.30 each.
- Freight Farms’ global network includes more than 800 deployed farms, operations across 42 countries, 50 U.S. states and 3 territories, and more than 2,100 trained farmers.
Report Scope
| Report Features | Description |
|---|---|
| Market Value (2025) | USD 140.2 Mn |
| Forecast Revenue (2035) | USD 328.4 Mn |
| CAGR (2026-2035) | 8.9% |
| Base Year for Estimation | 2025 |
| Historic Period | 2020-2024 |
| Forecast Period | 2026-2035 |
| Report Coverage | Revenue Forecast, Market Dynamics, Competitive Landscape, Recent Developments |
| Segments Covered | By Growing System (Soil-Based, Non-Soil-Based, Hybrid), By Facility Type (Greenhouses, Indoor Farms, Other Facility Types), By Light Type (Sunlight, Full Artificial Light, By Crop Type, Vegetables, Fruits, Flowers and Ornamentals, Other Crops) |
| Regional Analysis | North America – US, Canada; Europe – Germany, France, The UK, Spain, Italy, Rest of Europe; Asia Pacific – China, Japan, South Korea, India, Australia, Singapore, Rest of APAC; Latin America – Brazil, Mexico, Rest of Latin America; Middle East & Africa – GCC, South Africa, Rest of MEA |
| Competitive Landscape | AeroFarms, Inc., Plenty Unlimited Inc., Gotham Greens Holdings, LLC, Spread Co., Ltd., Mirai Co., Ltd., Freight Farms, Inc., CubicFarm Systems Corp., Intelligent Growth Solutions Ltd., Sky Greens, Lufa Farms Inc., Signify N.V., Netafim Ltd., Priva Holding B.V., Argus Control Systems Ltd., Heliospectra AB |
| Customization Scope | Customization for segments, region/country-level will be provided. Moreover, additional customization can be done based on the requirements. |
| Purchase Options | We have three licenses to opt for: Single User License, Multi-User License (Up to 5 Users), Corporate Use License (Unlimited User and Printable PDF) |





































