


Report Overview
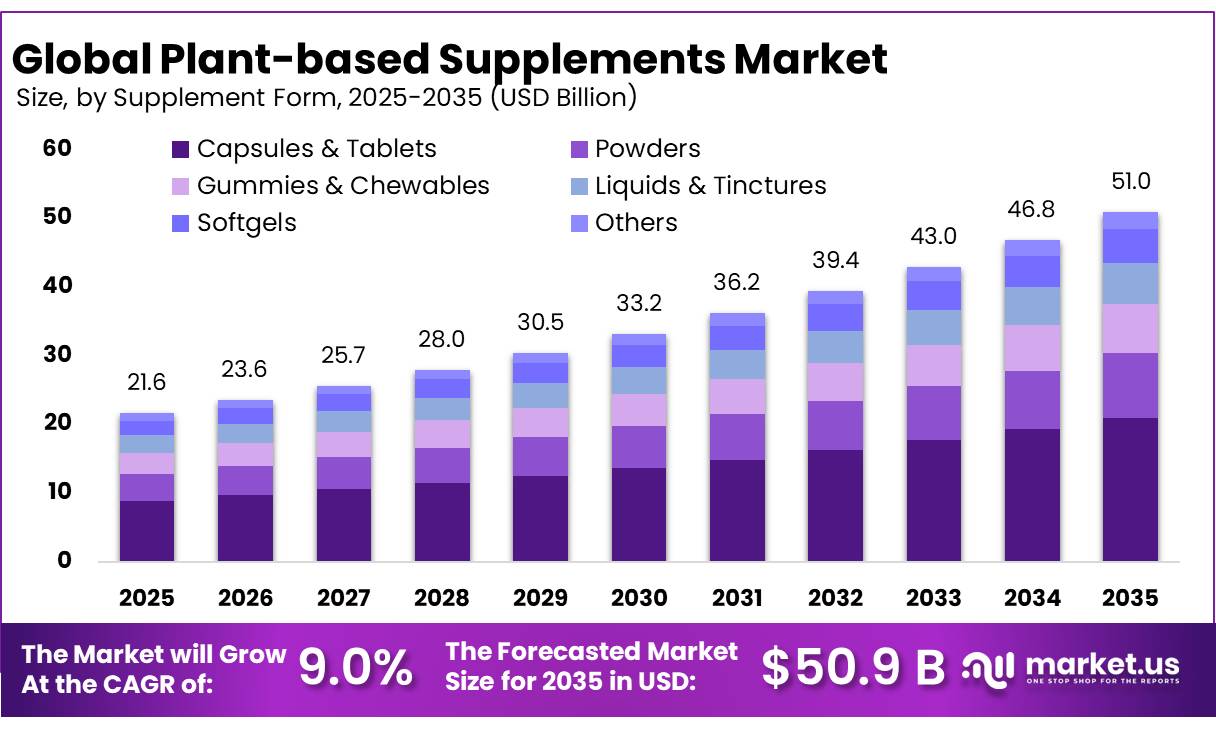
The Global Plant-based Supplements Market size is expected to be worth around USD 50.9 Billion by 2035, from USD 21.6 Billion in 2025, growing at a CAGR of 9.0% during the forecast period from 2026 to 2035. In 2025, North America held a dominant market position, capturing more than a 32.12% share, holding USD 6.9 Billion revenue.
The plant-based supplements industry is gaining attention as consumers increasingly seek nutritional products made from plant-derived ingredients. The industry includes plant-based protein powders, vitamin and mineral supplements, botanical extracts, amino acids, and other products designed to support daily nutritional requirements. Manufacturers are focusing on clean-label formulations, vegan-friendly ingredients, allergen-conscious products, and convenient formats such as capsules, powders, gummies, and ready-to-mix beverages.
The United States provides an important example of the industry’s commercial scale. According to the National Institutes of Health’s Office of Dietary Supplements, about one-half of adults and one-third of children and adolescents in the United States use dietary supplements. Its 2025–2029 strategic plan also identifies continuing research into supplement safety, effectiveness, metabolism, and health effects as a priority. Although these figures cover dietary supplements broadly rather than plant-based products alone, they indicate an established consumer base for nutritional supplementation.
Plant-based protein is a major area of product development, supported by the availability of pulses, legumes, soybeans, peas, nuts, and seeds. The Organisation for Economic Co-operation and Development and the Food and Agriculture Organization reported that global pulse consumption reached 101 million tonnes in 2024, following average annual growth of 2% during the previous decade.
Pulses can be processed into protein, starch, and fibre ingredients for food and beverage applications. This supply base creates opportunities for supplement producers to develop plant protein concentrates, blended protein powders, and fortified nutritional products. However, pulse consumption is not equivalent to demand for protein supplements, and the figure should be treated as an agricultural supply indicator.
Product safety and regulatory compliance remain important industry considerations. The United States Food and Drug Administration requires dietary supplement manufacturers to follow applicable manufacturing and quality-control requirements under 21 CFR Part 111. These requirements cover production processes, component specifications, laboratory operations, packaging, labelling, and finished-product quality.
The agency also monitors concerns involving contamination, undeclared ingredients, and misleading product claims. Compliance increases the importance of supplier verification, ingredient identity testing, contaminant screening, and batch documentation. These controls can add operating costs, particularly for smaller manufacturers and businesses sourcing ingredients from multiple suppliers. Source: U.S. Food and Drug Administration, Dietary Supplement Manufacturing Requirements.
Key Takeaways
- Plant-based Supplements Market size is expected to be worth around USD 50.9 Billion by 2035, from USD 21.6 Billion in 2025, growing at a CAGR of 9.0%.
- Vitamin & Mineral Supplements held a dominant market position, capturing more than a 33.12% share.
- Capsules & Tablets held a dominant market position, capturing more than a 41.23% share.
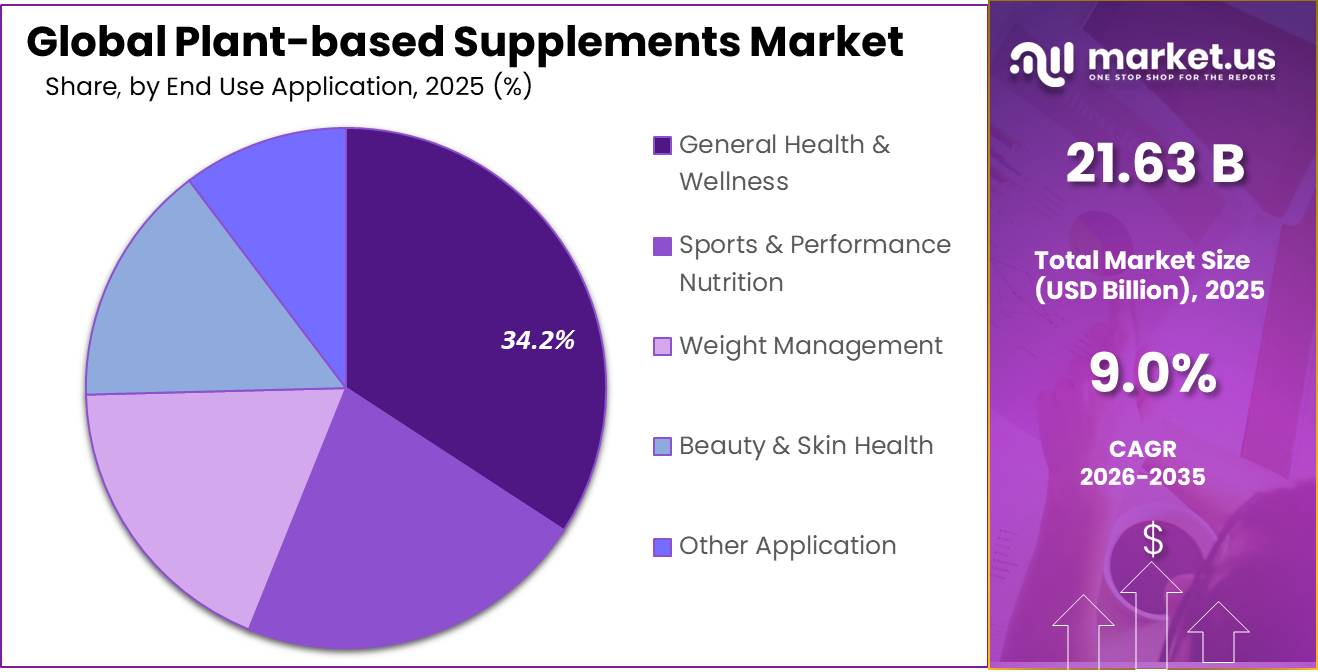
- General Health & Wellness held a dominant market position, capturing more than a 34.21%.
- Supermarkets & Hypermarkets held a dominant market position, capturing more than a 32.78% share.
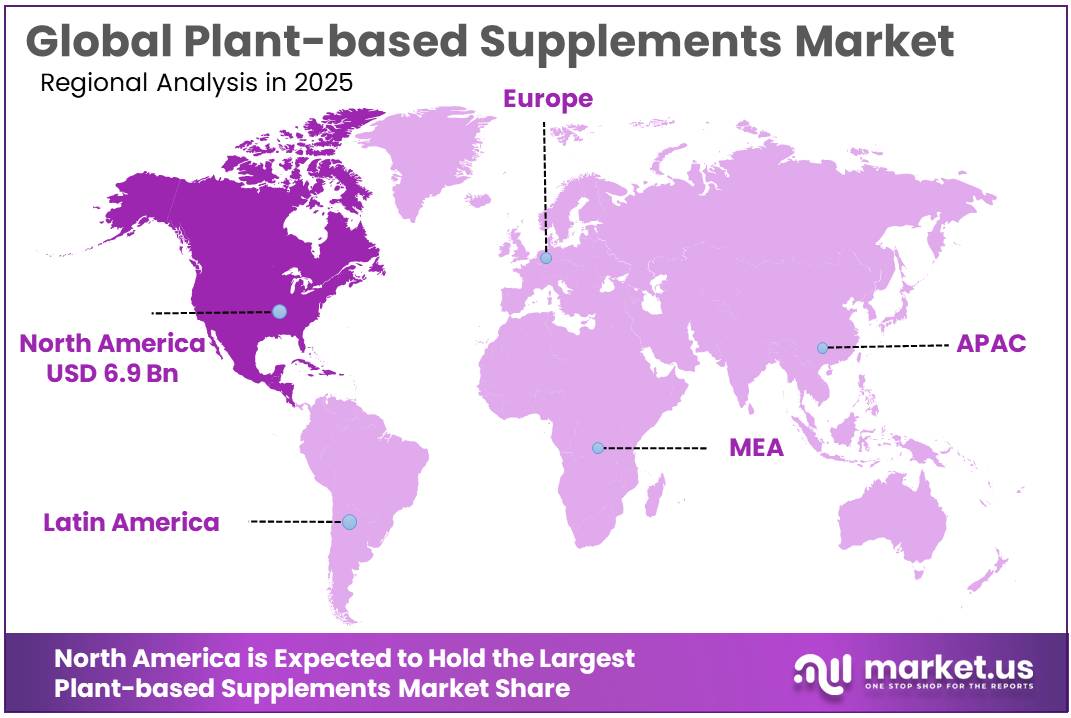
- North America held a dominant position in the plant-based supplements market, accounting for 32.12% share, with a market value of USD 6.9 billion.
By Product Type Analysis
Vitamin & Mineral Supplements remain a leading product segment due to their role in meeting daily nutritional needs.
In 2025, “Vitamin & Mineral Supplements” held a dominant market position, capturing more than a 33.12% share of the plant-based supplements market. Demand for this segment is supported by consumer interest in daily nutrition, immune function, bone health, and the prevention of nutrient deficiencies. Plant-based formulations appeal to consumers seeking vegetarian-friendly products and supplements made with ingredients that align with their dietary preferences. Products may include vitamin B12, vitamin C, vitamin D, iron, calcium, and zinc, depending on the formulation and intended use.
In 2025, the United States National Institutes of Health’s Office of Dietary Supplements continued to provide official information on vitamin and mineral supplements, including their functions, food sources, and safety considerations. These resources support consumer awareness of nutritional requirements, although they do not establish the market share of plant-based supplements. The segment’s 33.12% share in 2025 is the supplied market figure; no additional market size or growth figures are added.
Protein Supplements are an important product category in the plant-based supplements market, with products commonly made from pea, soy, rice, and other plant protein sources. These supplements are used by consumers looking to support muscle recovery, maintain muscle mass, and increase protein intake without relying on animal-based ingredients.
In October 2026, the United States Centers for Disease Control and Prevention reported that adults obtained 15.5% of their total daily calories from protein, based on data collected from August 2021 to August 2023. This government statistic provides useful context for understanding protein consumption, but it does not specifically measure plant-based protein supplement sales or establish the segment’s market share.
By Supplement Form Analysis
Capsules & Tablets lead the market due to their convenience, accurate dosage, and easy storage.
In 2025, “Capsules & Tablets” held a dominant market position, capturing more than a 41.23% share of the plant-based supplements market. These formats are widely suited to consumers seeking a convenient way to take plant-derived vitamins, minerals, botanical extracts, and other nutritional ingredients. Capsules and tablets are easy to carry, require little preparation, and allow manufacturers to provide clearly measured servings.
Plant-based capsules also appeal to consumers seeking alternatives to gelatin-based products, while tablets offer practical packaging and storage advantages. In 2025, demand for these formats was supported by interest in daily nutrition and convenient supplement routines. The 41.23% share represents the supplied market figure; government sources generally report broader dietary supplement use rather than market shares by supplement form.
Powders are an important supplement form in the plant-based supplements market, particularly for consumers seeking protein from peas, soy, rice, and other plant-derived sources. They can be mixed with water, plant-based milk, smoothies, and other beverages, making them suitable for daily nutrition and post-exercise routines. Manufacturers also use powder formats for plant-based meal supplements, fibre blends, and powdered vitamin and mineral formulations.
In 2025, product development continued to focus on improving taste, solubility, texture, and ingredient combinations to make plant-based powders more appealing to consumers. The United States Food and Drug Administration identifies powders as one of the recognised forms of dietary supplements, alongside tablets and capsules. However, the agency does not publish a verified market share for plant-based supplement powders, so a numerical share cannot be stated without an independent, reliable source. Source: U.S. Food and Drug Administration, Dietary Supplement Forms.
By End Use Application Analysis
General Health & Wellness leads the market as consumers seek convenient ways to support everyday nutritional needs.
In 2025, “General Health & Wellness” held a dominant market position, capturing more than a 34.21% share of the plant-based supplements market. This segment benefits from consumer interest in maintaining a balanced diet, supporting normal immune function, and meeting daily vitamin and mineral requirements. Plant-based supplements, including botanical extracts, plant-derived nutrients, and vegan-friendly formulations, appeal to consumers seeking products that fit their dietary preferences.
Demand is also supported by growing awareness of preventive nutrition and the convenience of incorporating supplements into daily routines. Manufacturers are responding with products designed for everyday use, clear ingredient labels, and convenient formats such as capsules, tablets, and powders. The 34.21% share in 2025 is the supplied market figure and is not presented as an independently verified government statistic.
Sports & Performance Nutrition is an important application segment in the plant-based supplements market, serving athletes, gym users, and physically active consumers who seek nutritional support for training and recovery. Products include plant-based protein powders, amino acid formulations, electrolyte supplements, and selected vitamins and minerals. Pea, soy, and rice proteins are commonly used in formulations designed for consumers who prefer alternatives to animal-derived ingredients.
In 2026, the United States Centers for Disease Control and Prevention reported that 47.2% of adults aged 18 and older met federal guidelines for aerobic physical activity in 2024. This figure provides a useful indicator of participation in physical activity, although it does not directly measure demand for sports supplements or plant-based products.
By Distribution Channel Analysis
Supermarkets & Hypermarkets lead the segment through product accessibility, in-store visibility, and convenient shopping.
In 2025, “Supermarkets & Hypermarkets” held a dominant market position, capturing more than a 32.78% share of the plant-based supplements market. These retail outlets attract consumers by offering a range of nutritional products in one location, including plant-based protein powders, vitamin and mineral supplements, botanical products, and other health-focused formulations.
Their established distribution networks, shelf visibility, promotional offers, and immediate product availability support their role in supplement sales. Consumers can also compare brands, packaging, ingredients, and prices before purchasing. In 2025, supermarkets and hypermarkets remained a relevant distribution channel for shoppers who preferred physical stores over online ordering. The 32.78% share is the supplied market figure; no additional market-share or sales values are assumed.
Online Retail provides consumers with access to plant-based protein powders, vegan vitamins, botanical supplements, and other nutritional products through e-commerce platforms and brand websites. Consumers can compare ingredient lists, serving sizes, prices, and customer reviews before purchasing. Subscription services, home delivery, and access to niche products also make online channels attractive to consumers with specific dietary preferences.
In 2025, the U.S. Census Bureau estimated that total retail e-commerce sales reached USD 1,233.7 billion, representing 16.4% of total U.S. retail sales. E-commerce sales increased by 5.4% compared with 2024. These official figures demonstrate the scale of online retail, although they cover all retail products rather than plant-based supplements specifically.
Key Market Segments
By Product Type
- Protein Supplements
- Soy Protein
- Pea Protein
- Blended Plant Proteins
- Other Sources
- Vitamin & Mineral Supplements
- Superfood & Functional Supplements
- Prebiotics & Probiotics
- Snacking/Plant-based Protein Snacks
- Protein Bars
- Other Snack Type
- Other Product Type
By Supplement Form
- Powders
- Capsules & Tablets
- Gummies & Chewables
- Liquids & Tinctures
- Softgels
- Others
By End Use Application
- Sports & Performance Nutrition
- General Health & Wellness
- Weight Management
- Beauty & Skin Health
- Other Application
By Distribution Channel
- Online RetailFastest Growing
- Supermarkets & Hypermarkets32.78%
- Pharmacies & Drugstores
- Others
Driver Analysis
Healthy-Ageing Consumption — +0.6 Percentage Points
Population ageing expands the prospective customer base for plant-derived nutrition, but the commercial transmission depends on product relevance, affordability and repeat purchasing rather than demographic growth alone. WHO projects that the population aged 60 years and above will increase from 1 billion in 2020 to 1.4 billion in 2030, when approximately one in six people worldwide will belong to that age group; this represents a 40% increase over the decade, not a measured plant-based supplement sales growth rate.
In the constructed commercial case, a defined customer population of 10 million older adults with 5% product penetration and $120 annual expenditure produces $60 million of annual supplement revenue; raising penetration to 6% generates an additional $12 million without requiring higher prices or more spending per customer. At an assumed 35% contribution margin after product and variable distribution costs, that increment contributes $4.2 million before additional marketing and fixed overhead.
The +0.6-point sensitivity assumes 25% of counterfactual terminal revenue is ageing-sensitive and that customer participation and relevant product mix increase that exposure by approximately 11.6%, yielding 2.9% additional market revenue. Strategic value capture favors understandable daily regimens and appropriately substantiated products rather than broad anti-ageing promises; ageing itself does not establish that botanical products prevent cognitive decline, cardiovascular disease or frailty. To limit overlap, this attribution covers demographic participation, while improvements in botanical standardization and plant-protein functionality are assigned separately.
Drivers Impact Analysis
| Driver | (~) % Impact on CAGR Forecast | Geographic Relevance | Impact Timeline |
|---|---|---|---|
| Healthy-ageing consumption | +0.6 pp | Japan, China, EU, US | Long term (≥ 4 years) |
| Stress and sleep formulations | +0.6 pp | US, UK, Germany, India | Medium term (2–4 years) |
| Plant-protein format expansion | +0.6 pp | US, Canada, EU, India | Medium term (2–4 years) |
| Animal-free formulation access | +0.4 pp | US, UK, Germany, India, Indonesia | Medium term (2–4 years) |
| Standardized botanical portfolios | +0.5 pp | US, EU, India, Japan | Medium term (2–4 years) |
| Manufacturing-enabled affordability | +0.4 pp | Canada, US, EU, India | Medium term (2–4 years) |
Restraint Analysis
Botanical Claim Restrictions — −0.5 Percentage Points
Restrictions on botanical health claims directly limit the commercial propositions that brands can advertise, constraining customer acquisition and premium pricing even where the underlying supplement can legally remain on sale. On April 30, 2025, the Court of Justice of the European Union ruled in Case C-386/23, Novel Nutriology, that the disputed botanical claims concerning psychological or behavioral functions could not be used pending authorization unless covered by the applicable transitional provisions; the judgment also addressed general health references that lack an accompanying authorized specific claim.
This is not a blanket prohibition on botanical supplements or every botanical claim, but it materially narrows the freedom to promote affected mood, stress and well-being products. In a constructed brand case generating €10 million in annual revenue, a 10% decline in sales following removal of the principal advertised benefit reduces revenue by €1 million; at a 40% contribution margin, €400,000 of contribution is lost before legal review, packaging changes or replacement campaigns. If 200,000 cartons additionally require a €0.25 label correction, another €50,000 is incurred, although that compliance expense is not itself counted as market-revenue loss.
The −0.5-point sensitivity assumes 20% of terminal counterfactual revenue is exposed to restricted claim positioning and suffers an 11.5% realization shortfall, equivalent to approximately 2.3% market-wide terminal revenue erosion. Strategically, affected suppliers must distinguish authorized, transitional and impermissible claims at product level; maintaining product availability without a legally usable benefit proposition may preserve existing sales while weakening the economics of acquiring new customers.
Restraint Impact Analysis
| Restraint | (~) % Impact on CAGR Forecast | Geographic Relevance | Impact Timeline |
|---|---|---|---|
| Botanical claim restrictions | −0.5 pp | EU; exporters serving EU | Long term (≥ 4 years) |
| Preparation-specific evidence gaps | −0.4 pp | US, EU, UK, Japan | Long term (≥ 4 years) |
| Safety and interaction exclusions | −0.3 pp | US, EU, UK, India | Medium term (2–4 years) |
| Premium-price demand resistance | −0.4 pp | US, EU, India, Brazil | Medium term (2–4 years) |
| Qualified-material rejection losses | −0.4 pp | India, China; US, EU buyers | Medium term (2–4 years) |
| Novel-extract market-entry costs | −0.3 pp | US; exporters serving US | Long term (≥ 4 years) |
Opportunity Analysis
Low-Volume Protein Regimens — +0.5 Percentage Points
The opportunity is to develop compact, easy-to-consume plant-protein supplement regimens for customers poorly served by conventional large-volume shakes, rather than simply participate in existing plant-protein demand. Technical feasibility is supported by commercially available hydrolyzed pea protein: Roquette describes NUTRALYS H85 as highly soluble across acidic and neutral conditions, low in viscosity and suitable for powdered beverages, sports nutrition, weight management and senior nutrition, with a stated minimum protein content of 80% on dry solids.
The proposed commercial white space remains a hypothesis requiring customer research: low viscosity can support a smaller serving, but does not by itself demonstrate superior tolerability, clinical benefit or adherence. In the constructed formulation case, delivering 20 g of protein requires approximately 25 g of an 80%-protein ingredient on a dry-solids basis; a 30-serving regimen therefore contains about 750 g of protein ingredient. At an assumed $6 per kilogram, protein-input cost is $4.50 per regimen; adding $6.50 for other ingredients, manufacture, packaging and quality assurance produces an $11 cost of goods against $25 net brand revenue, or a 56% manufacturing gross margin before marketing and overhead.
Serving 100,000 customers for six regimens annually generates $15 million of net annual revenue, but only new-category purchases and premiums above displaced conventional products count as market upside. The +0.5-point sensitivity requires approximately 2.4% incremental terminal market revenue. Execution should prioritize sensory and gastrointestinal testing, realistic protein delivery and channel validation; this is a new use-case and serving-format strategy, not permission to market a supplement as treatment for frailty or medication-related adverse effects.
Opportunity Impact Analysis
| Opportunity | (~) % Potential CAGR Upside | Geographic Relevance | Execution Window |
|---|---|---|---|
| Low-volume protein regimens | +0.5 pp | US, UK, Germany, Japan | Medium term (2–4 years) |
| Condition-specific botanical portfolios | +0.5 pp | US, UK, India, Japan | Long term (≥ 4 years) |
| Verified-origin premium brands | +0.4 pp | US, EU, UK, Japan | Medium term (2–4 years) |
| Affordable single-dose distribution | +0.4 pp | India, Indonesia, Brazil | Medium term (2–4 years) |
| Modular botanical replenishment | +0.3 pp | US, UK, Germany, South Korea | Medium term (2–4 years) |
| Capability-led acquisition platforms | +0.3 pp | US, Germany, India, Singapore | Short term (≤ 2 years) |
Challenges Analysis
Cross-Laboratory Method Alignment — −0.4 Percentage Points
The operational vulnerability is inconsistent interpretation of botanical specifications across ingredient suppliers, independent laboratories and finished-product manufacturers, even when material remains legally saleable. US dietary-supplement rules require appropriate, scientifically valid methods and at least one identity test or examination for dietary-ingredient components unless an exemption is granted; they distinguish this obligation from conditional reliance on supplier certificates for certain other specifications.
A 2026 review of ashwagandha also identifies materially different constituent profiles between roots and leaves, illustrating why a plant name or aggregate marker value cannot replace preparation-specific authentication. In a constructed supplier network receiving 1,200 lots annually, an 8% disputed-result rate creates 96 investigations; two additional analyses at $350 each produce $67,200 in annual retesting costs before sampling and staff time. If those lots average two tonnes valued at $40 per kilogram and experience seven additional release days, the annual incremental inventory burden is approximately $147,000 on an average-balance basis, costing roughly $17,700 at a 12% financing rate.
These assumptions describe measurement disagreements, not actual adulteration or a measured industry failure rate. The −0.4-point sensitivity assumes 20% of terminal opportunity revenue is method-sensitive and suffers a 9.5% realization shortfall, producing approximately 1.9% market-wide terminal friction through slower customer qualification and delayed launches. Mitigation requires agreed sample preparation, reference standards, method-transfer protocols and interlaboratory comparisons; additional laboratory expense alone is not counted as lost market revenue.
Challenges Impact Analysis
| Challenge | (~) % CAGR Friction Drag | Geographic Relevance | Mitigation Horizon |
|---|---|---|---|
| Cross-Laboratory Method Alignment | −0.4 pp | US, EU, India, China | Medium term (2–4 years) |
| Extraction Process Reproducibility | −0.4 pp | India, China, Germany, US | Long term (≥ 4 years) |
| Multi-Tier Traceability Integration | −0.3 pp | India–EU, China–EU, Asia–US | Medium term (2–4 years) |
| Transit and Inventory Synchronization | −0.3 pp | India–EU, China–EU, Asia–US | Medium term (2–4 years) |
| Cross-Functional Technical Staffing | −0.2 pp | US, Germany, India, China | Long term (≥ 4 years) |
| Small-Batch Portfolio Scheduling | −0.2 pp | US, UK, Germany, Singapore | Medium term (2–4 years) |
Geopolitical Impact Analysis
Geopolitical Impact of Ongoing Wars on the Plant-based Supplements Market
The ongoing conflicts in the Middle East and between Russia and Ukraine are creating pressure on global supply chains, energy prices, agricultural commodities, and international shipping. These developments affect the plant-based supplements market because manufacturers depend on crops such as peas, soybeans, and other plant ingredients, along with packaging materials and international transport.
According to the World Bank’s October 2026 Commodity Markets Outlook, global commodity prices are projected to rise 23% in 2026, while energy prices are expected to increase 32%. Food commodity prices are forecast to rise by approximately 10% in 2026 and a further 7% in 2027.
These cost pressures can increase expenses for ingredient processing, manufacturing, warehousing, and distribution. Disruptions to shipping routes through the Red Sea and the Black Sea may also extend delivery times and raise freight and insurance costs. As a result, supplement producers could face higher production costs, delayed raw material supplies, and pressure on profit margins. Smaller brands may find it harder to absorb these increases without raising retail prices.
However, the actual impact varies by ingredient origin, supplier contracts, and transport route. In response, manufacturers may diversify suppliers, increase inventory buffers, and develop regional sourcing arrangements. Over the longer term, reliable procurement and efficient production will be important for maintaining product availability and competitive pricing.
Regional Insights
North America: Dominating Region
North America held a dominant position in the plant-based supplements market, accounting for 32.12% share, with a market value of USD 6.9 billion, according to the supplied market figures. Regional demand is supported by consumer awareness of preventive nutrition, established dietary supplement brands, broad retail distribution, and the availability of specialised plant-based formulations. The United States is an important contributor to regional demand.
According to the U.S. Centers for Disease Control and Prevention, 60.2% of adults aged 20 and older used at least one dietary supplement during August 2021 to August 2023. This high level of supplement use supports the broader consumer base for products such as plant-based vitamins, minerals, botanical extracts, and protein supplements, although the statistic covers all dietary supplements rather than plant-based products alone.
Asia-Pacific represents a promising growth opportunity for plant-based supplements, supported by increasing health awareness, expanding urban populations, wider access to e-commerce, and growing interest in plant-derived nutrition. Demand is expected to benefit from products targeting everyday wellness, sports nutrition, and nutritional deficiencies. Government trade data from Agriculture and Agri-Food Canada shows that Japan imported USD 1.19 billion worth of plant-based and protein ingredients in 2023, compared with USD 748.2 million in 2019, highlighting the importance of regional ingredient trade.
Key Regions and Countries Insights
- North America
- US
- Canada
- Europe
- Germany
- France
- The UK
- Spain
- Italy
- Rest of Europe
- Asia Pacific
- China
- Japan
- South Korea
- India
- Australia
- Rest of APAC
- Latin America
- Brazil
- Mexico
- Rest of Latin America
- Middle East & Africa
- GCC
- South Africa
- Rest of MEA
Key Players Analysis
Archer Daniels Midland Company supports the plant-based supplements market through plant proteins, botanical extracts, probiotics, prebiotics, and other nutritional ingredients. In 2025, ADM reported total revenue of USD 80.269 billion, while its Nutrition segment generated USD 7.512 billion. Its broad agricultural sourcing and ingredient-processing network supports supplement manufacturers seeking reliable raw materials and specialised formulations. ADM also focuses on product innovation and human nutrition solutions, helping customers develop products for health and wellness applications.
Glanbia plc participates in the plant-based supplements market through its nutrition ingredient capabilities and established sports nutrition brands. In 2025, the company reported revenue of USD 3.9 billion, compared with USD 3.8 billion in 2024, representing reported growth of 2.8%. Its Performance Nutrition segment generated USD 1.801 billion in revenue during 2025 and serves consumers seeking sports nutrition and active-lifestyle products. Glanbia’s product development, international distribution, and nutrition expertise support its position in the wider supplement industry.
Herbalife Ltd. offers nutrition and wellness products through a global direct-selling network, including protein-based nutritional shakes, dietary supplements, and products designed to support healthy lifestyles. In 2025, the company reported total net sales of approximately USD 5.038 billion, compared with USD 4.993 billion in 2024, an increase of around 0.9%. Its distribution model enables direct engagement with customers and supports the sale of nutrition products across multiple markets. Herbalife’s broad portfolio positions it within the wider nutritional supplements industry, although its reported sales do not represent plant-based supplements alone.
Top Key Players Outlook
- Archer Daniels Midland Company
- Glanbia plc
- Herbalife Nutrition Ltd.
- Nature Bounty Co.
- NOW Foods
- Garden of Life LLC
- Danone S.A.
- Vital Amine, Inc
- NOW Health Group Inc.
- Hormel Foods Corporation
- MusclePharm Corporation
- Other Key Players
Recent Developments
- Nestlé announced in September 2026 an agreement to sell its mainstream vitamins, minerals, and supplements business, including Nature’s Bounty, to Yellow Wood Partners for USD 1.0 billion. The transaction is expected to close by the first half of 2027, subject to regulatory approvals. The portfolio generated USD 1.2 billion in sales in 2025.
- In April 2026, NOW partnered with rePurpose Global and committed to recovering more than 600,000 pounds of ocean-bound plastic by the end of 2028, supporting more sustainable packaging and waste management.
Report Scope
| Report Features | Description |
|---|---|
| Market Value (2025) | USD 21.6 Bn |
| Forecast Revenue (2035) | USD 50.9 Bn |
| CAGR (2026-2035) | 9.0% |
| Base Year for Estimation | 2025 |
| Historic Period | 2020-2024 |
| Forecast Period | 2026-2035 |
| Report Coverage | Revenue Forecast, Market Dynamics, Competitive Landscape, Recent Developments |
| Segments Covered | By Product Type (Protein Supplements, Vitamin & Mineral Supplements, Superfood & Functional Supplements, Prebiotics & Probiotics, Snacking/Plant-based Protein Snacks, Other Product Type), By Supplement Form (Powders, Capsules & Tablets, Gummies & Chewables, Liquids & Tinctures, Softgels, Others), By End Use Application (Sports & Performance Nutrition, General Health & Wellness, Weight Management, Beauty & Skin Health, Other Application), By Distribution Channel (Online RetailFastest Growing, Supermarkets & Hypermarkets32.78%, Pharmacies & Drugstores, Others) |
| Regional Analysis | North America – US, Canada; Europe – Germany, France, The UK, Spain, Italy, Rest of Europe; Asia Pacific – China, Japan, South Korea, India, Australia, Singapore, Rest of APAC; Latin America – Brazil, Mexico, Rest of Latin America; Middle East & Africa – GCC, South Africa, Rest of MEA |
| Competitive Landscape | Archer Daniels Midland Company, Glanbia plc, Herbalife Nutrition Ltd., Nature Bounty Co., NOW Foods, Garden of Life LLC, Danone S.A., Vital Amine, Inc, NOW Health Group Inc., Hormel Foods Corporation, MusclePharm Corporation, Other Key Players |
| Customization Scope | Customization for segments, region/country-level will be provided. Moreover, additional customization can be done based on the requirements. |
| Purchase Options | We have three licenses to opt for: Single User License, Multi-User License (Up to 5 Users), Corporate Use License (Unlimited User and Printable PDF) |








