Report Overview
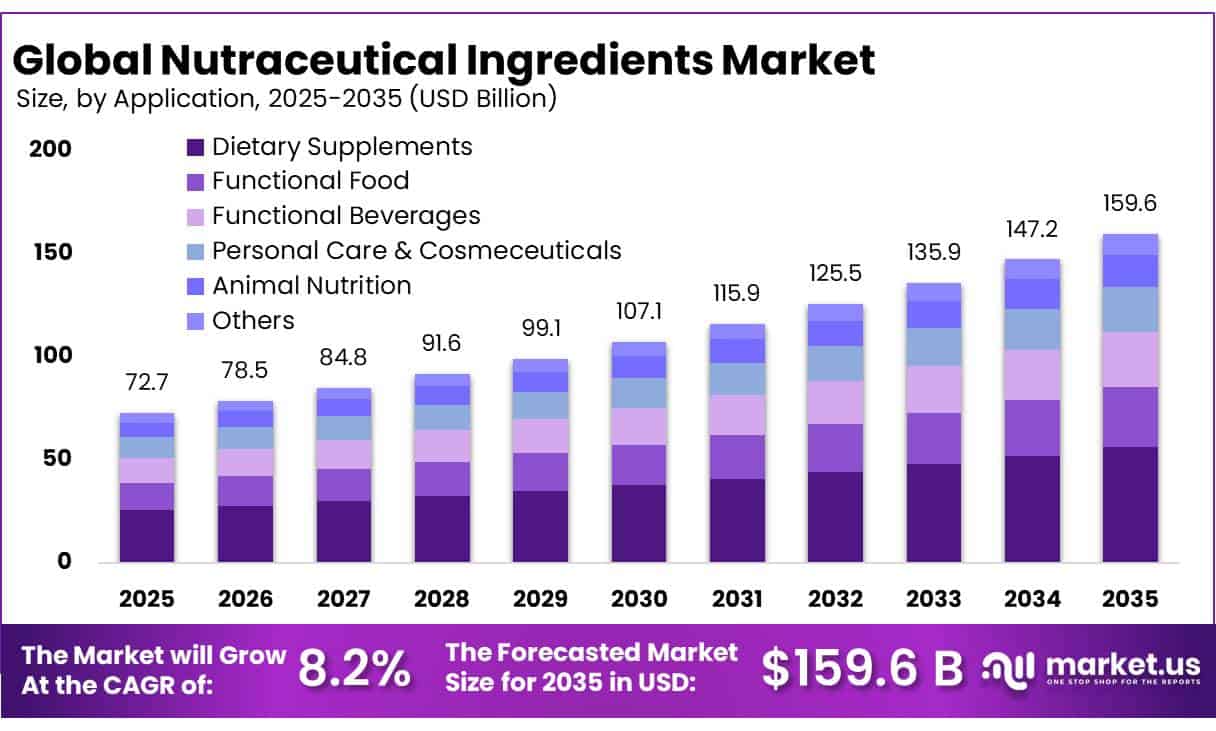
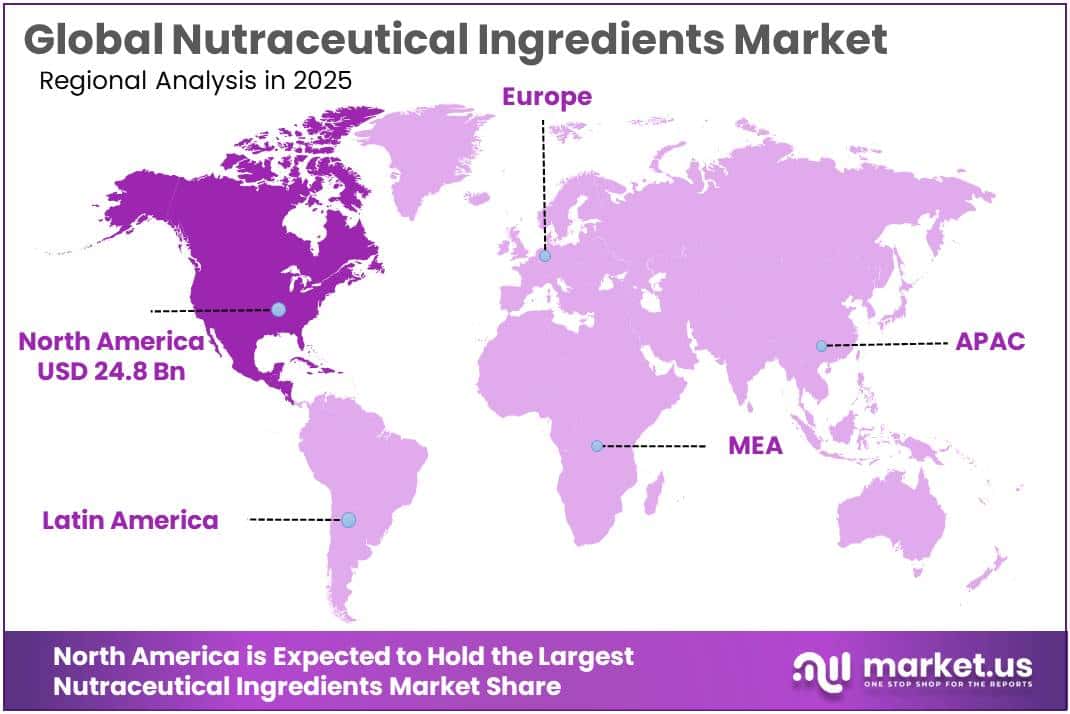
The Global Nutraceutical Ingredients Market size is expected to be worth around USD 159.6 Billion by 2035, from USD 72.7 Billion in 2025, growing at a CAGR of 8.2% during the forecast period from 2026 to 2035. In 2025, North America held a dominant market position, capturing more than a 34.21% share, holding USD 24.8 Billion revenue.
The nutraceutical ingredients industry plays an important role in the development of dietary supplements, functional foods, fortified beverages, sports nutrition products, and products designed to support specific nutritional needs. These ingredients include vitamins, minerals, amino acids, proteins, probiotics, prebiotics, omega-3 fatty acids, botanical extracts, enzymes, and antioxidants. Their demand is supported by growing consumer interest in preventive nutrition, healthy ageing, digestive health, immunity, and active lifestyles.
- According to the United States National Institutes of Health (NIH), the dietary supplement category covers a broad range of ingredients, including vitamins, minerals, herbs, botanicals, amino acids, and other bioactive substances. This broad product base creates opportunities for ingredient manufacturers to supply food, beverage, healthcare, and supplement companies.
Manufacturers are investing in ingredient purity, standardized botanical extracts, improved bioavailability, and stable formulations that can be incorporated into capsules, powders, gummies, beverages, and fortified foods. According to the NIH Office of Dietary Supplements, the United States market had more than 100,000 dietary supplement products containing significant amounts of nutrients and often other bioactive ingredients, highlighting the complexity of ingredient composition and quality assessment.
Demand is primarily driven by increasing consumer awareness of nutritional deficiencies, preventive healthcare, healthy ageing, and personalized nutrition. Ingredient suppliers are responding by developing targeted formulations for gut health, muscle recovery, cognitive performance, bone health, and metabolic wellness. Plant-derived ingredients, probiotic cultures, prebiotic fibres, and bioactive compounds are gaining commercial importance as manufacturers seek differentiated products.
The United States Department of Agriculture’s Economic Research Service reported that United States organic food sales reached an estimated USD 70.1 billion in 2025, based on Organic Trade Association data. Although this figure represents organic food sales rather than nutraceutical ingredients, it highlights the commercial relevance of products positioned around organic sourcing and related consumer preferences.
Regulatory compliance and product safety remain central to industrial operations. In the United States, the Food and Drug Administration (FDA) requires manufacturers or distributors introducing certain new dietary ingredients to submit a notification at least 75 days before marketing, together with information supporting the ingredient’s expected safety under its intended conditions of use. In October 2026, the FDA issued updated final guidance on the identity and safety information that should be included in new dietary ingredient notifications.
These requirements increase the importance of ingredient traceability, analytical testing, documented specifications, and reliable manufacturing processes. In the European Union, Regulation (EU) 2015/2283 establishes the framework for novel foods, with safety evaluation and authorization requirements applying to qualifying ingredients. These regulatory frameworks influence product development timelines and market-entry decisions.
Ingredient suppliers that combine scientific validation with sustainable sourcing, transparent documentation, and scalable production are likely to strengthen their competitive position. The NIH’s 2025–2029 Strategic Plan identifies research into dietary supplement composition, quality, stability, safety, and efficacy as important priorities, reinforcing the role of scientific evidence in future product development.
Key Takeaways
- Nutraceutical Ingredients Market size is expected to be worth around USD 159.6 Billion by 2035, from USD 72.7 Billion in 2025, growing at a CAGR of 8.2%.
- Probiotics held a dominant market position, capturing more than a 23.12% share.
- Dietary Supplements held a dominant market position, capturing more than a 35.23% share.
- Dry Form held a dominant market position, capturing more than a 39.78% share.
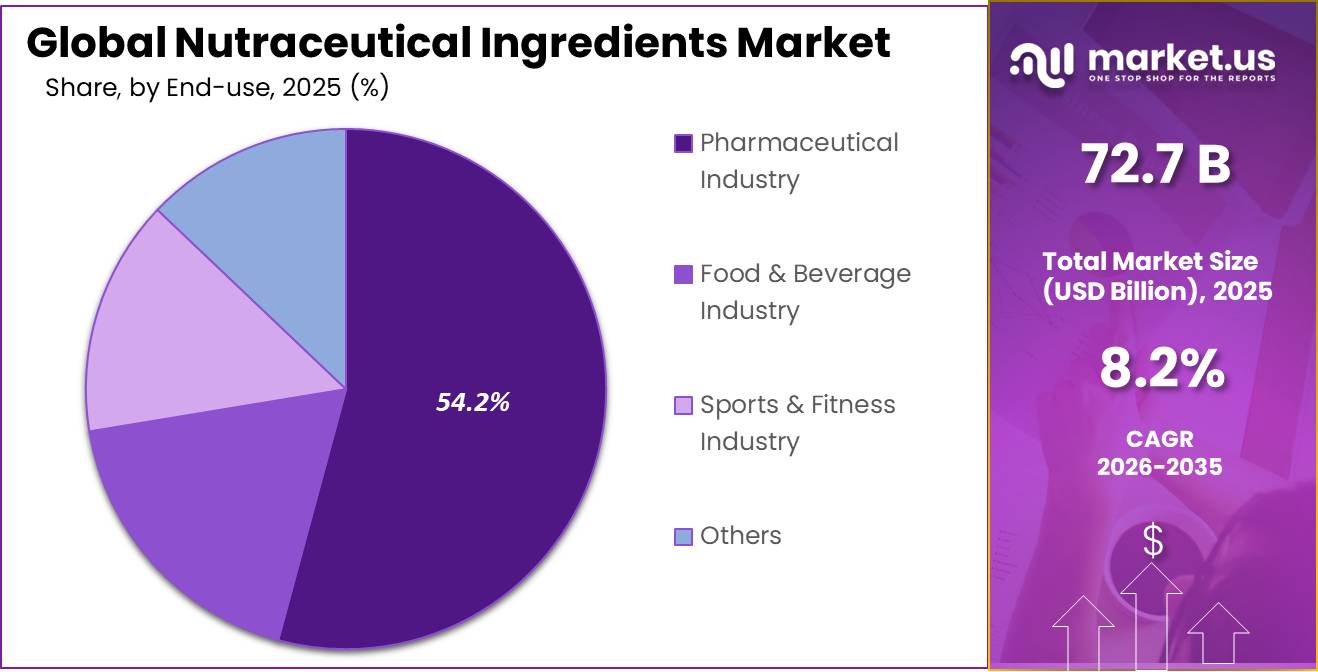
- Pharmaceutical Industry held a dominant market position, capturing more than a 54.23% share.
- North America held a dominant position in the nutraceutical ingredients market in 2025, accounting for 34.21% share, with a reported market value of USD 24.8 billion.
By Product Analysis
Probiotics lead the market due to their growing use in digestive health and nutritional products.
In 2025, “Probiotics” held a dominant market position, capturing more than a 23.12% share of the nutraceutical ingredients market by product. Probiotics are live microorganisms used in dietary supplements and selected food products to support specific health benefits.
Their demand is supported by consumer interest in digestive health and the growing use of probiotic cultures in capsules, powders, fermented foods, and functional beverages. Ingredient manufacturers focus on strain identification, product stability, quality control, and maintaining the viability of microorganisms throughout storage. The United States National Institutes of Health explains the role of probiotics and the importance of understanding their health effects, although benefits depend on the specific strain and application.
Prebiotics are ingredients that help support beneficial gut microorganisms and are commonly incorporated into dietary supplements, fortified foods, and functional beverages. In 2025, demand for prebiotic ingredients was supported by increasing interest in gut health, fibre-enriched nutrition, and products designed to support digestive function. Manufacturers use ingredients such as inulin and selected non-digestible carbohydrates to develop formulations for different food and supplement applications.
The United States Food and Drug Administration (FDA) identifies specific isolated or synthetic non-digestible carbohydrates that qualify as dietary fibre when they meet its regulatory definition. This provides a government-backed reference for ingredient selection and product labelling. The FDA’s guidance also highlights the importance of scientific evidence when establishing the physiological benefits of added fibres.
By Application Analysis
Dietary supplements lead the market through their broad use in everyday nutrition and targeted health support.
In 2025, “Dietary Supplements” held a dominant market position, capturing more than a 35.23% share of the nutraceutical ingredients market by application. This segment includes vitamins, minerals, probiotics, amino acids, botanical extracts, and other ingredients used in capsules, tablets, powders, and liquid formulations.
Demand is supported by consumer interest in preventive nutrition, nutrient intake, and healthy ageing. Manufacturers focus on ingredient quality, formulation stability, and clear product labelling to meet consumer expectations and regulatory requirements. The United States National Institutes of Health (NIH) identifies vitamins, minerals, herbs, botanicals, amino acids, and other substances as common categories of dietary supplements. This broad range of products supports continued demand for specialized nutraceutical ingredients.
For additional government-backed evidence, the United States Centers for Disease Control and Prevention (CDC) reported in May 2026 that 60.2% of adults aged 20 and older used dietary supplements during August 2021 to August 2023. The rate increased with age, reaching 75.9% among adults aged 60 and older. These findings provide evidence of established consumer use and demand for supplement ingredients, although they do not measure the market share of dietary supplements within the nutraceutical ingredients industry.
By Form Analysis
Dry-form ingredients lead through their convenient storage, longer shelf stability, and flexible use in supplement formulations.
In 2025, “Dry Form” held a dominant market position, capturing more than a 39.78% share of the nutraceutical ingredients market by form. Dry ingredients are widely used in powders, tablets, capsules, sachets, and fortified food products. Their practical handling, ease of transportation, and suitability for blending with other ingredients make them useful for manufacturers seeking consistent formulations.
Liquid Form is used in nutraceutical products where ease of consumption, rapid incorporation into formulations, and flexible dosing are important. These ingredients are suitable for liquid dietary supplements, nutritional drinks, emulsions, and selected vitamin formulations. Manufacturers focus on ingredient solubility, stability, taste, preservation, and packaging to maintain product quality throughout its shelf life.
Government data support the wider demand for dietary supplements, although they do not isolate liquid products. According to the United States Centers for Disease Control and Prevention (CDC), 60.2% of adults aged 20 and older used dietary supplements during August 2021 to August 2023. This provides evidence of established supplement use, but it should not be interpreted as the market share or adoption rate of liquid-form ingredients. No verified government statistic establishes the 2025 or 2026 market share of liquid-form nutraceutical ingredients.
By End Use Industry Analysis
The pharmaceutical industry leads through its demand for specialized ingredients used in nutritional supplements and health-focused formulations.
In 2025, “Pharmaceutical Industry” held a dominant market position, capturing more than a 54.23% share of the nutraceutical ingredients market by end-use industry. Pharmaceutical companies use vitamins, minerals, probiotics, amino acids, botanical extracts, and other bioactive ingredients in products designed to support nutritional needs and general wellness.
Demand is supported by growing interest in preventive healthcare, healthy ageing, and formulations developed for specific consumer groups. Ingredient quality, purity, stability, and consistent composition remain important when pharmaceutical manufacturers select suppliers. Companies also need reliable testing and documentation to meet applicable manufacturing and product safety requirements.
Food & Beverage Industry uses nutraceutical ingredients to improve the nutritional value and functionality of products such as fortified cereals, dairy products, nutritional beverages, protein drinks, and functional foods. In 2025, demand was supported by manufacturers seeking to meet consumer interest in convenient nutrition, digestive health, and products enriched with vitamins, minerals, fibres, and probiotics.
According to the United States Department of Agriculture’s Economic Research Service, food and beverage manufacturing establishments accounted for 16.8% of sales and 15.4% of employees across all United States manufacturing establishments in 2021. These figures demonstrate the industry’s established manufacturing role, although they do not measure nutraceutical ingredient sales specifically.
Key Market Segments
By Product
- Probiotics
- Lactobacilli
- Bifidobacterium
- Bacillus
- Streptococcus
- Saccharomyces
- Others
- Prebiotics
- FOS
- Inulin
- GOS
- MOS
- Others
- Vitamins
- Vitamin A
- Vitamin C
- Vitamin D
- Vitamin E
- Vitamin K
- Vitamin B-complex
- Amino acids
- Lysine
- Methionine
- Threonine
- Tryptophan
- Carotenoids
- Beta-carotene
- Lutein
- Astaxanthin
- Canthaxanthin
- Lycopene
- Others
- Phytochemicals & plant extracts
- Phytosterols
- Flavonoids
- Polyphenols
- Others
- Protein
- Animal proteins
- EPA/DHA
- Minerals
- Fiber & carbohydrates
By Application
- Functional Food
- Functional Beverages
- Dietary Supplements
- Personal Care & Cosmeceuticals
- Animal Nutrition
- Others
By Form
- Dry Form
- Liquid Form
- Semi-solid Form
By End Use Industry
- Pharmaceutical Industry
- Food & Beverage Industry
- Sports & Fitness Industry
- Others
Driver Analysis
Preventive Nutrition Demand — +0.7 Percentage Points
Preventive nutrition is a continuing demand driver because large, persistent health burdens support recurring purchases of vitamins, minerals, fibers, proteins and botanicals rather than requiring a new category to be invented. WHO reports that in 2024, 2.6 billion adults were overweight, including 940 million living with obesity, and that 1.1 billion people globally were living with obesity; it also identifies 34 frontrunner countries representing 1.3 billion people in its obesity acceleration effort.
The commercial mechanism is not that every affected individual buys an ingredient, but that food and supplement manufacturers translate broad health priorities into reformulated products; in a modeled portfolio, 1 million annual consumers each purchasing $40 of relevant products generate $40 million of retail value, while a 2% increase in participation and a 5% increase in average spend would add $1.4 million of retail value before ingredient-share allocation.
If ingredients represent 8% of finished-product revenue, that translates to approximately $112,000 of incremental ingredient revenue, illustrating why consumer-level demand must be converted through formulation share and channel economics rather than counted directly as ingredient sales. The +0.7-point sensitivity assumes that preventive-nutrition demand raises baseline terminal market revenue by approximately 3.9%, net of substitution between existing products and allowance for price-sensitive markets.
The strategic implication is that suppliers increasingly compete on differentiated actives, clinical support and customer application development, rather than commodity ingredient price alone; however, this driver reflects already active health demand and does not assume that future GLP-1 adoption or other medical interventions will automatically increase ingredient purchases.
Drivers Impact Analysis
| Driver | (~) % Impact on CAGR | Geographic Relevance | Impact Timeline |
|---|---|---|---|
| Preventive nutrition demand | +0.7 pp | US, EU, Japan, China, India | Long term (≥ 4 years) |
| Weight-management ingredient demand | +0.6 pp | US, EU, UK, Australia | Medium term (2–4 years) |
| Evidence-backed claims | +0.5 pp | EU, US, Japan, South Korea | Medium term (2–4 years) |
| Functional-food penetration | +0.5 pp | India, China, ASEAN, Brazil | Medium term (2–4 years) |
| Personalized nutrition platforms | +0.4 pp | US, UK, Germany, South Korea | Medium term (2–4 years) |
| Regulatory-enabled ingredient expansion | +0.5 pp | US, EU, Japan | Long term (≥ 4 years) |
Restraint Analysis
Consumer Price Sensitivity — −0.5 Percentage Points
The principal restraint is the widening gap between ingredient-led product prices and household affordability, which can cause consumers to trade down, reduce dosage or abandon discretionary wellness purchases even when health motivation remains intact. USDA’s October 2026 Food Price Outlook forecasts all-food prices to rise 2.8% in 2026, within a 2.6–3.1% interval, after a 3.0% average annual increase during 2006–2025; food-at-home prices are forecast to increase 2.3%, while the September 2026 all-food CPI was already 2.5% above September 2025.
In a modeled functional-food case, a $3.00 product containing $0.30 of ingredient cost faces a $0.15 price increase if an ingredient premium adds $0.10 and manufacturer margin requirements add $0.05; at a price elasticity of −1.5, that 5% price increase reduces unit demand by 7.5%, from 1.0 million to 0.925 million units, cutting ingredient purchases by 7.5% before reformulation. If the ingredient represents 10% of product revenue, the revenue loss is proportionate, but the supplier’s exposure is larger if the ingredient is the first component removed during value engineering.
The −0.5-point sensitivity assumes 35% of terminal market revenue is exposed to discretionary consumer purchases and that affordability pressure reduces realization within that exposure by 6.9%, producing approximately 2.4% aggregate terminal revenue loss. The strategic consequence is pressure toward lower-cost formats, smaller pack sizes, fewer premium actives and value-engineered formulations; this is an ongoing affordability constraint rather than a forecast that consumers stop buying nutrition products.
Restraint Impact Analysis
| Restraint | (~) % Impact on CAGR Forecast | Geographic Relevance | Impact Timeline |
|---|---|---|---|
| Consumer price sensitivity | −0.5 pp | US, EU, India, Brazil | Medium term (2–4 years) |
| Evidence and claims burden | −0.4 pp | EU, US, Japan, South Korea | Long term (≥ 4 years) |
| Novel-ingredient approval friction | −0.4 pp | US, EU, China | Long term (≥ 4 years) |
| Quality and adulteration risk | −0.4 pp | US, EU, India, China | Medium term (2–4 years) |
| GLP-1 demand reallocation | −0.4 pp | US, EU, UK, Australia | Medium term (2–4 years) |
| Botanical supply variability | −0.4 pp | India, China, EU, US | Medium term (2–4 years) |
Opportunity Analysis
Clinician-Aligned Nutrition Portfolios — +0.6 Percentage Points
The white space is to develop ingredient portfolios specifically designed for people using or transitioning from obesity pharmacotherapy, rather than relying on the existing broad wellness demand already counted as a driver. WHO’s December 2025 guideline recommends GLP-1-based therapies for eligible adults with obesity as part of comprehensive care that includes behavioral support, healthy diet, physical activity and follow-up, while explicitly stating that these medicines should not replace other means of weight control.
The untapped commercial mechanism is formulation for nutritional adequacy and adherence during reduced food intake: a 30 g daily protein target requires 37.5 g of an 80%-protein ingredient, so a product serving 100,000 users daily would require 3.75 tonnes of protein ingredient per day, or approximately 1,369 tonnes annually before blending, losses or alternative protein sources. At an assumed $6-per-kilogram ingredient price, that specific protein component represents approximately $8.2 million of annual ingredient revenue; adding fiber, micronutrients and flavor systems would increase the addressable basket but must not be counted as wholly incremental if those ingredients already serve other customers.
The +0.6-point sensitivity assumes that clinician-aligned portfolios and associated replenishment formats create approximately 2.9% additional terminal market revenue, net of substitution from existing protein and supplement sales. The strategic pivot is toward evidence-informed product design, healthcare-professional education and pharmacy or telehealth channels; it is not an assumption that GLP-1 users automatically buy supplements, nor does it treat medical treatment as a substitute for nutritional support.
Opportunity Impact Analysis
| Opportunity | (~) % Potential CAGR Upside | Geographic Relevance | Execution Window |
|---|---|---|---|
| Clinician-aligned nutrition portfolios | +0.6 pp | US, EU, UK, Australia | Medium term (2–4 years) |
| Claim-qualified ingredient platforms | +0.5 pp | EU, US, Japan, South Korea | Long term (≥ 4 years) |
| Medical-food adjacent formats | +0.4 pp | US, EU, Japan | Long term (≥ 4 years) |
| Traceable botanical supply systems | +0.4 pp | India, China, EU, US | Medium term (2–4 years) |
| Personalized replenishment models | +0.3 pp | US, UK, Germany, South Korea | Medium term (2–4 years) |
| Capability-led acquisition platforms | +0.3 pp | US, Germany, Switzerland, Singapore | Short term (≤ 2 years) |
Challenges Analysis
Ingredient Identity Assurance — −0.4 Percentage Points
The continuing operational challenge is verifying that every incoming ingredient lot is what it claims to be, rather than assuming that supplier documentation alone establishes identity. FDA’s dietary-supplement CGMP rule requires at least one appropriate test or examination to verify the identity of each dietary-ingredient component before use, and FDA’s inspection guidance identifies failures in component specifications, identity testing and scientifically valid methods as CGMP concerns; this is an ongoing quality-control requirement, not evidence that every supplier is non-compliant.
In a modeled supplier handling 2,000 ingredient lots annually, an assumed 5% exception rate creates 100 investigations; at $500 per investigation, direct retesting expense is $50,000 before sample logistics, technical-service time or delayed release. More consequentially, if each affected lot contains 10 tonnes valued at $8,000 per tonne and remains on hold for seven days, $800,000 of inventory is temporarily unavailable; at a 12% annual financing rate, that adds approximately $1,846 of carrying cost, while the larger strategic burden is delayed customer qualification and lost reformulation windows.
The −0.4-point sensitivity assumes that 25% of opportunity-enabled terminal revenue is identity-sensitive and that unresolved assurance friction reduces realization within that exposure by 8%, producing approximately 2.0% aggregate terminal revenue loss. Mitigation requires validated identity methods, retained reference materials, supplier qualification, batch-level records and periodic method verification; current sales continue throughout, but reliable identity assurance becomes essential to sustaining premium and clinical-format adoption.
Challenges Impact Analysis
| Challenge | (~) % CAGR Friction | Geographic Relevance | Mitigation Horizon |
|---|---|---|---|
| Ingredient Identity Assurance | −0.4 pp | US, EU, India, China | Medium term (2–4 years) |
| Botanical Batch Standardization | −0.4 pp | India, China, EU, US | Long term (≥ 4 years) |
| Clinical Evidence Translation | −0.3 pp | EU, US, Japan, South Korea | Long term (≥ 4 years) |
| International Ingredient Logistics | −0.3 pp | India–EU, China–EU, Asia–US | Medium term (2–4 years) |
| Cross-Regulatory Portfolio Complexity | −0.3 pp | US, EU, Japan, China | Long term (≥ 4 years) |
| Personalization Data Governance | −0.2 pp | US, UK, Germany, South Korea | Medium term (2–4 years) |
Geopolitical Impact Analysis
Impact of the Ongoing Middle East Conflict on the Nutraceutical Ingredients Market
The ongoing Middle East conflict in 2026 is putting pressure on the nutraceutical ingredients market through higher energy costs, shipping delays, and uncertainty in global supply chains. Nutraceutical manufacturers depend on international suppliers for vitamins, amino acids, botanical extracts, minerals, and specialized ingredients.
Disruptions to major shipping routes can increase freight charges, insurance premiums, and delivery times, raising procurement and production costs. According to the United Nations Trade and Development (UNCTAD), oil prices rose above USD 90 per barrel amid disruptions around the Strait of Hormuz, a major route for global energy and fertilizer trade.
Higher energy and transportation expenses may also increase the cost of fermentation, extraction, drying, packaging, and temperature-controlled storage. Suppliers relying on imported raw materials could face tighter margins, while smaller manufacturers may struggle to absorb additional expenses. Prolonged instability could encourage companies to diversify suppliers, increase safety stocks, and develop alternative shipping routes. However, these measures may require additional working capital and raise inventory costs.
Regional Insights
North America: Dominating Region
North America held a dominant position in the nutraceutical ingredients market in 2025, accounting for 34.21% share, with a reported market value of USD 24.8 billion. The region benefits from established dietary supplement manufacturers, advanced food processing capabilities, strong distribution networks, and growing consumer interest in preventive nutrition.
The United States contributes significantly to regional demand through the widespread use of vitamins, minerals, probiotics, and botanical ingredients. According to the United States Centers for Disease Control and Prevention (CDC), 60.2% of adults aged 20 and older used dietary supplements during August 2021 to August 2023. This supports the region’s established consumer base for supplement-related ingredients. Manufacturers are also focusing on product quality, formulation innovation, and ingredients for healthy ageing and digestive health.
Asia-Pacific presents opportunities for nutraceutical ingredients suppliers through expanding interest in preventive healthcare, functional foods, nutritional beverages, and dietary supplements. Demand is supported by urbanization, changing food habits, wider product availability, and growing awareness of nutrition and wellness. The region also benefits from its established agricultural processing, botanical extraction, fermentation, and food manufacturing capabilities.
These capabilities provide opportunities for suppliers of plant-based ingredients, probiotics, vitamins, minerals, and specialty nutritional compounds. Future expansion will depend on consumer purchasing power, regulatory requirements, product affordability, and manufacturers’ ability to maintain consistent ingredient quality. However, a verified government source establishing Asia-Pacific as the fastest-growing region, or quantifying its 2025–2026 regional growth rate, was not identified. Accordingly, its growth outlook is described qualitatively rather than assigning an unsupported percentage.
Key Regions and Countries Insights
- North America
- US
- Canada
- Europe
- Germany
- France
- The UK
- Spain
- Italy
- Rest of Europe
- Asia Pacific
- China
- Japan
- South Korea
- India
- Australia
- Rest of APAC
- Latin America
- Brazil
- Mexico
- Rest of Latin America
- Middle East & Africa
- GCC
- South Africa
- Rest of MEA
Key Players Analysis
BASF SE supplies nutritional ingredients for food, feed, and pharmaceutical applications through its Nutrition & Health division. In 2025, BASF reported €6.509 billion in total Nutrition & Care segment sales, including €1.744 billion from Nutrition & Health. The segment recorded €137 million in research and development expenses and €662 million in investments, including acquisitions. Its ingredient portfolio and global production capabilities support its position in the nutraceutical ingredients industry.
ADM is a major supplier of nutritional ingredients used in food, beverages, supplements, and other nutrition applications. In 2025, its Human Nutrition business generated USD 4.187 billion in revenue, while its overall Nutrition segment recorded USD 7.512 billion. ADM reported total company revenue of USD 80.269 billion during the year. Its ingredient capabilities, formulation expertise, and agricultural sourcing network support product development across consumer nutrition and specialized ingredient applications.
Ingredion develops ingredient solutions for food, beverage, and industrial applications, including specialty starches, sweeteners, and plant-based ingredients used in product formulation. In 2025, the company reported USD 7.2 billion in net sales and USD 944 million in cash from operations. It also returned USD 435 million to shareholders through dividends and share repurchases. Its ingredient processing expertise and product innovation capabilities support opportunities in functional foods and nutrition-related applications.
Top Key Players Outlook
- BASF SE
- ADM
- Ingredion
- DSM NV
- Cargill Incorporated
- Tate & Lyle
- Ajinomoto
- Prinova Group
- Roquette Freres
- Arla Food Ingredients
- Dupont Nutrition & Biosciences
- Divis Laboratories
- Other Key Players
Recent Developments
- In March 2026 Tate & Lyle PLC invested £86 million in innovation and solution selling. During the same year, it achieved £53 million in productivity savings and reached its annualized US$50 million cost-synergy target from the CP Kelco combination ahead of plan.
- In 2026, Cargill continued developing ingredient solutions for food manufacturers and highlighted microbiome-friendly beverages and protein-rich formulations through its global innovation network of more than 20 innovation centres.
Report Scope
| Report Features | Description |
|---|---|
| Market Value (2025) | USD 72.71 Bn |
| Forecast Revenue (2035) | USD 159.61 Bn |
| CAGR (2026-2035) | 8.2% |
| Base Year for Estimation | 2025 |
| Historic Period | 2020-2024 |
| Forecast Period | 2026-2035 |
| Report Coverage | Revenue Forecast, Market Dynamics, Competitive Landscape, Recent Developments |
| Segments Covered | By Product (Probiotics, Prebiotics, Vitamins, Amino acids, Phytochemicals & plant extracts, Protein, Animal proteins, EPA/DHA, Minerals, Fiber & carbohydrates), By Application (Functional Food, Functional Beverages, Dietary Supplements, Personal Care & Cosmeceuticals, Animal Nutrition, Others), By Form (Dry Form, Liquid Form, Semi-solid Form), By End Use Industry (Pharmaceutical Industry, Food & Beverage Industry, Sports & Fitness Industry, Others) |
| Regional Analysis | North America – US, Canada; Europe – Germany, France, The UK, Spain, Italy, Rest of Europe; Asia Pacific – China, Japan, South Korea, India, Australia, Singapore, Rest of APAC; Latin America – Brazil, Mexico, Rest of Latin America; Middle East & Africa – GCC, South Africa, Rest of MEA |
| Competitive Landscape | BASF SE, ADM, Ingredion, DSM NV, Cargill Incorporated, Tate & Lyle, Ajinomoto, Prinova Group, Roquette Freres, Arla Food Ingredients, Dupont Nutrition & Biosciences, Divis Laboratories, Other Key Players |
| Customization Scope | Customization for segments, region/country-level will be provided. Moreover, additional customization can be done based on the requirements. |
| Purchase Options | We have three licenses to opt for: Single User License, Multi-User License (Up to 5 Users), Corporate Use License (Unlimited User and Printable PDF) |