


Report Overview
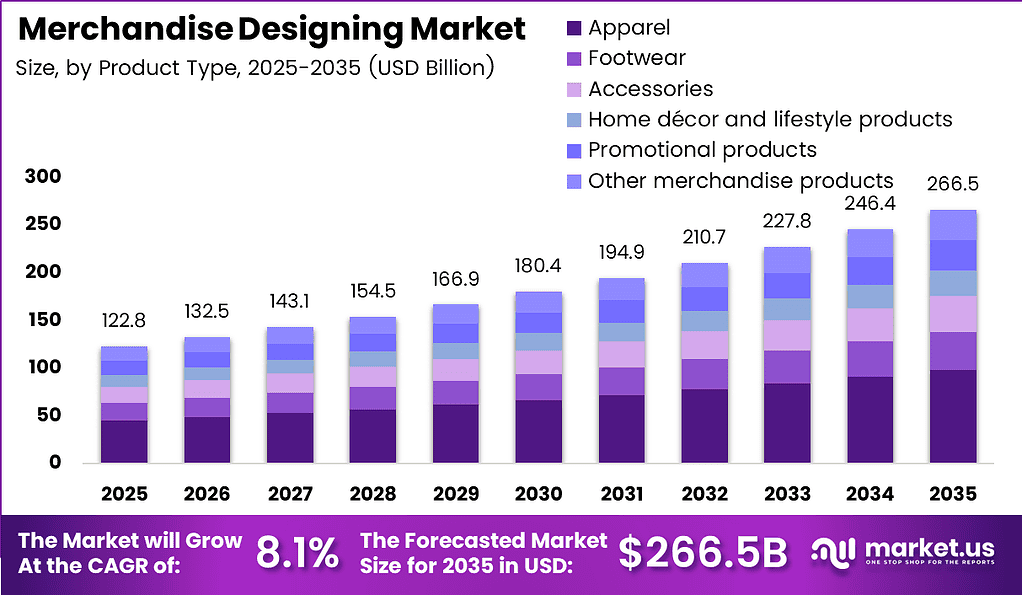
Global Merchandise Designing Market size is expected to reach around USD 266.5 Billion by 2035, compared with USD 122.8 Billion in 2025. The market carries a stated CAGR of 8.1% during the forecast period 2026 to 2035. Merchandise designing converts brand ideas into artwork, layouts, and production files for commercial products. Buyers pay for designs that communicate identity, support customization, and reproduce reliably across different materials.
Apparel brands, retailers, independent sellers, and corporate buyers purchase design work through software platforms, creative marketplaces, and specialist service providers. According to the U.S. Census Bureau, online retail sales increased 12.2% annually in the second quarter of 2026. Online assortment changes create economic reasons to commission fresh artwork and channel-specific variants. Design providers can convert those recurring revisions into retained accounts rather than depend entirely on individual commissions.
Key Takeaways
- The global Merchandise Designing Market was valued at USD 122.8 Billion in 2025.
- The forecast market value is USD 266.5 Billion by 2035.
- The stated CAGR is 8.1% during 2026 to 2035.
- Apparel holds a 37.00% share of the product type segment in 2025.
- Standard / template-based designs hold a 31.00% customization type share in 2025.
- Cloud-based deployment holds a 72.00% share in 2025.
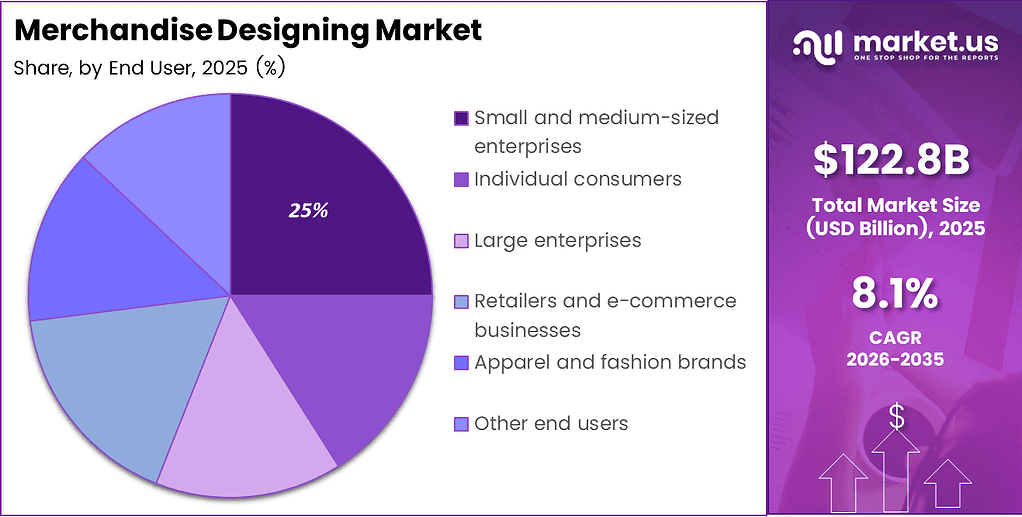
- Small and medium-sized enterprises hold a 25.00% end-user share in 2025.
- Online distribution holds a 68.00% share in 2025.
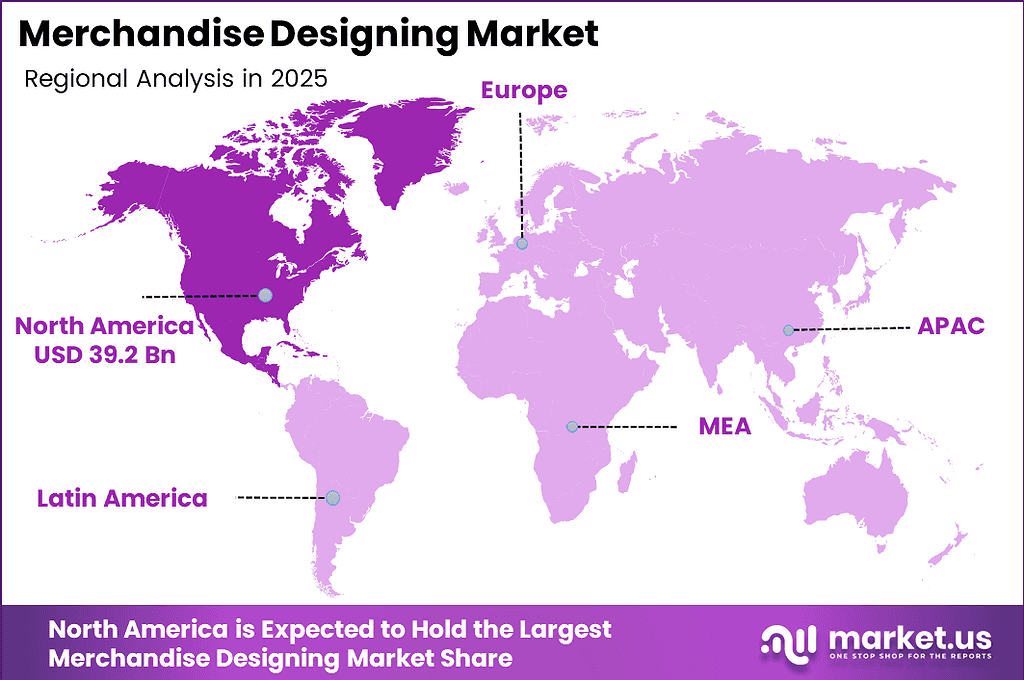
- North America leads with a 32.00% share in 2025 and a regional value of USD 39.2 Billion.
Trade policy and product-information rules shape cross-border access, although aggregate trade figures do not measure design spending. As reported by WTO, global goods and commercial-services trade reached USD 34.89 trillion in 2025, an 8% annual increase. Commercial activity across borders creates localization work for artwork, labels, and brand presentation. Investors should favor providers that separate creative delivery from legal approval and maintain clear responsibilities for regulated product information.
Production infrastructure determines whether digital artwork can become saleable merchandise without repeated manual intervention. Data from Printful shows its Atlas MAX equipment resources reached 86 systems following a January 2025 expansion. A broader production fleet can support repeatable execution, but designers still need approved files and material-specific settings. Buyers benefit when creative suppliers understand manufacturing requirements, while sellers can differentiate through fewer corrections and more dependable production handoffs.
North America holds a 32.00% market share in 2025, with a regional value of USD 39.2 Million. The region’s position makes enterprise branding, licensed merchandise, and direct customer relationships central considerations for design providers. These workflows reward consistent artwork management and reliable approval processes rather than low prices alone. Providers seeking durable accounts should organize services around brand standards, repeat campaigns, and documented production acceptance instead of isolated artwork delivery.
Creative software integration is changing how buyers assemble their design workflows and manage specialist tasks. Canva indicates that its September 2026 ProSuite launch connected four professional tools: Affinity, Cavalry, Flourish, and Leonardo. Connected tools can reduce transfers between separate creative environments, although teams still need production checks. Independent providers should compete through merchandise expertise, rights management, and client accountability rather than access to general design functions alone.
Product Type Analysis
Apparel dominates with 37.00% share in 2025 due to frequent collections and repeat artwork revisions.
In 2025, apparel held a 37.00% share in the product type segment of the Merchandise Designing Market. Figures from an ITC-hosted analysis show U.S. apparel imports reached USD 79.3 billion in 2024, supporting a large downstream product base. Apparel collections require artwork that respects garment placement, print methods, and size variations rather than generic image delivery. Design providers can build repeat business by managing coordinated collections and maintaining production-ready artwork libraries.
Footwear design requires artwork and branding that fit curved surfaces, panel boundaries, and different component materials. According to the European Commission, European footwear turnover reached EUR 26.4 billion in 2019, a historical industrial-scale indicator rather than a current estimate. Footwear manufacturers need designs that preserve brand recognition across materials and production steps. Suppliers with component-level knowledge can justify specialist fees by reducing avoidable redesign before production approval and commercial launch.
Accessories create design work around compact surfaces, repeat patterns, and brand visibility across smaller product formats. As reported by Eurostat, 45% of EU people purchased clothing, shoes, or accessories online during the preceding quarter in 2024. This combined category measures purchasing context, not accessories alone, but online presentation makes clear visual identity commercially relevant. Providers should pair attractive concepts with accurate placement files so buyers can approve both appearance and manufacturing feasibility.
Customization Type Analysis
Standard / template-based designs dominate with 31.00% share in 2025 due to affordable starting points and faster execution.
In 2025, standard / template-based designs held a 31.00% share in the customization type segment of the Merchandise Designing Market. Data from Adobe shows its India Express catalog displayed 230,489 templates at retrieval, although the total extends beyond merchandise. Reusable layouts reduce initial composition work and make simple projects affordable for price-sensitive buyers. Sellers must differentiate through appropriate template selection, production checks, and clear licensing rather than claim every template represents original work.
Semi-customized designs give buyers recognizable brand elements without requiring an entirely new composition for every order. Printful indicates that its Design Maker documentation covered more than 50 clipart collections and nearly 3,000 graphics. Editable components let designers change colors, text, and placement while preserving an approved visual foundation. Providers can protect margins by defining revision boundaries and charging separately when a request moves beyond adaptation into original creative development.
Fully customized designs serve buyers seeking original work and direct creative control. Figures from 99designs show cumulative designer payouts exceeding USD 250 million; the measure is not annual merchandise-design spending. Canva’s July 2024 Leonardo acquisition added 120 specialists, expanding visual-AI development capacity. Such tools support exploration, but exclusivity-sensitive commissions still require documented human decisions. Providers can defend premium fees through original concepts, rights clarity, and production-ready delivery rather than image generation alone.
Deployment Mode Analysis
Cloud-based deployment dominates with 72.00% share in 2025 due to shared access and centralized design collaboration.
In 2025, cloud-based deployment held a 72.00% share in the deployment mode segment of the Merchandise Designing Market. According to Eurostat, 52.7% of EU enterprises purchased cloud services in 2025, a cross-industry adoption indicator rather than a design-market share. Hosted workflows let dispersed teams review common files and maintain controlled versions. Buyers should compare collaboration gains against access permissions, data handling, and export requirements before committing important brand assets to a platform.
On-premises workflows prioritize local file control and installed creative tools, although desktop execution differs from customer-hosted enterprise servers. Canva reported more than three million Affinity professionals in March 2024, then unified three creative disciplines in its October 2025 application launch. Local editing can support detailed production preparation without placing every creative operation inside a hosted workspace. Buyers should assess collaboration needs and file compatibility instead of treating installation location as a complete security guarantee.
End User Analysis
Small and medium-sized enterprises dominate with 25.00% share in 2025 due to outsourced creativity and flexible project purchasing.
In 2025, small and medium-sized enterprises held a 25.00% share in the end-user segment of the Merchandise Designing Market. Based on World Bank data, SMEs represent around 90% of businesses worldwide, illustrating customer-population breadth rather than design expenditure. Smaller businesses can purchase specialist work without maintaining every creative skill internally. Providers should package clear deliverables and revision limits because broad customer reach does not automatically produce high spending or predictable account profitability.
Individual consumers purchase merchandise design for personal identity, gifts, events, and small creative projects. Eurostat found that 77% of EU internet users purchased goods or services online for personal use during the preceding year in 2024. Familiar digital purchasing can reduce the learning burden when buyers configure a personalized product. Sellers should simplify previews, clarify image quality requirements, and resolve approval questions before production, because individual orders offer less room for expensive manual intervention.
Large enterprises purchase design services through brand governance, procurement controls, and coordinated campaign requirements. Figures from Eurostat show these businesses generated 49% of EU business-economy value added in 2024, not an equivalent share of design expenditure. Their economic scale can support repeat assignments, but approval requirements increase service complexity. Providers should price account management and version control explicitly rather than assume a larger client automatically delivers a better margin.
Distribution Channel Analysis
Online distribution dominates with 68.00% share in 2025 due to digital discovery and convenient order management.
In 2025, online distribution held a 68.00% share in the distribution channel segment of the Merchandise Designing Market. According to Eurostat, 23.59% of EU enterprises conducted e-sales in 2024, including web, app, and electronic-data-interchange transactions. Digital ordering connects briefs, payment, file delivery, and approval within a trackable process. Sellers should optimize qualification and revision handling because convenient access can attract unsuitable projects as readily as commercially valuable customer relationships.
Offline distribution supports consultation, physical sample review, and relationship-based purchasing where buyers want direct reassurance before committing. Based on U.S. Census Bureau data, non-e-commerce transactions represented approximately 83.6% of retail sales in 2025, calculated from its reported online share. This broader measure includes more than physical-store purchases and does not quantify design channels. Providers should retain personal consultation where material selection and complex specifications justify the added sales effort.
Key Market Segments
By Product Type
- Apparel
- Footwear
- Accessories
- Home décor and lifestyle products
- Promotional products
- Packaging and labels
- Other merchandise products
By Customization Type
- Standard / template-based designs
- Semi-customized designs
- Fully customized designs
- Personalized / print-on-demand designs
By Deployment Mode
- Cloud-based
- On-premises
By End User
- Small and medium-sized enterprises
- Individual consumers
- Large enterprises
- Retailers and e-commerce businesses
- Apparel and fashion brands
- Other end users
By Distribution Channel
- Online
- Offline
Regional Analysis
North America Dominates the Merchandise Designing Market with a Market Share of 32.00% in 2025, Valued at USD 39.2 Billion
North America’s 32.00% share in 2025 places the region at the center of commercial targeting. As reported by the U.S. Census Bureau, its initial release valued U.S. online retail sales at USD 308.9 billion for 2024’s final quarter. The historical U.S. figure provides downstream context rather than a regional design-market measurement. Providers should prioritize repeat digital sellers and enterprise accounts where artwork updates can support longer customer relationships.
Europe offers a broad business-customer base, but providers must distinguish EU evidence from the whole region. Data from Eurostat shows approximately 34.0 million enterprises operated in the EU business economy in 2024. That business population creates varied branding needs without implying uniform spending across countries or company sizes. Design sellers should organize local language support, approval responsibilities, and service packages around identifiable customer groups rather than rely on regional scale alone.
Asia Pacific connects creative work with physical merchandise sourcing, although logistics statistics do not measure design-service revenue. UNCTAD indicates that China loaded approximately 670 million metric tons of seaborne cargo in 2024, illustrating one major economy’s supply-chain role. Designers serving cross-border production need specifications that factories can execute without repeated clarification. Providers can strengthen customer retention by coordinating file readiness, sample approval, and production communication before buyers commit to larger orders.
Key Regions and Countries
North America
- US
- Canada
Europe
- Germany
- France
- The UK
- Spain
- Italy
- Rest of Europe
Asia Pacific
- China
- Japan
- South Korea
- India
- Australia
- Rest of APAC
Latin America
- Brazil
- Mexico
- Rest of Latin America
Middle East and Africa
- GCC
- South Africa
- Rest of MEA
Market Dynamics
Merchandise design converts creative decisions into files that must survive manufacturing, approval, and customer delivery. Figures from Printful show monthly fulfillment exceeded one million items in January 2025, illustrating downstream operating scale rather than design revenue. Production volume makes reusable artwork standards and clear specifications commercially useful, but errors can repeat across many orders. Providers should measure accepted files, revision effort, and repeat-client contribution instead of judging performance solely by completed design counts.
Drivers
E-commerce assortment changes create recurring assignments because sellers need seasonal artwork, channel variants, and refreshed product presentation. An illustrative account with 10% more commissioned variants and 5% lower fees generates approximately 4.5% more revenue before retention effects. The example shows why repeat volume can outweigh modest price pressure without proving a market-wide result. Providers should sell managed artwork libraries and revision programs when customers repeatedly launch related merchandise.
The driver framework assigns an estimated 1.90 percentage points of contribution already embedded in the 8.1% baseline. Restraints and challenges represent embedded drags of 1.30 and 1.00 percentage points, while opportunities describe a separate 1.50-point execution-dependent ceiling. These scenario values are not measured causal effects and must not be applied twice. Investors should examine customer exposure and delivery economics before treating the opportunity ceiling as an achievable operating forecast.
| Driver | (~) % Impact on CAGR Forecast | Geographic Relevance | Impact Timeline |
|---|---|---|---|
| E-commerce assortment refresh demand | +0.65% | Global; North America and Asia-Pacific emphasis | Short term (≤ 2 years) |
| Creator-led merchandise launches | +0.40% | North America, Europe, East Asia | Short term (≤ 2 years) |
| Sports and entertainment licensing programs | +0.35% | Global; major franchise markets | Short term (≤ 2 years) |
| Retailer private-label differentiation | +0.30% | North America, Europe, India | Medium term (2 to 4 years) |
| Regional-language product localization | +0.20% | India, Southeast Asia, Latin America | Medium term (2 to 4 years) |
Restraints
Copyright-sensitive buyers may reject machine-generated final artwork when contracts require enforceable exclusivity and sufficient human authorship is absent. The U.S. Copyright Office’s January 2025 position distinguishes human expressive contributions from prompts alone rather than prohibiting AI-assisted design. An illustrative pipeline with 20% exposure and 25% rejection within that subset loses 5% of proposed bookings before remediation. Providers should document human creative decisions and clarify rights obligations before agreeing to exclusivity.
Human-led remediation can also weaken project economics even when the buyer eventually accepts the artwork. An additional 4 to 8 hours against a 20-hour project budget raises direct creative labor by 20% to 40% at unchanged rates. Those figures represent planning assumptions, not industry averages or observed rejection costs. Studios should price rights-sensitive work separately and secure approval checkpoints before committing substantial labor to an unsuitable final asset.
| Restraint | (~) % Impact on CAGR Forecast | Geographic Relevance | Impact Timeline |
|---|---|---|---|
| Unprotectable machine-generated artwork | -0.40% | United States; U.S.-facing international licensors | Short term (≤ 2 years) |
| Buyer working-capital shortfalls | -0.35% | Global; small-brand and independent-retailer exposure | Short term (≤ 2 years) |
| Exclusive category-license exclusions | -0.25% | Global licensed-merchandise channels | Medium term (2 to 4 years) |
| Buyer insolvency and procurement freezes | -0.20% | North America and Europe | Short term (≤ 2 years) |
| Sanctions-restricted customer transactions | -0.10% | Restricted destinations and affected cross-border corridors | Medium term (2 to 4 years) |
Challenges
Color consistency becomes difficult when the same artwork moves across textiles, packaging, plastics, and metal. Different surfaces change ink absorption and reflected light, so screen approval does not guarantee matching physical output. An illustrative increase from 2 proof rounds to 3 raises proofing workload by 50% and adds 2 working days under the stated assumptions. Studios should define material-specific references and acceptance tolerances before promising consistent results across every merchandise format.
Correction work can reduce profitability without stopping current sales, which makes color control a capacity issue as well as a quality issue. If proofing originally represents 10% of direct cost, a 50% workload increase adds approximately 5% to total direct cost. These figures are operating sensitivities rather than sector benchmarks or supplier quotations. Providers should build calibrated supplier routines and reusable reference libraries to protect delivery capacity as product variety expands.
| Challenge | (~) % CAGR Friction Drag | Geographic Relevance | Mitigation Horizon |
|---|---|---|---|
| Cross-substrate color inconsistency | -0.30% | Global multi-material merchandise supply chains | Medium term (2 to 4 years) |
| Production-ready design talent shortages | -0.25% | North America, Europe, Asian sourcing hubs | Medium term (2 to 4 years) |
| Fragmented client approval workflows | -0.20% | Global enterprise and agency accounts | Short term (≤ 2 years) |
| Supplier specification data fragmentation | -0.15% | Cross-border manufacturing networks | Medium term (2 to 4 years) |
| Physical sampling transit variability | -0.10% | Asia-Europe and trans-Pacific sourcing corridors | Short term (≤ 2 years) |
Opportunities
Digital product passports create prospective work in label layouts, scannable identifiers, information design, and content maintenance. The European Commission’s textile-specific delegated act is indicatively planned for the fourth quarter of 2027, not a universal compliance deadline. Early providers can prepare service templates without selling uncertain future requirements as mandatory current purchases. Designers should retain responsibility for presentation while qualified partners verify authoritative product data and any applicable compliance obligations.
Reusable information templates could improve delivery economics when products share approved structures and verified data sources. An illustrative reduction from 10 setup hours to 7 cuts setup labor by 30%; a 60% labor-cost share implies 18% lower delivery cost. An initial 40% gross margin could theoretically improve by 10.8 percentage points before hosting, verification, and integration expenses. Providers should validate those additional costs before pricing recurring passport-related services.
| Opportunity | (~) % Potential CAGR Upside | Geographic Relevance | Execution Window |
|---|---|---|---|
| Digital product passport design services | +0.45% | European Union and apparel exporters serving Europe | Medium term (2 to 4 years) |
| Adaptive and sensory-inclusive merchandise | +0.35% | North America, Europe, Japan | Medium term (2 to 4 years) |
| Industrial aftermarket accessory design | +0.30% | Europe, North America, East Asia | Medium term (2 to 4 years) |
| Independent-studio acquisition platforms | +0.25% | Fragmented regional design-service markets | Long term (≥ 4 years) |
| Institutional procurement catalog services | +0.15% | Universities, healthcare networks, public institutions | Medium term (2 to 4 years) |
Key Company Insights
Adobe Inc.
Adobe competes through a broad creative-software business rather than a separately reported merchandise-design operation. According to Adobe’s annual filing, consolidated fiscal-2025 revenue reached USD 23.769 billion, illustrating company scale rather than addressable merchandise-design sales. Its design environment can support professional artwork workflows, but investors should distinguish platform economics from project-based creative services. Buyers should assess production compatibility and licensing needs instead of treating overall company revenue as evidence of segment leadership.
Adobe’s acquisition strategy extends beyond asset creation into how customers manage brand visibility and marketing decisions. As reported by Adobe, its November 2025 Semrush agreement valued the equity at approximately USD 1.9 billion, or USD 12 per share. Adobe confirmed completion in April 2026, making the announcement and closing parts of the same transaction. Merchandise-design providers should view the combination as adjacent marketing expansion, not proof of equivalent revenue within physical-product design.
Figma, Inc.
Figma’s financial scale reflects a collaborative design platform, not a separately disclosed physical-merchandise design business. Data from Figma’s annual filing shows approximately USD 1.056 billion in fiscal-2025 revenue, providing a company-level benchmark for its operating scale. Collaborative editing can help teams organize feedback, but production-ready merchandise still requires suitable export and manufacturing checks. Buyers should evaluate how the platform fits their approval process rather than assume digital collaboration removes physical-output risks.
Figma’s public offering created a funding event while also allowing existing stockholders to sell shares. Figures from Figma show its July 2025 IPO priced 36,937,080 shares at USD 33 each, including 12,472,657 issuer shares. The remaining 24,464,423 shares belonged to selling stockholders, so total offering proceeds should not be treated as company funding. Investors should separate new corporate capital from shareholder liquidity when assessing resources available for future product development.
Key Players
- Adobe Inc.
- Canva Pty Ltd.
- Corel Corporation / Alludo
- Figma, Inc.
- Printful, Inc.
- Custom Ink, LLC
- Zazzle Inc.
- Redbubble Ltd.
- Spring / Teespring, Inc.
- Spread Group / Spreadshirt
- Threadless, Inc.
- VistaPrint / Cimpress plc
- Designhill
- 99designs / Cimpress plc
- Placeit / Envato
Recent Developments
2026
- April 2026: Adobe product innovation expanded Firefly Video Editor workflows with access to more than 800 million licensed Adobe Stock assets. According to Adobe, the integration broadened available creative resources, while its assistant announcement concerned a subsequent public beta.
- March 2026: Adobe product innovation expanded Firefly custom-model public beta across three creative categories: illustration styles, characters, and photographic styles. As reported by Adobe, the capability supported reusable visual direction, making consistency controls more relevant to buyers managing related designs.
- February 2026: Adobe product offering expansion introduced a time-limited unlimited-generation promotion covering Firefly video output up to 2K resolution. Data from Adobe shows eligibility included a March 16 signup cutoff, so buyers should not treat the promotion as a permanent entitlement.
2025
- December 2025: Adobe product innovation added FLUX.2 functionality supporting up to four reference images within Firefly. Adobe indicates that this input capacity expanded image-guided creation, giving teams more ways to communicate visual direction before production-specific checks.
- August 2025: Figma product innovation added 10 scatter brushes to Figma Draw. Figures from Figma show the update expanded illustration choices, giving creative teams more in-platform options without establishing any direct change in merchandise-design revenue.
- June 2025: Canva acquisition agreement announced the intended addition of MagicBrief and its 10-person team. According to Canva, the transaction connected creative intelligence with design workflows, making performance-informed briefs a more relevant competitive consideration for agencies and studios.
- February 2025: Adobe product launch introduced its new Firefly application and Video Model public beta with 1080p output. As reported by Adobe, the initial Standard plan allowed up to 20 five-second video generations monthly, giving buyers a defined launch allowance.
2024
- November 2024: Printful and Printify merger announcement combined in-house production resources with a network exceeding 85 third-party production partners. Data from Printful shows the transaction connected different fulfillment models, increasing the importance of supplier-specific artwork and quality checks.
Geopolitical Impact Analysis
Shipping disruption around the Red Sea changed the movement of physical merchandise and the samples used to approve its design. UNCTAD reported that Suez Canal transit ship-capacity tonnage fell 70% by mid-2024, while Cape of Good Hope ship arrivals increased 89%. These measures describe different aspects of rerouting, not a direct fall in merchandise-design revenue. Apparel blanks, packaging board, plastic components, and metal accessories can require physical inspection before buyers approve artwork placement and color. Longer routes can therefore delay the point when a digital concept becomes a verified production file. Design providers should separate digital approval from physical acceptance and document which party carries sampling delays. Buyers should avoid locking launch dates before material-specific proofs reach the responsible approval team.
Maritime growth also frames the commercial risk around merchandise sourcing without measuring creative-services performance. According to UNCTAD, global maritime trade volume increased 2.2% in 2024, while its 2025 publication forecast only 0.5% growth for 2025. The latter number remains a historical forecast, not a confirmed outcome or a current outlook. Trade uncertainty can affect replenishment decisions for textiles, printing consumables, packaging stock, and finished promotional products. Buyers may revise quantities or postpone production even after approving the design, leaving studios exposed to deferred work and changing specifications. Providers should define payment milestones around completed creative deliverables rather than depend entirely on final shipment. Manufacturers and distributors should confirm material substitutions before designers release files, because replacement surfaces can change reproduction results and restart approval.
Report Scope
| Report Features | Description |
|---|---|
| Market Value (2025) | USD 122.8 Billion |
| Forecast Revenue (2035) | USD 266.5 Billion |
| CAGR (2026 to 2035) | 8.1% |
| Base Year for Market Valuation | 2025 |
| Segment and Regional Share Reference Year | 2026 |
| Historic Period | 2021 to 2025 |
| Forecast Period | 2026 to 2035 |
| Report Coverage | Revenue Forecast, Market Dynamics, Market Opportunity Analysis, Technology and Innovation Landscape, Competitive Landscape, Recent Developments |
| Segments Covered | Product Type: Apparel; Footwear; Accessories; Home décor and lifestyle products; Promotional products; Packaging and labels; Other merchandise products. Customization Type: Standard / template-based designs; Semi-customized designs; Fully customized designs; Personalized / print-on-demand designs. Deployment Mode: Cloud-based; On-premises. End User: Small and medium-sized enterprises; Individual consumers; Large enterprises; Retailers and e-commerce businesses; Apparel and fashion brands; Other end users. Distribution Channel: Online; Offline. |
| Regional Analysis | North America (US and Canada), Europe (Germany, France, The UK, Spain, Italy, and Rest of Europe), Asia Pacific (China, Japan, South Korea, India, Australia, and Rest of APAC), Latin America (Brazil, Mexico, and Rest of Latin America), Middle East and Africa (GCC, South Africa, and Rest of MEA) |
| Competitive Landscape | Adobe Inc.; Canva Pty Ltd.; Corel Corporation / Alludo; Figma, Inc.; Printful, Inc.; Custom Ink, LLC; Zazzle Inc.; Redbubble Ltd.; Spring / Teespring, Inc.; Spread Group / Spreadshirt; Threadless, Inc.; VistaPrint / Cimpress plc; Designhill; 99designs / Cimpress plc; Placeit / Envato |
| Customization Scope | Customization for segments and region or country analysis will be provided. Additional customization can be arranged according to requirements. |
| Purchase Options | Single User License | Multi-User License (Up to 5 Users) | Corporate Use License (Unlimited User and Printable PDF) |








