Report Overview
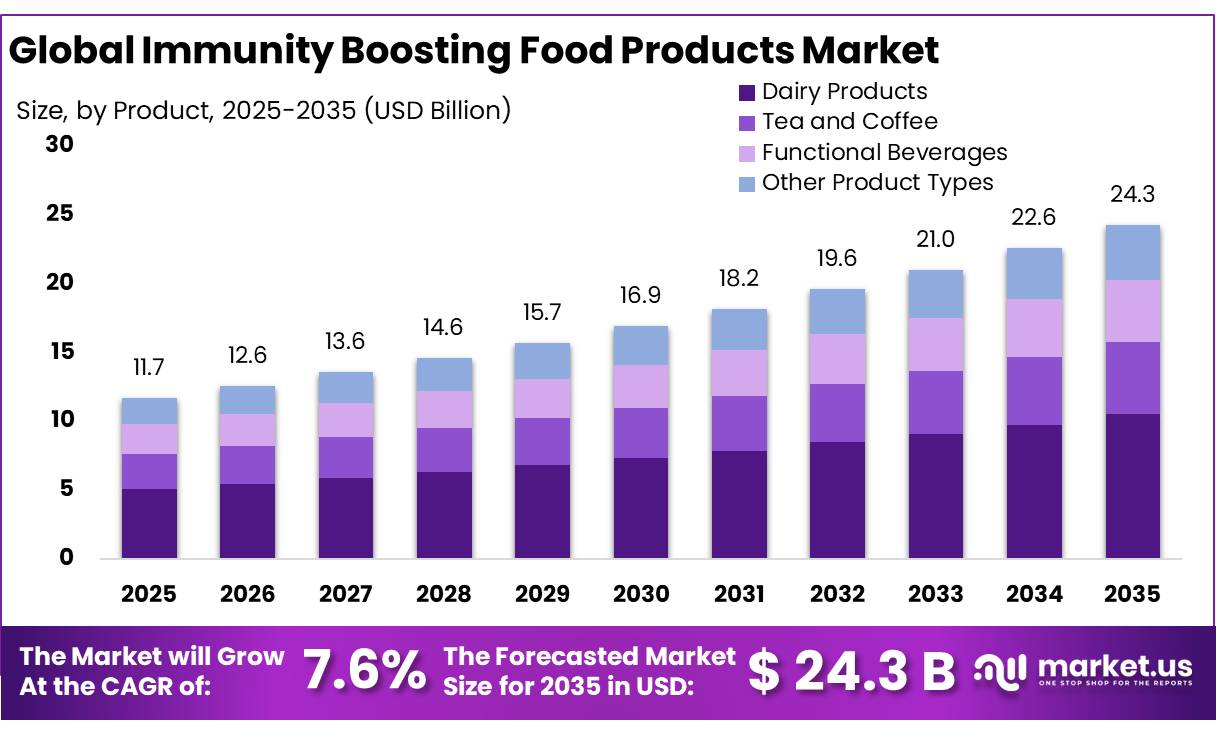
The Global Immunity Boosting Food Products Market size is expected to be worth around USD 24.3 Billion by 2035, from USD 11.7 Billion in 2025, growing at a CAGR of 7.6% during the forecast period from 2026 to 2035. In 2025, North America held a dominant market position, capturing more than a 39.78% share, holding USD 0.5 Billion revenue.
The immunity boosting food products industry has gained importance as consumers increasingly focus on preventive healthcare, nutritional balance, and daily wellness. The industry includes functional foods, fortified beverages, probiotic products, vitamin-enriched foods, nutritional bars, cereals, dairy products, and plant-based formulations designed to support normal immune function. These products contain essential nutrients such as vitamins A, C, D and E, zinc, selenium, probiotics, and botanical extracts.
- According to the US National Institutes of Health (NIH), adequate intake of vitamins A, C, D and E, along with minerals such as zinc and selenium, is important for maintaining normal immune system activity. This scientific understanding has encouraged food manufacturers to develop products with targeted nutritional benefits.
The industrial scenario is supported by the growing acceptance of functional nutrition and the expansion of health-oriented food portfolios. According to the Council for Responsible Nutrition (CRN), its 2024 consumer survey found that 75% of Americans used dietary supplements, while 30% identified immune health as a reason for supplementation. The survey also reported that median monthly spending among supplement users increased from USD 48 in 2023 to USD 50 in 2024.
Although these figures relate to dietary supplements rather than immunity boosting food products alone, they indicate a strong consumer interest in products associated with nutritional and immune health. This demand is encouraging food and beverage manufacturers to introduce fortified juices, vitamin-enriched drinks, probiotic yogurts, functional snacks, and nutrient-rich packaged foods.
The industry is also benefiting from developments in food fortification, nutritional ingredients, and food processing technologies. The World Health Organization (WHO) identifies food fortification as an effective approach to improving the nutritional quality of food supplies by adding essential micronutrients.
The CRN survey further reported that 42% of supplement users cited overall health and wellness as their primary motivation, demonstrating the importance of preventive health-related consumption. Food manufacturers are responding through functional beverages, fortified dairy products, ready-to-drink nutritional products, and immunity-oriented snacks.
Government initiatives and regulatory frameworks are also influencing industrial development. The European Commission regulates the addition of vitamins and minerals to foods under Regulation (EC) No. 1925/2006, which establishes permitted nutrients and safety requirements for food fortification. Similarly, Directive 2002/46/EC establishes harmonised requirements for food supplements, including permitted vitamins, minerals, and their sources. These regulations encourage manufacturers to strengthen ingredient safety, nutritional labelling, and product compliance.
Key Takeaways
- Immunity Boosting Food Products Market size is expected to be worth around USD 24.3 Billion by 2035, from USD 11.7 Billion in 2025, growing at a CAGR of 7.6%.
- Dairy Products held a dominant market position, capturing more than a 43.23% share.
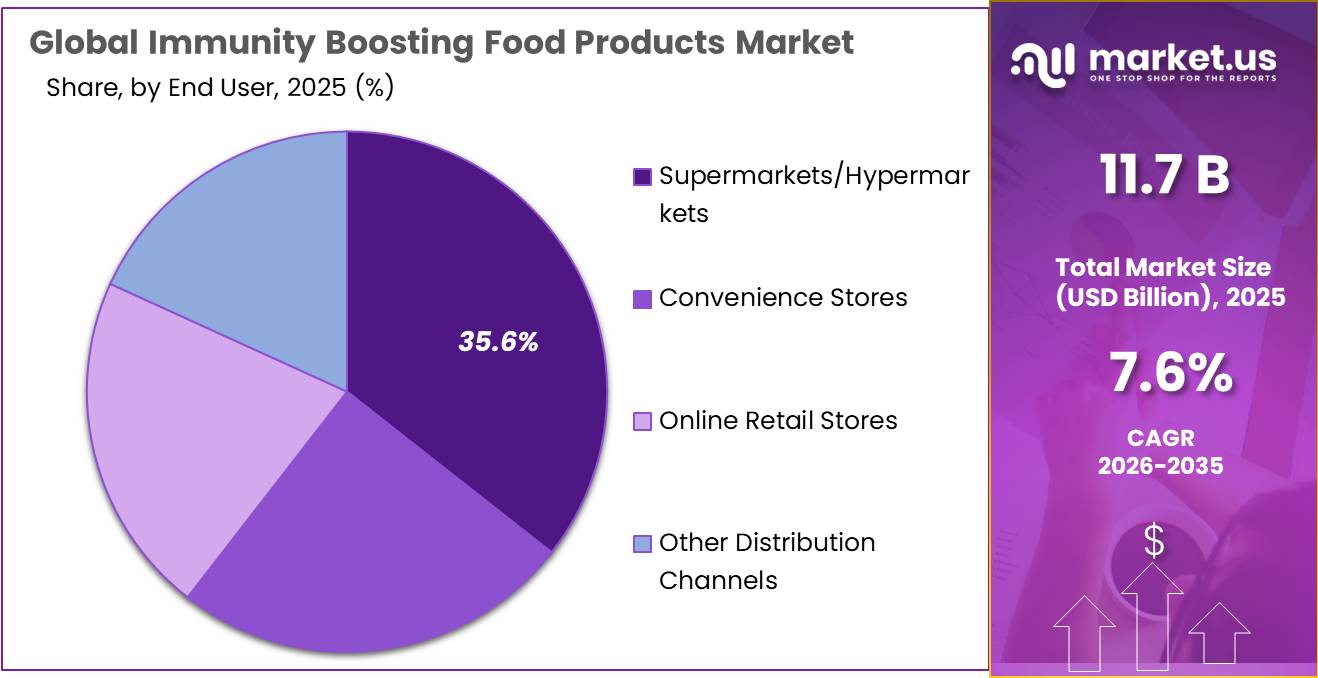
- Supermarkets/Hypermarkets held a dominant market position, capturing more than a 35.67% share of the Immunity Boosting Food Products Market.
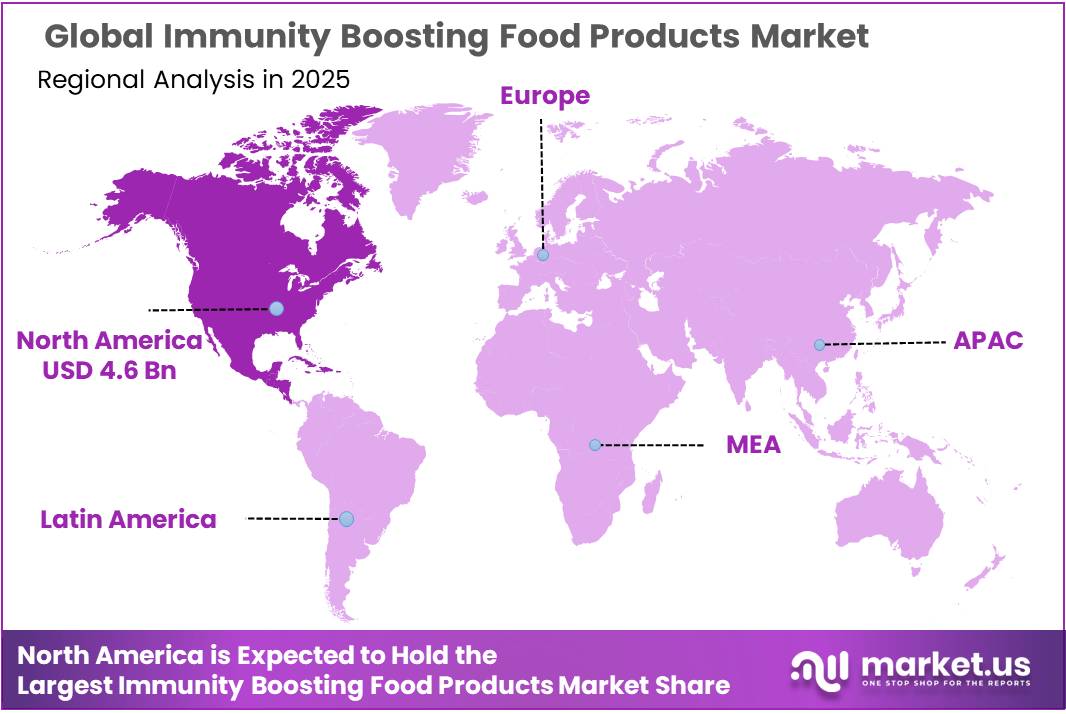
- North America dominated the Immunity Boosting Food Products Market in 2025, accounting for 39.78% of the global market, with a market value of USD 4.6 billion.
By Product Analysis
Dairy Products – Dominates the market due to its nutritional value, protein content, and availability of immune-supporting vitamins and minerals.
In 2025, “Dairy Products” held a dominant market position, capturing more than a 43.23% share of the Immunity Boosting Food Products Market. The segment benefits from the widespread consumption of milk, yogurt, cheese, and fermented dairy products, which provide essential nutrients associated with normal immune function. Milk and yogurt are increasingly used in fortified food formulations containing vitamin D, vitamin B12, zinc, and probiotics.
According to the US National Institutes of Health (NIH), vitamin D plays an important role in immune function, while zinc supports several processes involved in immune system activity. In 2025, manufacturers continued to focus on probiotic yogurt, fortified milk, and functional dairy beverages to address consumer interest in preventive nutrition. The availability of convenient dairy products, established consumption habits, and opportunities for nutritional fortification continue to support this segment’s leading position.
Tea and Coffee represent an important product category in the Immunity Boosting Food Products Market, supported by regular consumption and increasing interest in beverages with additional nutritional benefits. Green tea and black tea contain naturally occurring polyphenols, while coffee contains antioxidant compounds that contribute to its functional beverage profile. In 2025, manufacturers focused on developing functional tea and coffee products through the addition of botanical extracts, vitamins, and other nutritional ingredients.
According to the European Food Safety Authority (EFSA), a standard 220 ml cup of black tea contains approximately 50 mg of caffeine, while a 200 ml cup of filter coffee contains approximately 90 mg. These figures demonstrate the importance of formulation and caffeine management when developing functional beverages. Future opportunities include herbal tea blends, antioxidant-rich beverages, and fortified coffee products. However, manufacturers need to ensure that immune-related product claims are supported by scientific evidence and comply with applicable food regulations.
By End User Analysis
Supermarkets/Hypermarkets – Dominates the market due to wider product availability, greater consumer reach, and convenient access to functional food products.
In 2025, “Supermarkets/Hypermarkets” held a dominant market position, capturing more than a 35.67% share of the Immunity Boosting Food Products Market. The segment benefits from its extensive retail network, availability of multiple product categories, and easy access to health-oriented food and beverages.
According to the US Department of Agriculture (USDA), inflation-adjusted food sales at grocery stores reached USD 617 billion in 2025, while warehouse clubs and supercenters recorded USD 289 billion in food sales. Grocery stores accounted for 56.2% of US food-at-home sales during the same year. These figures highlight the importance of large-format grocery retailing in food distribution. In 2025, supermarkets and hypermarkets continued to provide manufacturers with opportunities to increase product visibility through dedicated wellness sections, promotional activities, and wider product assortments.
Convenience Stores represent an important distribution channel in the Immunity Boosting Food Products Market because they provide consumers with quick access to ready-to-consume nutritional products. These outlets commonly offer functional beverages, fortified juices, nutritional bars, probiotic drinks, and packaged health-oriented snacks. In 2025, the channel benefited from consumer preference for convenient purchasing, smaller product formats, and ready-to-drink nutritional options.
According to the USDA Economic Research Service, convenience stores contributed 1.2% of US food-at-home sales in 2025, within the broader category of other food-at-home retail outlets. This highlights their role in food distribution despite their smaller contribution compared with grocery stores. Future opportunities include single-serving fortified beverages, functional snack packs, and portable probiotic products.
Key Market Segments
By Product
- Dairy Products
- Tea and Coffee
- Functional Beverages
- Other Product Types
By End User
- Supermarkets/Hypermarkets
- Convenience Stores
- Online Retail Stores
- Other Distribution Channels
Driver Analysis
Nutrient-Gap-Led Fortification
Documented shortfalls in immune-relevant nutrients support an existing commercial shift toward fortified everyday foods, giving manufacturers a concrete nutritional proposition rather than relying solely on seasonal wellness messaging. NIH identifies vitamins A, C, D and E, selenium and zinc among nutrients important for normal immune function, while emphasizing that deficiency correction and supplementation in adequately nourished people are different propositions.
A February 2024 analysis summarized by NIH examined 23,107 participants aged two years and older using 2013–2018 US dietary data and found that more than 99% did not meet vitamin D intake recommendations from foods and beverages; this is an intake comparison, not a finding that 99% were clinically deficient, because blood status also reflects sunlight exposure and other factors. Separately, NIH cites 2011–2014 blood-status data showing 18% at risk of inadequacy and 5% at risk of deficiency under the cited thresholds; neither dataset measures 2026 prevalence.
Commercial execution is already visible: Danone reported that 61% of its dairy, plant-based and specialized-nutrition volumes were fortified in 2024, although that broad measure includes products outside this report’s scope and cannot be counted as immunity-market sales.
In an illustrative eligible portfolio selling 20 million servings annually, an additional fortification-and-verification cost of USD 0.01 per serving requires USD 200,000 annually; an assumed USD 0.04 increase in manufacturer realization generates USD 800,000 before any volume response, leaving USD 600,000 before marketing and overhead.
That premium is not automatically real market growth: the driver contribution requires incremental purchases or a defensible product-quality mix shift, not inflation alone. The +0.9 pp estimate assumes 30% revenue exposure grows 3.0 percentage points faster through adequately formulated, explicitly positioned immune-support products, with nutrient content verified through shelf life and without disease-prevention claims.
Drivers Impact Analysis
| Driver | (~) % Impact on CAGR Forecast | Geographic Relevance | Impact Timeline |
|---|---|---|---|
| Nutrient-gap-led fortification | +0.9 pp | US, Canada, UK, Western Europe | Short term (≤ 2 years) |
| Daily-dose consumption formats | +0.8 pp | UK, France, Spain, Brazil | Short term (≤ 2 years) |
| Lower-sugar portfolio renewal | +0.6 pp | UK, Ireland, Western Europe | Short term (≤ 2 years) |
| Plant-based immune-support access | +0.6 pp | UK, Germany, France, Canada | Medium term (2–4 years) |
| Benefit-led retail merchandising | +0.6 pp | UK, Ireland; Western European rollout | Short term (≤ 2 years) |
Restraint Analysis
Restricted Immune-Health Claims
The inability to use a proposed immune-health claim immediately limits the commercial proposition of products built around that claim, particularly where differentiation depends on a botanical, probiotic strain or proprietary blend rather than an established nutrient statement. The European Commission requires food-health claims to be clear, scientifically substantiated and compliant with Regulation (EC) No 1924/2006; its register authorizes statements that vitamins C and D contribute to normal immune-system function only where the relevant conditions of use are satisfied.
The same register contains non-authorized claims for specified probiotic preparations and bovine lactoferrin, demonstrating that ingredient presence or biological plausibility does not automatically permit an immunity claim. This is not a blanket prohibition on probiotic foods, nor does it establish identical treatment of terminology across all EU countries.
In an illustrative launch targeting one million packs annually at a USD 1.00 manufacturer realization, a six-month postponement while the proposition is reformulated exposes USD 500,000 of first-year revenue under a straight-line sales assumption; any subsequent catch-up reduces the permanent forecast loss. If the original USD 0.10-per-pack premium depended on an unavailable claim, removing it reduces full-year realization by USD 100,000 at unchanged volume, although that mix effect must not also be counted as consumer price rejection.
Suppliers therefore need claim eligibility established before committing packaging, promotional expenditure and inventory; alternative nutrient claims require genuinely qualifying formulations, not cosmetic wording changes. The −0.5 pp deduction assumes 20% revenue exposure grows 2.5 percentage points more slowly through claim-ineligible launches, removed positioning and unrecovered delays, excluding routine compliance work allocated to operational challenges.
Restraint Impact Analysis
| Restraint | (~) % Impact on CAGR Forecast | Geographic Relevance | Impact Timeline |
|---|---|---|---|
| Restricted immune-health claims | −0.5 pp | EU; EU-bound exporters | Short term (≤ 2 years) |
| Premium-price purchase rejection | −0.4 pp | UK, US, Canada, Western Europe | Short term (≤ 2 years) |
| HFSS advertising exclusions | −0.3 pp | UK advertising; England promotions | Short term (≤ 2 years) |
| Unproven-benefit purchase rejection | −0.3 pp | US, Canada, UK, Western Europe | Medium term (2–4 years) |
| Unviable incremental listings | −0.3 pp | UK, Ireland, Western Europe, US | Short term (≤ 2 years) |
Opportunity Analysis
Ambient-Channel Conversion
Shelf-stable immune-support foods offer a route into accounts that cannot economically sustain refrigerated distribution, expanding serviceable outlets rather than merely adding flavours to existing chilled shelves. Tetra Pak describes yogurt-based products for ambient distribution with shelf lives of several months, while its technical guidance specifies that additional heat treatment, dosing and mixing controls are required; conventional heat-treated ambient yogurt does not retain the live cultures associated with untreated fermented yogurt.
In an illustrative 2,000-outlet program selling 15 incremental 125-ml packs per outlet weekly over 50 weeks, annual volume reaches 1.5 million packs, or 187,500 litres; at an assumed USD 0.30 manufacturer realization, gross revenue is USD 450,000. If 25% substitutes existing in-scope products, net category expansion is USD 337,500.
Assuming ambient logistics save USD 0.025 per pack but additional processing and packaging cost USD 0.020, the net operating advantage is only USD 7,500 annually before capital recovery, illustrating that market access not automatic margin expansion the principal value source.
Manufacturers need shelf-life nutrient verification, sensory stability and distribution contracts before committing capacity. The +0.35 pp contribution assumes 7% revenue exposure grows 5.0 percentage points faster through genuinely additional ambient-channel consumption, excluding existing ambient sales and routine geographic distribution already captured in baseline growth.
Opportunity Impact Analysis
| Opportunity | (~) % Potential CAGR Upside | Geographic Relevance | Execution Window |
|---|---|---|---|
| Ambient-channel conversion | +0.35 pp | India, Indonesia, Philippines, South Africa | Medium term (2–4 years) |
| Institutional meal qualification | +0.30 pp | US school and childcare procurement | Short term (≤ 2 years) |
| Older-adult food partnerships | +0.30 pp | Japan, Germany, UK, US | Medium term (2–4 years) |
| Consumption-led replenishment | +0.25 pp | UK, US, Canada, Germany | Short term (≤ 2 years) |
| Shared-platform private labels | +0.20 pp | UK, Germany, France, Canada | Medium term (2–4 years) |
Challenges Analysis
Nutrient Potency Through Expiry
A March 2026 review identifies food-matrix interactions as determinants of vitamin C stability, while established reviews identify temperature, oxygen, light, pH and trace metals as important degradation variables; results from one juice, package or processing regime cannot be transferred directly to another fortified beverage.
In an illustrative product requiring an internal end-of-shelf-life target of 60 mg vitamin C per serving, assumed retention of 80% requires 75 mg at release, a 25% overage relative to that target. If retention falls to 70%, required release content rises to approximately 85.7 mg, a 42.9% overage, assuming the same degradation model and no other constraints. Across ten million servings, the difference represents approximately 107 kg of additional vitamin C equivalent; actual procurement cost depends on ingredient potency, formulation and contract terms.
Higher loading is not a substitute for safe formulation, applicable nutrient limits or real-time stability evidence, and different vitamins require different controls. Manufacturers need dissolved-oxygen management, suitable light and oxygen barriers, process-specific retention measurements and conservative shelf-life specifications. The −0.30 pp contribution assumes 15% revenue exposure grows 2.0 percentage points more slowly through protective-packaging expenditure, conservative expiry dates and stability-driven production adjustments, excluding lost sales from legally ineligible claims already assigned to restraints.
Challenges Impact Analysis
| Challenge | (~) % CAGR Friction Drag | Geographic Relevance | Mitigation Horizon |
|---|---|---|---|
| Nutrient potency through expiry | −0.30 pp | US, Canada, UK, EU beverage hubs | Medium term (2–4 years) |
| Strain-specific probiotic survival | −0.30 pp | EU, US, Japan, South Korea | Long term (≥ 4 years) |
| Fragmented chilled distribution control | −0.30 pp | India, Indonesia, Philippines, South Africa | Long term (≥ 4 years) |
| Fortification and sensory trade-offs | −0.20 pp | North America, EU, India | Medium term (2–4 years) |
| Matrix-specific validation workload | −0.20 pp | US, UK, EU, Asian export hubs | Medium term (2–4 years) |
Geopolitical Impact Analysis
Geopolitical Impact of the Middle East War on the Immunity Boosting Food Products Market
The ongoing Middle East conflict in 2026, along with continued disruptions to Black Sea trade routes due to the Russia-Ukraine war, is creating cost and supply-chain challenges for the Immunity Boosting Food Products Market. Disruptions around the Strait of Hormuz have affected energy, fertilizer, and international shipping flows, increasing the cost of agricultural production, food processing, packaging, and transportation. According to the Food and Agriculture Organization (FAO), global fertilizer trade has faced significant disruption, while natural gas and energy price increases have added pressure on food production costs.
In September 2026, FAO reported that the Food Price Index reached 136.0 points, increasing 1.5% month-on-month and 5.8% year-on-year. These developments can increase manufacturing costs for fortified dairy products, probiotic beverages, nutritional snacks, and vitamin-enriched foods. Higher transportation and ingredient costs may also lead to increased retail prices, affecting consumer purchasing decisions. However, demand for affordable functional foods and essential nutritional products is expected to remain an important market opportunity. Manufacturers are increasingly encouraged to diversify ingredient suppliers, strengthen regional sourcing, and improve inventory management to reduce geopolitical risks.
Regional Insights
Dominating Region: North America (39.78% Market Share, USD 4.6 Billion)
North America dominated the Immunity Boosting Food Products Market in 2025, accounting for 39.78% of the global market, with a market value of USD 4.6 billion. The region’s leading position is supported by strong consumer awareness of preventive nutrition, established functional food manufacturers, and widespread availability of fortified food and beverages. The United States represents a major contributor, supported by demand for probiotic dairy products, vitamin-enriched beverages, nutritional snacks, and fortified packaged foods.
According to the US Centers for Disease Control and Prevention (CDC), 60.2% of American adults used dietary supplements during August 2021 to August 2023, demonstrating considerable interest in additional nutritional intake. This consumer behaviour supports opportunities for immunity-oriented food manufacturers across the region. Canada also contributes through growing interest in nutritional fortification and functional food products.
Asia Pacific represents a significant growth opportunity for the Immunity Boosting Food Products Market, supported by increasing health awareness, expanding middle-income populations, and rising demand for functional food and beverage products. China, Japan, South Korea, and Australia are important markets for fortified foods, probiotic beverages, nutritional dairy products, and plant-based formulations.
According to China’s National Bureau of Statistics, retail sales of grain, oil, and food products increased by 9.3% in 2025 compared with the previous year. In addition, China’s government introduced a health-related consumption action plan in April 2025 to improve healthy diets and expand the availability of high-quality food products.
Key Regions and Countries Insights
- North America
- US
- Canada
- Europe
- Germany
- France
- The UK
- Spain
- Italy
- Rest of Europe
- Asia Pacific
- China
- Japan
- South Korea
- India
- Australia
- Rest of APAC
- Latin America
- Brazil
- Mexico
- Rest of Latin America
- Middle East & Africa
- GCC
- South Africa
- Rest of MEA
Key Players Analysis
Danone SA maintained a strong position in the immunity boosting food products industry through its dairy, plant-based, and specialized nutrition portfolio. In 2025, the company recorded total sales of €27.283 billion, representing 4.5% like-for-like growth. Its product portfolio includes Activia, Actimel, and Alpro, which support its presence in functional dairy and nutrition categories. The company also reported a recurring operating income of €3.665 billion in 2025, reflecting its continued investment in nutritional innovation and product development.
Yakult Honsha Company, Limited has an established position in the immunity boosting food products industry through its probiotic dairy beverages and fermented milk products. In FY2025, the company recorded consolidated net sales of ¥486.4 billion and sold approximately 38 million dairy product bottles daily worldwide. Its products are distributed across 40 countries and regions, supporting its international presence. The company continues to focus on probiotic research, product innovation, and expansion of its functional dairy beverage portfolio to address growing consumer interest in digestive and nutritional health.
Kirin Holdings Company, Limited is strengthening its presence in the functional food and immunity-oriented nutrition industry through its beverage and Health Science businesses. In 2025, the company reported consolidated revenue of ¥2,433.4 billion, increasing 4.1% year-on-year. Its Health Science business generated ¥251.4 billion, representing 43.4% growth compared with 2024. Kirin also reported Health Science product revenue of ¥42 billion within its beverage business. Its focus on functional ingredients, nutritional beverages, and health science innovation supports its position in the broader wellness food industry.
Top Key Players Outlook
- Danone SA
- Yakult Honsha Company, Limited
- Kirin Holdings Company, Limited
- Morinaga & Co.
- Suja Life, Inc.
- East West Tea Company, LLC
- The Hain Celestial Group, Inc.
- VitaCup Inc.
- Dabur Limited
- ITC Limited
- Gujarat Co-operative Milk Marketing Federation Ltd.
- Nestle SA
- Other Key Players
Recent Developments
- In April 2026, Morinaga America Foods also inaugurated its second US manufacturing facility in Mebane, North Carolina, involving an investment of USD 136 million and creating 204 jobs. From an investment perspective, Morinaga reported research and development expenditure of JPY 3.213 billion and capital investment of JPY 5.936 billion for the financial year ended March 2026. Its consolidated net sales reached JPY 236.672 billion during the same period.
- In June 2026, Suja Life reported first-quarter net sales of USD 107.1 million, representing 22.5% year-on-year growth, while adjusted EBITDA increased 66.3% to USD 25 million. In August 2026, second-quarter net sales reached USD 83.9 million, increasing 11.6%, while adjusted EBITDA rose 50% to USD 14.6 million.
Report Scope
| Report Features | Description |
|---|---|
| Market Value (2025) | USD 11.7 Bn |
| Forecast Revenue (2035) | USD 24.3 Bn |
| CAGR (2026-2035) | 7.6% |
| Base Year for Estimation | 2025 |
| Historic Period | 2020-2024 |
| Forecast Period | 2026-2035 |
| Report Coverage | Revenue Forecast, Market Dynamics, Competitive Landscape, Recent Developments |
| Segments Covered | By Product (Dairy Products, Tea and Coffee, Functional Beverages, Other Product Types), By End User (Supermarkets/Hypermarkets, Convenience Stores, Online Retail Stores, Other Distribution Channels) |
| Regional Analysis | North America – US, Canada; Europe – Germany, France, The UK, Spain, Italy, Rest of Europe; Asia Pacific – China, Japan, South Korea, India, Australia, Singapore, Rest of APAC; Latin America – Brazil, Mexico, Rest of Latin America; Middle East & Africa – GCC, South Africa, Rest of MEA |
| Competitive Landscape | Danone SA, Yakult Honsha Company, Limited, Kirin Holdings Company, Limited, Morinaga & Co., Suja Life, Inc., East West Tea Company, LLC, The Hain Celestial Group, Inc., VitaCup Inc., Dabur Limited, ITC Limited, Gujarat Co-operative Milk Marketing Federation Ltd., Nestle SA, Other Key Players |
| Customization Scope | Customization for segments, region/country-level will be provided. Moreover, additional customization can be done based on the requirements. |
| Purchase Options | We have three licenses to opt for: Single User License, Multi-User License (Up to 5 Users), Corporate Use License (Unlimited User and Printable PDF) |