


Report Overview
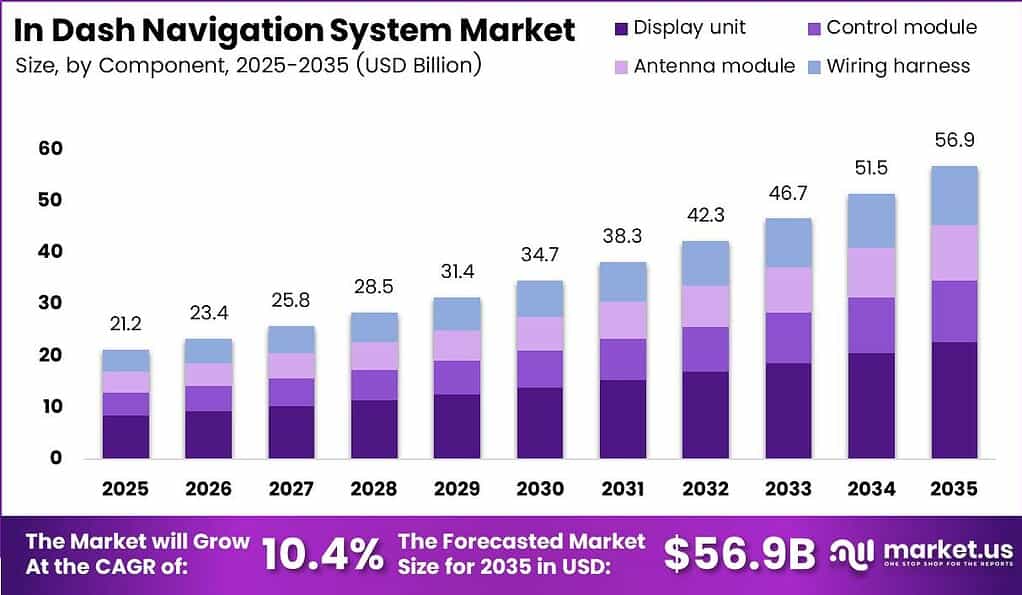
Global In Dash Navigation System Market size is expected to be worth around USD 56.9 Billion by 2035 from USD 21.2 Billion in 2025, growing at a CAGR of 10.4% during the forecast period 2026 to 2035.
The in-dash navigation system market covers embedded display units, control modules, antenna assemblies, and wiring harnesses integrated directly into vehicle cockpits. These systems deliver real-time route guidance, traffic intelligence, and connected vehicle services across passenger cars, light commercial vehicles, and heavy commercial vehicles sold through OEM factory-fit and aftermarket channels.
Key Takeaways
- The global In Dash Navigation System Market was valued at USD 21.2 Billion in 2025 and is forecast to reach USD 56.9 Billion by 2035.
- The market grows at a CAGR of 10.4% from 2026 to 2035.
- By Component, Display Unit dominates with a 37.90% share.
- By Technology, 2D Maps leads with a 61.00% share.
- By Connectivity, Embedded connectivity holds a 48.00% share.
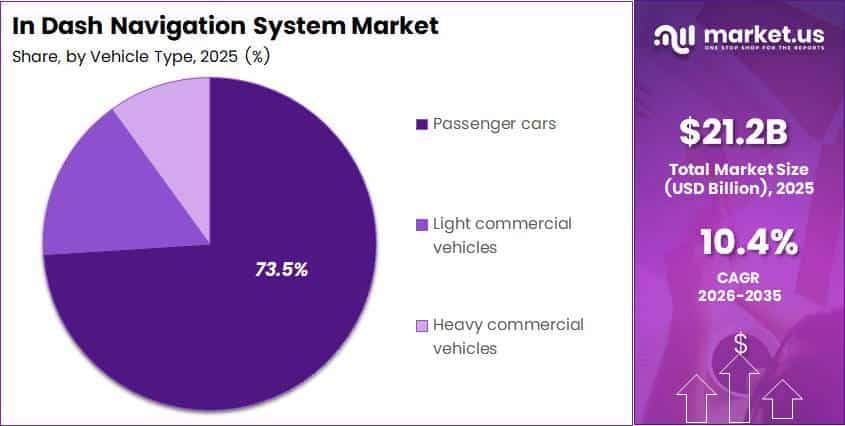
- By Vehicle Type, Passenger Cars dominate with a 73.50% share.
- By Propulsion, Internal Combustion Engine Vehicles lead with a 73.00% share.
- By Sales Channel, OEM holds the largest share at 87.80%.
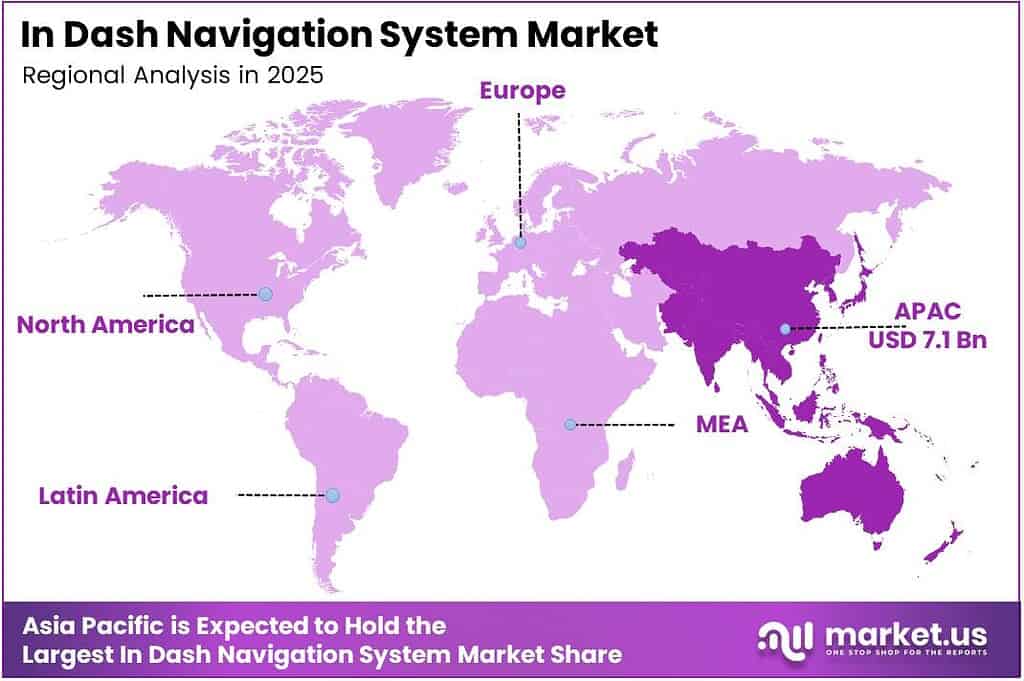
- Asia Pacific is the dominant region with a 33.90% share, valued at USD 7.1 Billion.
Government investment in automotive electrification and vehicle connectivity is accelerating navigation system integration across major production markets. The European Commission’s automotive action plan and India’s production-linked incentive frameworks are reshaping supplier investment priorities. These policy signals reduce platform risk for Tier 1 navigation suppliers and support longer-term OEM software-service commitments.
According to the International Energy Agency, global electric-car sales exceeded 17 million units in 2024, accounting for more than 20% of cars sold worldwide. This penetration rate makes EV-specific energy-route optimization a standard navigation requirement rather than a premium feature. Suppliers that embed charging-corridor planning and range anxiety mitigation tools into base navigation software hold a structural advantage in EV platform sourcing decisions.
International Energy Agency data shows global electric-car sales were up 35% year on year in the first quarter of 2025. This rate of adoption compresses the window for navigation suppliers to certify EV-ready platforms before new model launches. HARMAN committed ₹345 crore to expand its Chakan, Pune automotive-electronics facility in October 2025, signaling that India is emerging as a critical production base for next-generation in-vehicle navigation hardware.
As per our research, global motor-vehicle production increased from 92.7 million units in 2024 to 96.4 million units in 2025, a 3.9% year-on-year increase. This volume expansion directly enlarges the addressable pool of factory-fit navigation units. OEM suppliers positioned across high-growth production markets will capture the largest share of new platform nominations over the forecast period.
Component Analysis
Display Unit dominates with 37.90% due to central role in cockpit integration and HMI.
In 2025, Display Unit held a dominant market position in the By Component segment of the In Dash Navigation System Market, with a 37.90% share. The display unit functions as the primary human-machine interface, rendering maps, alerts, and connected-service data in real time. OEMs standardizing large-format cockpit screens are driving display unit content value upward per vehicle, making this the highest-margin component category for Tier 1 suppliers.
The Control Module manages system processing, data routing, and software execution across the navigation stack. Its integration with ADAS sensors and vehicle-network gateways positions it as a critical design win for suppliers targeting software-defined vehicle programs. Automakers specifying common computing platforms across model lines increase control module volume per supplier, improving scale economics.
The Antenna Module enables GNSS positioning, cellular connectivity, and vehicle-to-infrastructure communication for real-time navigation services. Its performance directly determines map accuracy and live-traffic reliability. As embedded connectivity penetration rises, antenna module specifications are tightening, rewarding suppliers with multi-band, low-latency designs.
Wiring Harness and remaining component sub-segments hold the residual share collectively. These sub-segments support system integration but carry lower software content and margin. Suppliers in these categories face substitution pressure as wireless vehicle architectures reduce physical wiring requirements over the forecast period.
Technology Analysis
2D Maps dominates with 61.00% due to broad vehicle compatibility and lower processing demand.
In 2025, 2D Maps held a dominant market position in the By Technology segment of the In Dash Navigation System Market, with a 61.00% share. Two-dimensional mapping remains the default specification across mass-market vehicle programs because it operates effectively on existing display hardware without demanding high-end GPU processing. This compatibility with entry and mid-range trims sustains its volume lead and limits immediate share erosion from three-dimensional alternatives.
3D Maps represent the technology sub-segment positioned to gain share over the forecast period, particularly in premium and electric vehicle programs where larger displays and faster processors are standard. Three-dimensional rendering improves lane guidance clarity and junction visualization, reducing driver cognitive load at complex intersections. Suppliers that can deliver 3D map content with low latency at acceptable licensing costs will benefit as cockpit screen sizes increase.
Connectivity Analysis
Embedded connectivity dominates with 48.00% due to superior vehicle-data integration and offline reliability.
In 2025, Embedded connectivity held a dominant market position in the By Connectivity segment of the In Dash Navigation System Market, with a 48.00% share. Embedded systems deliver navigation independently of smartphone pairing, enabling safety-critical functions such as emergency routing, stolen-vehicle tracking, and ADAS data fusion. OEMs targeting premium and regulatory-compliant platforms consistently specify embedded connectivity as a non-negotiable baseline.
Tethered connectivity, which relies on smartphone pairing via Apple CarPlay or Android Auto, competes directly on cost and content freshness. It carries the lowest integration cost per vehicle and benefits from continuous map updates through the connected handset. This approach captures price-sensitive segments but constrains supplier recurring revenue potential and limits access to native vehicle-sensor data.
Integrated and smartphone-based hybrid systems form the remaining connectivity share. These architectures blend native vehicle processing with cloud-sourced content delivered through the handset network. They offer a middle path between full embedded cost and tethered dependency but require validated software architectures that satisfy both OEM cybersecurity standards and phone-OS update cycles.
Vehicle Type Analysis
Passenger Cars dominate with 73.50% due to highest production volume and OEM navigation take rates.
In 2025, Passenger Cars held a dominant market position in the By Vehicle Type segment of the In Dash Navigation System Market, with a 73.50% share. As reported by the International Organization of Motor Vehicle Manufacturers, India alone recorded domestic passenger vehicle sales of more than 4.6 million units in fiscal year 2025 to 2026. This volume confirms that emerging-market passenger car demand is a direct revenue driver for in-dash navigation system suppliers pursuing OEM sourcing in South Asia.
Light Commercial Vehicles represent the fastest-expanding sub-segment within vehicle type, driven by last-mile delivery fleet growth and urban logistics expansion. Navigation system requirements in this category increasingly include load-zone routing, time-window compliance, and fleet dispatch integration. Suppliers that adapt passenger-car navigation platforms for commercial-workflow use cases can address this segment without full platform redevelopment.
Heavy Commercial Vehicles hold the smallest vehicle type share but carry the highest navigation content value per unit. According to the International Organization of Motor Vehicle Manufacturers, India recorded domestic sales of more than 1 million trucks and buses in fiscal year 2025 to 2026. Dedicated heavy-vehicle routing, bridge-height clearance, and cargo-restriction compliance make navigation a safety and regulatory requirement rather than a consumer preference in this sub-segment.
Propulsion Analysis
Internal Combustion Engine Vehicles dominate with 73.00% due to fleet size and established OEM navigation integration.
In 2025, Internal Combustion Engine Vehicles held a dominant market position in the By Propulsion segment of the In Dash Navigation System Market, with a 73.00% share. ICE vehicles represent the largest installed base across all global markets, sustaining high OEM factory-fit navigation volumes. Suppliers serving this sub-segment benefit from standardized integration requirements and established platform cycles with predictable revenue timing.
Electric Vehicles are the fastest-growing propulsion sub-segment and are reshaping navigation system requirements at the platform level. International Energy Agency data shows global electric-car sales increased by more than 25% in 2024, and 17.3 million electric cars were produced globally that year. These volumes confirm that EV-specific navigation features such as charging-corridor planning and energy-efficiency routing are now addressable at scale rather than in niche programs.
International Energy Agency figures show China averaged roughly 875,000 electric-car sales per month during January to March 2025, totaling more than 2.5 million units for the quarter. Chinese OEM navigation specifications consequently lead global adoption of EV-optimized routing standards. Suppliers that align map content and range-prediction algorithms with Chinese platform requirements gain a first-mover template applicable to other high-growth EV markets.
International Energy Agency projections indicate global electric-car sales were set to exceed 20 million units in 2025, representing more than one-quarter of global car sales. Hybrid Vehicles and remaining propulsion sub-segments hold the residual share collectively. Hybrid platforms benefit from dual-mode energy routing but currently lack the scale to drive independent navigation specification changes at the OEM level.
Sales Channel Analysis
OEM dominates with 87.80% due to factory-fit integration mandates and connected-service contracts.
In 2025, OEM held a dominant market position in the By Sales Channel segment of the In Dash Navigation System Market, with a 87.80% share. Factory-fit navigation is embedded at the design and sourcing stage, creating multi-year contracts between navigation system suppliers and vehicle manufacturers. This structural lock-in gives OEM-channel suppliers stable revenue visibility and significantly limits aftermarket competitors from displacing factory-integrated systems.
The Aftermarket channel holds the remaining share and faces structural decline as OEM take rates for factory-fit navigation rise. Consumers in markets with high smartphone penetration increasingly substitute aftermarket navigation devices with phone-based solutions. Aftermarket suppliers must differentiate through installation simplicity, real-time traffic superiority, or commercial-fleet customization to maintain channel relevance over the forecast period.
Key Market Segments
By Component
- Display Unit
- Control Module
- Antenna Module
- Wiring Harness
By Technology
- 2D Maps
- 3D Maps
By Connectivity
- Embedded
- Tethered
- Integrated/Smartphone
By Vehicle Type
- Passenger Cars
- Light Commercial Vehicles
- Heavy Commercial Vehicles
By Propulsion
- Internal Combustion Engine Vehicles
- Electric Vehicles
- Hybrid Vehicles
By Sales Channel
- OEM
- Aftermarket
Regional Analysis
Asia Pacific Dominates the In Dash Navigation System Market with a Market Share of 33.90%, Valued at USD 7.1 Billion
Asia Pacific commands the largest regional share of the In Dash Navigation System Market. Data from the International Organization of Motor Vehicle Manufacturers shows Asia-Pacific vehicle production rose 7.6% to approximately 59.2 million units in 2025, representing more than 61% of global output. International Organization of Motor Vehicle Manufacturers figures also show vehicle sales across Asia, Oceania, and the Middle East increased from 51.39 million to 55.02 million units in 2025, up 7.1%, taking the region’s share above 55% of global sales. This production and sales density makes Asia Pacific the single largest source of OEM navigation platform nominations globally.
Within Asia Pacific, China is the production anchor. According to the International Organization of Motor Vehicle Manufacturers, China produced 34.53 million vehicles in 2025, approximately 3.25 million more than in 2024 and 10.4% higher year on year. International Organization of Motor Vehicle Manufacturers data also shows India produced 6.49 million vehicles in 2025, and Japan produced 8.41 million vehicles.
The Society of Indian Automobile Manufacturers reported India’s Q3 vehicle sales reached 5.70 million units, the first time quarterly demand exceeded 5 million units, while total production in December 2025 alone reached 2,633,506 units. Valeo announced investment of more than €200 million to expand its industrial footprint in India in February 2026, confirming supplier confidence in South Asian production scale. As a result, India is transitioning from an emerging-market navigation opportunity into a primary OEM platform sourcing location.
North America and Europe represent the two largest non-Asia regional markets. International Organization of Motor Vehicle Manufacturers data shows North American vehicle sales increased 2.9% to 24.86 million units in 2025, while production declined 2.1% to 18.74 million units. Valeo broke ground on a $225 million McAllen, Texas manufacturing facility in March 2026, expected to create up to 500 jobs and begin production in late 2027. European vehicle production declined 0.8% to 17.2 million units in 2025 and sales declined 0.4% to 18.63 million units. African vehicle sales increased 22%, from 1.05 million to 1.29 million units in 2025, signaling an early-stage growth trajectory that positions the continent as a long-run incremental market for navigation system expansion.
Key Regions and Countries
North America
- US
- Canada
Europe
- Germany
- France
- The UK
- Spain
- Italy
- Rest of Europe
Asia Pacific
- China
- Japan
- South Korea
- India
- Australia
- Rest of APAC
Latin America
- Brazil
- Mexico
- Rest of Latin America
Middle East and Africa
- GCC
- South Africa
- Rest of MEA
Market Dynamics
Market Opportunity Analysis - India's policy momentum and Africa's early-stage sales growth signal underexploited entry points for navigation suppliers
India’s automotive investment environment has moved from emerging-market status to a primary OEM sourcing destination. The Press Information Bureau of the Government of India reports the automobile sector attracted $36 billion of foreign direct investment over the preceding four years. This capital concentration signals that Tier 1 navigation suppliers without established Indian manufacturing or engineering partnerships face increasing platform nomination risk over the forecast period.
India’s auto-components industry exports more than 25% of its production annually, according to the Press Information Bureau of the Government of India. This export intensity confirms that India-based navigation system production is viable for global supply, not only domestic OEM fitment. Suppliers that use Indian facilities as cost-efficient export hubs can improve price competitiveness in Southeast Asian and Middle Eastern markets simultaneously.
The Press Information Bureau of the Government of India indicates India’s auto industry targets $7 billion of investment by fiscal year 2028. This forward investment trajectory positions India as a multi-year demand generator for navigation system content across both passenger and commercial vehicle segments. By contrast, Africa’s vehicle sales increase of 22% to 1.29 million units in 2025 represents an early-stage volume base where retrofit and aftermarket navigation platforms face minimal embedded OEM competition, creating a first-mover window for cost-optimized navigation solutions.
Technology and Innovation Landscape - Connected vehicle infrastructure and EV fleet growth are redefining navigation system design requirements
Maritime trade context shapes the connectivity infrastructure that in-vehicle navigation systems depend on for map and content delivery. UN Trade and Development data shows maritime trade grew 2.2% in 2024, and UN Trade and Development projects average maritime-trade growth of 2% annually for 2026 to 2030. Seaborne shipping carries more than 80% of goods traded worldwide, meaning stable freight flows sustain the hardware supply chains that produce navigation system chipsets, display panels, and antenna components.
UN Trade and Development projected maritime-trade growth of 0.5% for 2025, signaling a near-term supply-chain deceleration that could affect component lead times for navigation system manufacturers. This slowdown creates procurement risk for OEM navigation programs with tight launch timelines. Suppliers that hold strategic component inventories or dual-source critical semiconductor and display inputs are better positioned to maintain delivery commitments despite freight disruption.
The World Shipping Council member sector reported 1,204 dual-fuel container ships and vehicle carriers were delivered or on order in 2025, representing more than $180 billion of private investment. This fleet modernization improves the reliability and efficiency of automotive component shipments globally. Consequently, navigation system suppliers dependent on transoceanic component flows benefit from reduced transit-time variability as next-generation carrier capacity enters service over the forecast period.
Valeo reported €20.9 billion in sales in 2025, up 0.5% on a like-for-like basis, and a 4.5% operating margin with €252 million of free cash flow for the first half of 2025. Valeo’s financial profile confirms that large Tier 1 navigation and automotive-electronics suppliers are generating sufficient cash to fund technology investment cycles without external financing dependency. This self-funded R&D capacity accelerates the pace of software-defined navigation platform development at scale.
Drivers
Software-defined vehicle programs are converting navigation from a fixed head-unit feature into an updateable vehicle-service layer. Automakers expanded centralized computing, over-the-air software deployment, and connected-cockpit displays across new vehicle architectures during 2024 and 2025. This structural shift moves supplier economics from one-time embedded-map licensing toward recurring map refresh, live-traffic, and premium guidance subscriptions, supporting an estimated +1.6% incremental contribution to the 10.4% baseline CAGR.
A software-defined architecture can reduce model-specific infotainment integration work by roughly 20% to 35% through common software stacks while enabling feature deployment after sale. This efficiency comes with higher cybersecurity engineering, cloud infrastructure, and lifecycle support costs. Suppliers that build scalable secure-by-design navigation platforms across vehicle programs with 5 to 10-year software-support commitments will capture the strongest recurring revenue positions over the forecast period.
| Driver | (~) % Impact on CAGR Forecast | Geographic Relevance | Impact Timeline |
|---|---|---|---|
| Software-defined vehicle adoption | +1.6% | North America, Europe, China, Japan, South Korea | Medium term (2–4 years) |
| ADAS-linked routing demand | +1.4% | Europe, North America, China, premium APAC | Short term (≤ 2 years) |
| EV energy-route integration | +1.3% | China, Europe, North America, Japan | Short term (≤ 2 years) |
| Embedded connectivity penetration | +1.2% | China, North America, Europe, Gulf states | Short term (≤ 2 years) |
| Large-display cockpit standardization | +1.0% | China, North America, Europe, India | Medium term (2–4 years) |
| Safety-critical localization functions | +0.9% | Europe, North America, Japan, South Korea | Medium term (2–4 years) |
Restraints
Free or low-cost smartphone navigation projected through Apple CarPlay, Android Auto, or screen-mirroring interfaces constrains embedded navigation sales because many buyers regard handset-based routing as functionally adequate for routine journeys. Deleting embedded navigation can reduce hardware, storage, GPS antenna, map-content, validation, and warranty cost by an estimated 30% to 50% relative to a fully embedded configuration. Suppliers face lower factory-fit take rates and limited ability to recover recurring map-service expense on basic trims.
This direct substitution is estimated to remove about 1.8% from the attainable CAGR relative to the 10.4% baseline. Embedded systems retain structural advantages in vehicle-data access, safety-related integration, and offline reliability that phone projection cannot replicate. However, automakers may delay navigation-specific capital expenditure until buyers demonstrate willingness to pay for functions unavailable through phone-based alternatives.
| Restraint | (~) % Impact on CAGR Forecast | Geographic Relevance | Impact Timeline |
|---|---|---|---|
| Smartphone projection substitution | -1.8% | North America, Europe, India, Southeast Asia | Short term (≤ 2 years) |
| New-vehicle affordability pressure | -1.3% | India, Latin America, Africa, Southeast Asia | Short term (≤ 2 years) |
| Entry-trim feature decontenting | -1.1% | India, ASEAN, Latin America, Eastern Europe | Short term (≤ 2 years) |
| Embedded-map licensing costs | -0.9% | Global | Medium term (2–4 years) |
| Aftermarket installation decline | -0.7% | North America, Europe, Japan, Australia | Medium term (2–4 years) |
| Regional localization economics | -0.6% | India, Africa, Latin America, Middle East | Medium term (2–4 years) |
Challenges
Connected in-dash navigation units have become an expanding cyber-physical attack surface because they combine cellular connectivity, location histories, microphone-enabled interfaces, and vehicle-network access. UN Regulation No. 155 requires a certified cybersecurity management system for covered vehicle approvals in applicable markets. Cybersecurity engineering, compliance evidence, external testing, and post-launch patch operations can add an estimated 5% to 10% to software-development and validation expenditure.
A delayed approval or unremediated critical vulnerability can postpone a platform launch by several months, directly eroding supplier revenue timelines. Compliance obligations persist throughout a vehicle life that can exceed 10 years, creating a long-duration cost obligation beyond initial development. This sustained financial friction generates an estimated -1.4% drag on maximum growth potential, creating demand for suppliers offering pre-validated secure navigation software stacks.
| Challenge | (~) % CAGR Friction Drag | Geographic Relevance | Mitigation Horizon |
|---|---|---|---|
| Cybersecurity compliance burden | -1.4% | Europe, Japan, South Korea, North America, China | Medium term (2–4 years) |
| High-definition map upkeep | -1.2% | North America, Europe, China, Japan | Long term (≥ 4 years) |
| Semiconductor lifecycle mismatch | -1.0% | Global | Long term (≥ 4 years) |
| Fragmented vehicle data access | -0.9% | Europe, North America, China | Medium term (2–4 years) |
| Global GNSS vulnerability | -0.8% | Europe, Middle East, East Asia, North America | Long term (≥ 4 years) |
| Multilingual voice accuracy | -0.6% | India, ASEAN, Middle East, Africa, Latin America | Medium term (2–4 years) |
Opportunities
Fleet-specific navigation represents the highest-value adjacent market for in-dash navigation system suppliers. A deliberately built bundle can combine dispatch-aware routing, restricted-road compliance, parking availability, and predictive energy planning into a per-vehicle subscription. Standardizing fleet configuration and remote policy management can lower deployment and support cost per vehicle by an estimated 15% to 30%, while connected service packaging can lift lifetime software contribution by roughly 20% to 40% versus navigation hardware sold without commercial workflows.
Capturing this adjacent operational market requires fleet-management integrations, data-governance agreements, telematics interoperability, and channel partnerships. Successful execution could add approximately 1.7% above the 10.4% baseline CAGR without relying on consumer feature attach rates. Suppliers that deliver validated fleet navigation platforms before 2028 will secure multi-year telematics service contracts that are structurally difficult for later entrants to displace.
| Opportunity | (~) % Potential CAGR Upside | Geographic Relevance | Execution Window |
|---|---|---|---|
| Fleet navigation service bundles | +1.7% | North America, Europe, India, China, Gulf states | Medium term (2–4 years) |
| Usage-based insurance integration | +1.4% | North America, Europe, Japan, Australia | Medium term (2–4 years) |
| Parking and curb monetization | +1.2% | Europe, North America, China, Japan | Medium term (2–4 years) |
| Commercial EV route optimization | +1.1% | Europe, China, North America, India | Short term (≤ 2 years) |
| AR guidance premium tiers | +1.0% | China, Japan, South Korea, Europe, North America | Long term (≥ 4 years) |
| Emerging-market retrofit platforms | +0.8% | India, ASEAN, Latin America, Africa | Medium term (2–4 years) |
Key Company Insights
Gentex Corporation reported 2025 consolidated net sales of $2.53 billion, up 10% from $2.31 billion in 2024, though net income attributable to the company declined to $384.8 million from $404.5 million. The revenue growth signals successful integration of the VOXX acquisition, which contributed $78.8 million in Q2 2025. International Energy Agency data shows China sold more than 11 million electric cars in 2024, confirming the EV platform depth Gentex must serve to maintain its OEM positioning.
Magna International reported sales of $20.7 billion for the first six months of 2025, compared with $21.9 billion in the same period of 2024. Continental AG announced plans to invest more than $85 million at its Mount Pleasant, Iowa location in November 2025. Continental generated €19.7 billion in sales in 2025, employing approximately 76,000 people across 54 countries and markets, though Q3 2025 consolidated sales of €5.0 billion declined 0.9% from Q3 2024.
Key Players
- Gentex Corporation
- Magna International Inc.
- Samvardhana Motherson Reflectec
- Ficosa International S.A.
- Murakami Corporation
- MEKRA Lang GmbH & Co. KG
- Valeo S.A.
- Continental AG
- Ichikoh Industries, Ltd.
- Tokai Rika Co., Ltd.
- SL Corporation
- Mitsuba Corporation
- FLABEG Automotive Glass Group
- Lumax Industries Limited
- Ishizaki Honten Company, Ltd.
Recent Developments
- April 2025 – Gentex Corporation completed its acquisition of VOXX; VOXX contributed $78.8 million of revenue in Q2 2025.
- July 2025 – Gentex Corporation’s board authorized repurchase of an additional 40 million common shares, representing more than 18% of outstanding shares as of 30 June 2025.
- January 2026 – Gentex Corporation repurchased 13.6 million common shares at an average $23.48 per share, totaling $319.0 million, during 2025.
- December 2025 – The European Commission launched a €1.8 billion Battery Booster, including €1.5 billion of interest-free loans for European battery-cell producers.
- July 2026 – Continental AG agreed to sell its ContiTech group sector to a Lone Star Funds affiliate for €4.0 billion, plus performance-based consideration of up to €250 million.
Report Scope
| Report Features | Description |
|---|---|
| Market Value (2025) | USD 21.2 Billion |
| Forecast Revenue (2035) | USD 56.9 Billion |
| CAGR (2026-2035) | 10.4% |
| Base Year for Estimation | 2025 |
| Historic Period | 2020-2024 |
| Forecast Period | 2026-2035 |
| Report Coverage | Revenue Forecast, Market Dynamics, Market Opportunity Analysis, Technology and Innovation Landscape, Competitive Landscape, Recent Developments |
| Segments Covered | By Component (Display Unit, Control Module, Antenna Module, Wiring Harness), By Technology (2D Maps, 3D Maps), By Connectivity (Embedded, Tethered, Integrated/Smartphone), By Vehicle Type (Passenger Cars, Light Commercial Vehicles, Heavy Commercial Vehicles), By Propulsion (Internal Combustion Engine Vehicles, Electric Vehicles, Hybrid Vehicles), By Sales Channel (OEM, Aftermarket) |
| Regional Analysis | North America (US and Canada), Europe (Germany, France, The UK, Spain, Italy, and Rest of Europe), Asia Pacific (China, Japan, South Korea, India, Australia, and Rest of APAC), Latin America (Brazil, Mexico, and Rest of Latin America), Middle East and Africa (GCC, South Africa, and Rest of MEA) |
| Competitive Landscape | Gentex Corporation, Magna International Inc., Samvardhana Motherson Reflectec, Ficosa International S.A., Murakami Corporation, MEKRA Lang GmbH & Co. KG, Valeo S.A., Continental AG, Ichikoh Industries, Ltd., Tokai Rika Co., Ltd., SL Corporation, Mitsuba Corporation, FLABEG Automotive Glass Group, Lumax Industries Limited, Ishizaki Honten Company, Ltd. |
| Customization Scope | Customization for segments, region/country-level will be provided. Additional customization can be done based on requirements. |
| Purchase Options | We have three licenses to opt for: Single User License, Multi-User License (Up to 5 Users), Corporate Use License (Unlimited User and Printable PDF) |





































