


Report Overview
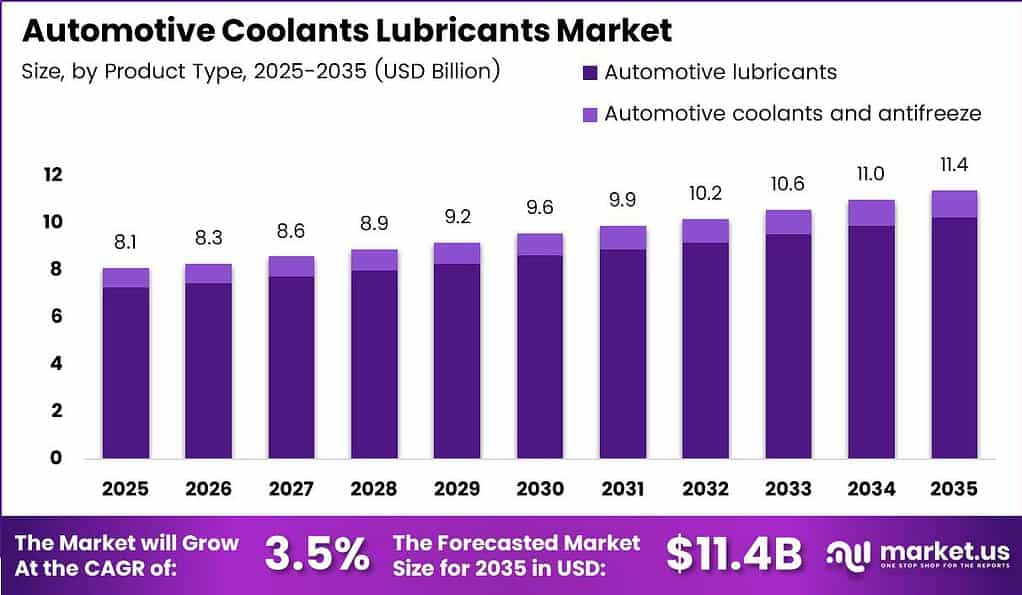
Global Automotive Coolants and Lubricants Market size is expected to be worth around USD 11.4 Billion by 2035 from USD 8.3 Billion in 2026, growing at a CAGR of 3.5% during the forecast period 2026 to 2035.
The automotive coolants and lubricants market covers fluid products that protect, cool, and reduce friction in vehicle powertrains and thermal systems. The market spans engine oils, transmission fluids, gear oils, brake fluids, greases, and antifreeze coolants. These products serve passenger cars, commercial vehicles, and two-wheelers across OEM factory-fill and independent aftermarket channels globally.
Key Takeaways
- The global automotive coolants and lubricants market was valued at USD 8.3 Billion in 2026 and is forecast to reach USD 11.4 Billion by 2035.
- The market is growing at a CAGR of 3.5% during the forecast period 2026 to 2035.
- By Product Type, Automotive Lubricants dominates with a 90.00% share in 2025.
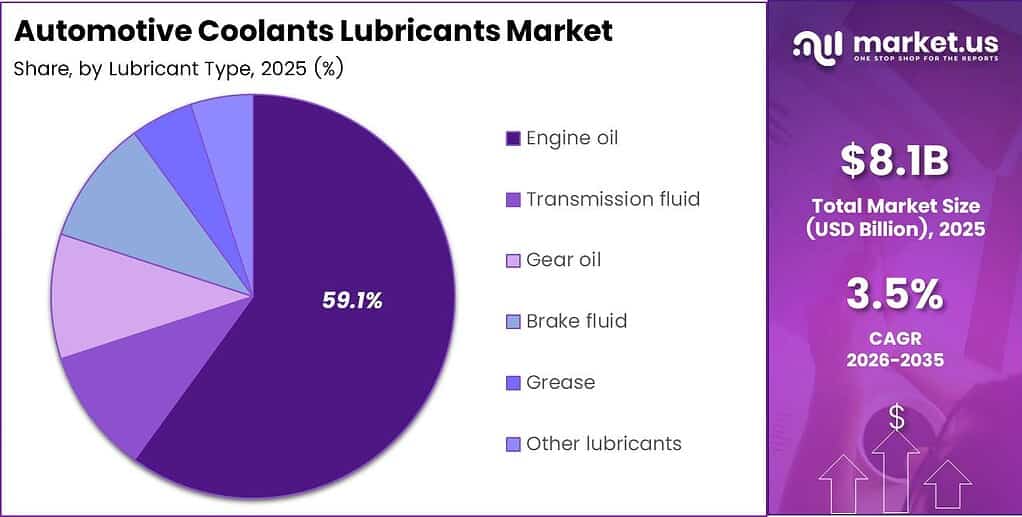
- By Lubricant Type, Engine Oil holds the leading position with a 59.10% share in 2025.
- By Vehicle Type, Passenger Cars account for the largest share at 53.00% in 2025.
- By Propulsion Type, Internal Combustion Engine Vehicles hold a dominant 85.20% share in 2025.
- By Sales Channel, the Aftermarket segment leads with a 68.00% share in 2025.
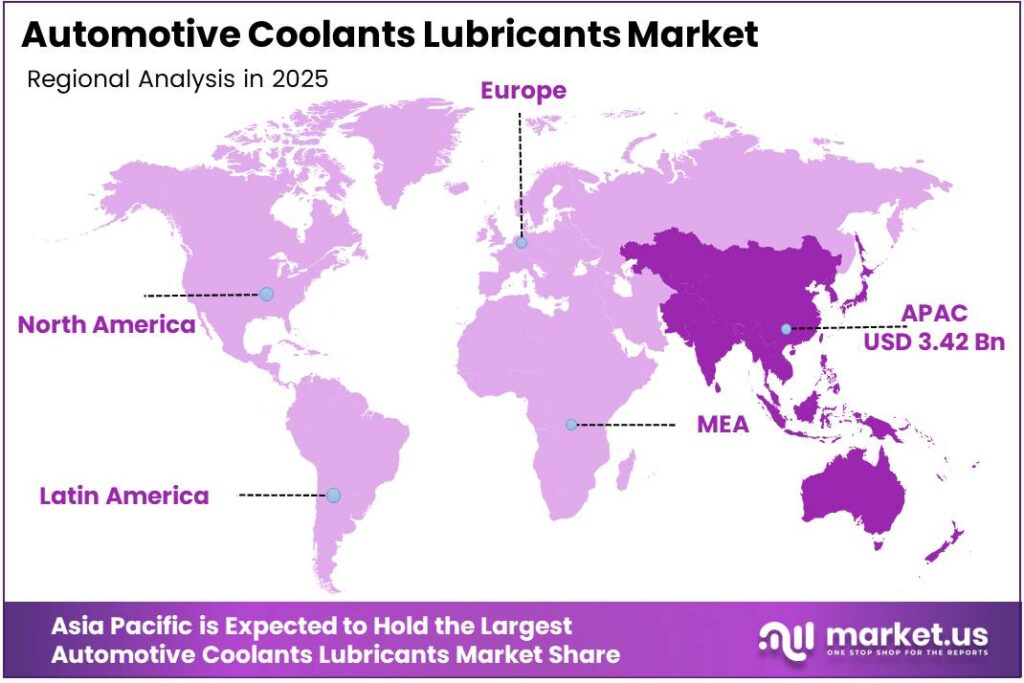
- Asia Pacific is the dominant region, holding 42.50% of global market share, valued at USD 3.42 Billion in 2025.
- Europe is the fastest-growing region during the forecast period.
As reported by the International Organization of Motor Vehicle Manufacturers, global motor-vehicle production rose from 92.7 million units in 2024 to 96.4 million units in 2025, a gain of 3.9%, while global sales reached 99.8 million units. This scale of vehicle activity directly underpins recurring fluid demand across both OEM factory-fill and aftermarket channels worldwide.
According to the International Energy Agency, electric vehicles displaced approximately 1.2 million barrels of oil demand per day in 2025. This structural shift compresses engine-oil volume growth and accelerates the need for thermal-management and e-drive fluid reformulation across major markets. In January 2025, the Shell-CNOOC joint venture CSPC approved a 1.6-million-tonne-per-year ethylene cracker and a 320,000-tonne-per-year specialty-chemicals facility, scheduled for completion in 2028, signaling upstream investment in next-generation fluid feedstocks.
Data from the World Trade Organization shows world trade in goods and commercial services increased 8% to USD 34.89 Trillion in 2025. Stronger trade flows support commercial fleet activity and logistics intensity, which sustains demand for heavy-duty lubricants, transmission fluids, and high-frequency coolant services across global freight corridors.
Product Type Analysis
Automotive Lubricants dominates with 90.00% due to universal engine-oil and fluid demand across all vehicle types.
In 2025, Automotive Lubricants held a dominant market position in the By Product Type segment of the Automotive Coolants and Lubricants Market, with a 90.00% share. This dominance reflects the sheer frequency of engine-oil, transmission-fluid, and gear-oil service cycles across global vehicle parc. Every combustion-powered vehicle requires recurring lubrication, making this sub-segment structurally insulated from short-term demand fluctuations.
Automotive Coolants and Antifreeze holds the remaining share within the Product Type segment. Thermal-management demand is rising as vehicle powertrains, including hybrid systems, generate higher heat loads requiring more frequent coolant maintenance. This positions coolant products as a growth opportunity even within a market dominated by lubricant volume.
Lubricant Type Analysis
Engine Oil dominates with 59.10% due to mandatory recurring service across all combustion-powered vehicles.
In 2025, Engine Oil held a dominant market position in the By Lubricant Type segment of the Automotive Coolants and Lubricants Market, with a 59.10% share. Engine oil commands this position because every internal combustion vehicle requires periodic oil changes at fixed mileage intervals. This mandatory consumption pattern creates predictable, recurring revenue for blenders and distributors regardless of economic cycles.
Transmission Fluid represents a structurally important secondary category within the lubricant type segment. Automatic transmission penetration across passenger cars and light commercial vehicles drives consistent transmission-fluid replacement demand. Blenders that secure OEM transmission-fluid approvals gain preferred supplier status and premium pricing access in both factory-fill and dealer service channels.
Gear Oil, Brake Fluid, and Grease together serve specialized drivetrain and safety-critical functions. These fluid categories carry higher technical specifications and narrower competitive fields. Other Lubricants, including specialty products for two-wheelers and industrial-adjacent vehicle applications, hold the remaining share and represent niche margin opportunities for focused suppliers.
Vehicle Type Analysis
Passenger Cars dominate with 53.00% due to the largest global vehicle parc across all regions.
In 2025, Passenger Cars held a dominant market position in the By Vehicle Type segment of the Automotive Coolants and Lubricants Market, with a 53.00% share. The global passenger-car fleet generates the highest aggregate fluid consumption through sheer volume and service frequency. Aftermarket service providers targeting this segment benefit from dense workshop networks and high consumer awareness of maintenance schedules.
Light Commercial Vehicles represent a high-value secondary segment driven by last-mile delivery and logistics fleet expansion. These vehicles operate under heavier duty cycles than passenger cars, accelerating lubricant degradation and increasing service frequency. Suppliers that formulate specifically for light commercial applications capture premium positioning within the broader vehicle-type segment.
Heavy Commercial Vehicles generate intensive lubricant consumption through long operating hours and high thermal loads. Two-Wheelers form a distinct and rapidly expanding sub-segment. As reported by SIAM, Indian two-wheeler sales reached 19.6 million units in FY2024-25, increasing 9.1%, and reached 5.56 million units in Q2 FY2025-26, a further gain of 7.4%. This volume positions India as a critical two-wheeler lubricant growth corridor for regional blenders.
Propulsion Type Analysis
Internal Combustion Engine Vehicles dominate with 85.20% due to the entrenched global combustion-powered vehicle fleet.
In 2025, Internal Combustion Engine Vehicles held a dominant market position in the By Propulsion Type segment of the Automotive Coolants and Lubricants Market, with a 85.20% share. The global installed base of combustion-powered vehicles sustains high-volume engine-oil demand across all geographies. This concentration of share gives traditional lubricant blenders a large, stable revenue base through at least the medium term of the forecast period.
Hybrid Vehicles represent a transitional but growing propulsion category with distinct fluid needs. As per the European Automobile Manufacturers’ Association, EU hybrid-electric car registrations reached 3,733,325 units in 2025, while hybrid, battery-electric, and plug-in hybrid vehicles represented approximately 22% of US light-duty vehicle sales in 2025, up from 20% in 2024. Hybrid platforms require both conventional engine lubrication and specialized e-drive fluids, expanding per-vehicle fluid complexity.
Electric Vehicles are reshaping the propulsion segment at a structurally significant pace. Data from the International Energy Agency shows global electric-car sales increased 20% to more than 20 million units in 2025, representing 25% of new-car sales. The European Automobile Manufacturers’ Association reported 1,880,370 battery-electric cars registered in the EU in 2025, holding a 17.4% market share. These volumes remove engine-oil demand while creating new thermal-management and battery-cooling fluid opportunities.
Sales Channel Analysis
Aftermarket dominates with 68.00% due to high-frequency independent service events across the global vehicle parc.
In 2025, the Aftermarket held a dominant market position in the By Sales Channel segment of the Automotive Coolants and Lubricants Market, with a 68.00% share. Independent workshops, fast-fit chains, and retail auto parts outlets collectively process the majority of fluid service events globally. This channel structure gives blenders and distributors direct access to consumer purchasing decisions outside OEM-controlled service networks.
The OEM channel serves factory-fill requirements at vehicle assembly and authorized dealer service centers. OEM partnerships carry strict approval requirements and lower unit margins, but they provide volume stability and brand endorsement through OEM certification listings. In October 2025, PFX Group introduced a one-quart Prestone antifreeze-and-coolant pouch using 60% less plastic than a traditional bottle, demonstrating how aftermarket pack innovation can create differentiation and sustainability compliance advantages within retail channels.
Key Market Segments
By Product Type
- Automotive Lubricants
- Automotive Coolants and Antifreeze
By Lubricant Type
- Engine Oil
- Transmission Fluid
- Gear Oil
- Brake Fluid
- Grease
- Other Lubricants
By Vehicle Type
- Passenger Cars
- Light Commercial Vehicles
- Heavy Commercial Vehicles
- Two-Wheelers
By Propulsion Type
- Internal Combustion Engine Vehicles
- Hybrid Vehicles
- Electric Vehicles
By Sales Channel
- Original Equipment Manufacturer (OEM)
- Aftermarket
Regional Analysis
Asia Pacific Dominates the Automotive Coolants and Lubricants Market with a Market Share of 42.50%, Valued at USD 3.42 Billion
Asia Pacific commands the largest regional share at 42.50%, supported by the region’s dense vehicle parc, high two-wheeler penetration, and large commercial fleet base across China, India, Japan, and South Korea. As per SIAM data, Indian two-wheeler exports increased 21.4% to 4.2 million units in FY2024-25, reflecting the expansion of vehicle demand that directly sustains lubricant consumption at scale. This regional concentration gives Asia Pacific-focused suppliers structural volume advantages and preferred positioning in high-growth sub-markets.
Europe is the fastest-growing region during the forecast period. The region’s accelerating EV and hybrid vehicle penetration is reshaping fluid demand from conventional engine oils toward e-drive lubricants, thermal-management fluids, and low-electrical-conductivity coolants. As reported by the European Automobile Manufacturers’ Association, EU new-car registrations increased 1.8% in 2025. In November 2025, ENEOS launched North American transmission-fluid and hybrid/EV compressor-oil products including a 250-millilitre POE-compatible compressor oil, signaling supplier investment in electrification-driven fluid categories targeting developed markets.
North America maintains a structurally significant position driven by a large aging vehicle fleet and high aftermarket service penetration. Hybrid, battery-electric, and plug-in hybrid vehicles represented approximately 22% of US light-duty vehicle sales in 2025, up from 20% in 2024. This electrification trend is compressing engine-oil volume in the US while opening demand for EV-specific thermal and drivetrain fluids. Latin America, Middle East and Africa, and the remaining Asia Pacific markets collectively represent the next tier of volume opportunity for blenders expanding distribution reach.
Key Regions and Countries
North America
- US
- Canada
Europe
- Germany
- France
- The UK
- Spain
- Italy
- Rest of Europe
Asia Pacific
- China
- Japan
- South Korea
- India
- Australia
- Rest of APAC
Latin America
- Brazil
- Mexico
- Rest of Latin America
Middle East and Africa
- GCC
- South Africa
- Rest of MEA
Pricing Analysis
Automotive lubricant pricing stratifies across three tiers: conventional mineral oils, semi-synthetic blends, and full-synthetic products. Full-synthetic engine oils command the highest retail price points, driven by Group III and Group IV base-oil costs and OEM-mandated viscosity specifications such as 0W-20 and 0W-16 grades. Suppliers that secure OEM factory-fill approvals for synthetic grades lock in premium pricing and reduce direct price competition with commodity mineral-oil blenders in the aftermarket.
Coolant pricing follows chemistry type, with Organic Acid Technology and hybrid OAT formulations priced above conventional green coolants due to longer service-life claims and OEM compatibility requirements. Feedstock cost volatility, particularly in base-oil Group II and Group III supply, compresses blender margins when crude prices rise without corresponding retail price increases. As per our research, suppliers with backward integration into base-oil refining or re-refining capacity structurally outperform pure blenders on margin stability across price cycles.
Supply Chain and Raw Material Analysis
Base oils form the largest cost input in lubricant manufacturing, typically representing 70% to 80% of finished-product cost depending on grade and formulation. Group II and Group III base oils, refined from crude oil through hydroprocessing, dominate modern passenger-car engine-oil formulations. Supply concentration in Group III production across South Korea, the Middle East, and Europe creates geographic sourcing risk for blenders operating in high-volume markets without regional base-oil supply agreements.
Additive packages, including viscosity modifiers, detergents, dispersants, and antiwear agents, are sourced from a concentrated group of global specialty-chemical suppliers. This supply concentration creates a -0.30% CAGR friction drag as identified in the Challenges section, limiting blender flexibility to reformulate quickly in response to new OEM specifications. As per our research, suppliers that establish dual-source additive agreements and maintain safety-stock inventory buffers reduce commercialization risk when specification transitions compress qualification timelines.
Regulatory and Compliance Landscape
The API and ILSAC jointly govern engine-oil quality standards across North America, with ILSAC GF-7 and API SQ licensing commencing on March 31, 2025. GF-6A products ceased qualifying for new Starburst licensing after March 31, 2026, forcing blenders to complete formulation revalidation, additive requalification, and packaging transitions within compressed commercial windows. Suppliers that fail to achieve GF-7 approval face delisting from OEM service-fill programs and retail shelf displacement in North American channels.
In China, GB 29743.2-2025 established new low-electrical-conductivity coolant standards effective October 1, 2025, specifically targeting EV thermal-management fluid performance. European emission and sustainability regulations are pushing OEM specifications toward lower-viscosity, fuel-economy-optimized lubricant grades and bio-based or re-refined content thresholds. Consequently, suppliers operating across multiple geographies must maintain parallel compliance programs, which increases formulation-management overhead and favors larger integrated producers with dedicated regulatory affairs capabilities over smaller regional blenders.
Investment and M&A Activity
The aftermarket service-center channel attracted significant acquisition capital during 2025, with Valvoline signing an agreement in February 2025 to acquire nearly 200 Breeze Autocare stores across 17 states for approximately USD 625 Million, then completing the transaction in December 2025 at a net purchase price of USD 593 Million covering 162 net stores. This consolidation signals that scale in quick-lube retail is now a strategic priority for lubricant-adjacent companies seeking to control the consumer service touchpoint rather than compete solely on fluid brand at wholesale.
Upstream and adjacency investments are reshaping the competitive boundaries of the lubricants market beyond fluid blending. Shell’s Baytown re-refining facility, completed March 31, 2025 with a 5,000-barrel-per-day used-oil processing capacity, demonstrates capital commitment to circular supply-chain infrastructure. Idemitsu’s approval of a JPY 21.3 Billion lithium-sulfide battery-material facility in February 2025, targeting 3 GWh of annual capacity, reflects how traditional lubricant producers are allocating capital toward electrification-adjacent materials. This investment pattern indicates that M&A and capex in this market are shifting from blending-capacity expansion toward distribution control, sustainability infrastructure, and next-generation energy-material adjacencies.
Market Dynamics
Market Opportunity Analysis - Underserved segments and regional gaps offer entry points across vehicle types and geographies
The Two-Wheeler sub-segment within the Vehicle Type segment represents one of the most underexploited volume opportunities for specialized lubricant suppliers. India’s two-wheeler parc is expanding rapidly, but branded lubricant penetration in tier-2 and tier-3 cities remains low relative to the size of the vehicle base. Blenders that establish dedicated two-wheeler formulation lines and regional distribution infrastructure can capture recurring service volume before integrated oil majors deepen their retail presence.
The Electric Vehicle propulsion sub-segment holds a structural entry point for fluid companies that move early on thermal-management and e-drive products. EV-specific coolant and drivetrain fluid categories remain underdeveloped relative to the pace of EV fleet growth, and most of the current market volume still concentrates in conventional ICE lubricants. Suppliers that secure early OEM approval listings for EV-compatible fluid products position themselves ahead of the volume inflection in EV-specific aftermarket services.
The Hybrid Vehicle sub-segment creates a dual-fluid demand profile that neither pure ICE lubricant suppliers nor pure EV fluid specialists are fully equipped to serve. Hybrid powertrains require conventional engine lubrication alongside e-drive and thermal-management fluids within the same vehicle. This creates a product bundling opportunity for suppliers with cross-category formulation capability, particularly in Europe and the US where hybrid vehicle penetration is accelerating fastest.
The OEM sales channel remains underutilized by mid-tier suppliers relative to its strategic value. Securing OEM factory-fill approval converts a supplier from a commodity aftermarket vendor into a brand endorsed by the vehicle manufacturer. This certification creates downstream pull in dealer service networks and raises switching costs for fleet procurement managers who align their replenishment purchasing with OEM-approved fluid specifications.
Technology and Innovation Landscape - EV thermal fluids, re-refining, subscription analytics, and sustainable packaging redefine product and service competition
Low-electrical-conductivity coolant technology is emerging as a distinct formulation category serving battery-electric and hybrid powertrains. BASF developed GLYSANTIN ELECTRIFIED coolants compliant with Chinese standard GB 29743.2-2025, demonstrating that regulatory alignment is now a primary product differentiator in EV thermal-management fluids. Suppliers that build compliance-ready formulation platforms for major EV markets gain first-mover access to OEM thermal-management contracts before the category becomes commoditized.
Re-refining technology is converting waste motor oil into a commercially viable base-oil supply stream. The Baytown facility completed by Shell’s Pennzoil-Quaker State subsidiary and Blue Tide processes 5,000 barrels of used motor oil per day, demonstrating industrial-scale viability of closed-loop lubricant production. This technology reduces feedstock cost exposure to crude-oil price cycles and supports sustainability claims that are becoming mandatory for OEM supply contracts in Europe and North America.
Condition-based fluid monitoring through integrated telematics and oil-quality sensors is shifting fluid service from calendar intervals to real-time vehicle-condition data. Predictive maintenance systems that monitor oil degradation, coolant temperature, and fluid chemistry enable suppliers to offer subscription-based service contracts anchored to uptime guarantees. This technology shifts supplier revenue from transactional per-liter sales toward recurring contracted service income with higher gross margin potential.
Sustainable packaging innovation is becoming a competitive differentiator in aftermarket retail channels. PFX Group’s one-quart Prestone pouch uses 60% less plastic than conventional bottles, reducing material cost and meeting retailer sustainability requirements. POE-compatible compressor oils developed by ENEOS for hybrid and EV applications illustrate how fluid chemistry must now accommodate new refrigerant and compressor-system demands created by electrification. Suppliers that integrate packaging and formulation sustainability into product development cycles gain shelf-access advantages with environmentally regulated retail buyers.
Drivers
Delayed vehicle replacement is expanding the population of vehicles requiring recurring fluid services globally. The EU passenger-car fleet approached 256 million vehicles in 2024, reaching an average age of 12.7 years, while the average US light vehicle reached 12.8 years in 2025. At this scale, even a 1% rise in annual fluid-service incidence generates millions of additional workshop events, shifting supplier economics toward recurring aftermarket sales and high-mileage formulations.
Manufacturers that respond with targeted high-mileage packs, cooling-system service kits, and workshop replenishment programs capture the estimated +0.65% CAGR contribution from aging vehicle stock. These products typically carry stronger unit margins than bulk factory-fill contracts. As a result, the aging vehicle parc is shifting the market’s center of gravity from first-fill OEM volume toward higher-margin recurring aftermarket revenue.
| Driver | (~) % Impact on CAGR Forecast | Geographic Relevance | Impact Timeline |
|---|---|---|---|
| Aging Vehicle Parc | +0.65% | Global | Short term (≤ 2 years) |
| Expanding Vehicle Stock | +0.45% | Asia-Pacific, Latin America | Medium term (2–4 years) |
| Commercial Fleet Utilization | +0.35% | Global logistics corridors | Short term (≤ 2 years) |
| Hot-Climate Thermal Stress | +0.30% | Asia-Pacific, Middle East, Africa | Medium term (2–4 years) |
| Synthetic Lubricant Premiumization | +0.20% | North America, Europe, East Asia | Medium term (2–4 years) |
Restraints
Battery-electric vehicles eliminate recurring crankcase-oil replacement, removing multiple high-frequency lubricant transactions per vehicle over its operating life. Worldwide electric-car sales exceeded 17 million units in 2024 after rising more than 25%. Each BEV replacing a combustion vehicle removes an estimated 4 to 6 liters of engine oil per service cycle at intervals of approximately 10,000 to 15,000 kilometers, while incremental e-drive and battery-cooling fluids replace only part of that lost volume.
The resulting -0.75% CAGR deduction concentrates pressure on passenger-car engine-oil portfolios and compresses blending-asset utilization. This means suppliers must commit reformulation capital to thermal-management products before EV-specific fluid categories achieve sufficient scale to offset lost engine-oil throughput. Feedstock price volatility, extended drain intervals, and OEM-captive service channels apply additional downward pressure across developed markets.
| Restraint | (~) % Impact on CAGR Forecast | Geographic Relevance | Impact Timeline |
|---|---|---|---|
| BEV Engine-Oil Displacement | -0.75% | China, Europe, North America | Medium term (2–4 years) |
| Feedstock Price Volatility | -0.40% | Global | Short term (≤ 2 years) |
| Extended Drain Intervals | -0.25% | Developed automotive markets | Medium term (2–4 years) |
| OEM-Captive Service Channels | -0.20% | Europe, East Asia, North America | Medium term (2–4 years) |
| Aftermarket Price Sensitivity | -0.15% | Emerging markets | Short term (≤ 2 years) |
Challenges
Powertrain diversification is multiplying viscosity grades, coolant chemistries, and manufacturer-specific fluid approvals at an accelerating pace. ILSAC GF-7 and API SQ licensing began on March 31, 2025, while GF-6A products ceased qualifying for new Starburst licensing after March 31, 2026. These qualification cycles force suppliers to continuously revalidate formulations, repackage products, and update labeling within compressed timelines driven by OEM approval calendars.
For smaller suppliers, the cost of meeting fragmented OEM specifications can increase formulation-launch expenditure by an estimated 10% to 18%, extend commercialization timelines by 60 to 120 days, and expose 1% to 3% of affected inventory to discounting or obsolescence risk. This specification complexity creates a revenue opportunity for suppliers that invest in modular formulation platforms, digital vehicle-to-fluid matching tools, and shared regional testing infrastructure to reduce per-SKU qualification cost and compress time-to-market.
| Challenge | (~) % CAGR Friction Drag | Geographic Relevance | Mitigation Horizon |
|---|---|---|---|
| Fragmented OEM Fluid Specifications | -0.50% | Global | Medium term (2–4 years) |
| Additive-Package Supply Concentration | -0.30% | Global blending hubs | Medium term (2–4 years) |
| Coolant Chemistry Incompatibility | -0.20% | Global aftermarket | Long term (≥ 4 years) |
| Aftermarket Technician Capability Gaps | -0.15% | Asia-Pacific, Africa, Latin America | Long term (≥ 4 years) |
| Independent-Channel Demand Opacity | -0.10% | Fragmented emerging markets | Medium term (2–4 years) |
Opportunities
Most automotive fluids are still monetized per liter or through fixed service intervals rather than through vehicle-condition data and recurring fleet subscriptions. Official maintenance benchmarks indicate that predictive maintenance programs can deliver 8% to 12% savings over preventive-only approaches, reduce maintenance costs by 25% to 30%, and lower downtime by 35% to 45%. These figures provide a quantitative commercial basis for integrating oil-quality sensors, coolant-temperature analytics, and automated replenishment into fleet service contracts.
A supplier converting an estimated 15% to 25% of participating fleet revenue into subscription contracts could reduce per-vehicle fluid-service cost by approximately 8% to 12%, while expanding supplier gross margin by 3 to 6 percentage points through bundled laboratory analysis and optimized change intervals. This model captures the estimated +0.45% CAGR upside and requires telematics integration and fleet-management partnerships rather than simply expanding packaged-fluid distribution.
| Opportunity | (~) % Potential CAGR Upside | Geographic Relevance | Execution Window |
|---|---|---|---|
| Condition-Based Fluid Subscriptions | +0.45% | Global commercial fleets | Medium term (2–4 years) |
| Closed-Loop Re-Refined Products | +0.35% | Europe, North America, East Asia | Long term (≥ 4 years) |
| Off-Highway Fleet Adjacency | +0.30% | Mining and agricultural economies | Medium term (2–4 years) |
| Fuel-Cell Thermal-Fluid Platforms | +0.20% | East Asia, Europe, North America | Long term (≥ 4 years) |
| Formulation Licensing Partnerships | +0.15% | Africa, Southeast Asia, Latin America | Medium term (2–4 years) |
Key Company Insights
Shell plc reported adjusted earnings of USD 18.5 Billion and operating cash flow of USD 42.9 Billion in 2025. This cash generation scale gives Shell the capital to sustain OEM approval programs, expand its re-refining infrastructure, and absorb short-term lubricant margin compression driven by EV displacement. In January 2025, the Shell-CNOOC joint venture CSPC approved a 1.6-million-tonne-per-year ethylene cracker and a 320,000-tonne-per-year specialty-chemicals facility scheduled for 2028 completion.
ExxonMobil Corporation reported earnings of USD 28.8 Billion and shareholder distributions of USD 37.2 Billion in 2025, reflecting strong cash conversion across its integrated energy and chemicals portfolio. ExxonMobil’s Mobil 1 brand holds deep OEM endorsement across global passenger-car and commercial-vehicle platforms. This approval depth creates switching costs for fleet operators and sustains premium pricing power in developed aftermarket channels. As per our research, world oil demand was forecast to increase by 740,000 barrels per day in 2025, supporting base lubricant feedstock throughput for large integrated producers.
FUCHS SE generated EUR 3.563 Billion in sales revenue in 2025, with EUR 2.048 Billion from EMEA and EUR 1.002 Billion from Asia Pacific, demonstrating broad regional diversification. Castrol India (a BP plc subsidiary) generated INR 5,722 Crore in revenue from operations in 2025, up from INR 5,365 Crore in 2024, marking its highest-ever annual revenue and reflecting strong aftermarket penetration in India’s two-wheeler and passenger-car segments.
In February 2025, Valvoline signed an agreement to acquire nearly 200 Breeze Autocare stores across 17 states for approximately USD 625 Million, accelerating its service-center network scale in the US aftermarket. Figures from the International Energy Agency show global refinery throughput was forecast to average 83.5 million barrels per day in 2025, supporting base-oil supply volumes for large-scale blenders.
TotalEnergies SE reported adjusted net income of USD 15.6 Billion and cash flow of USD 27.8 Billion in 2025, providing the financial base to invest in next-generation synthetic and bio-based lubricant formulations. Chevron Corporation reported Q4 2025 earnings of USD 2.8 Billion, compared with USD 3.2 Billion in Q4 2024, reflecting margin pressure in downstream operations that is prompting portfolio optimization across lubricant product lines.
Key Players
- Shell plc
- Exxon Mobil Corporation
- BP plc / Castrol
- Chevron Corporation
- TotalEnergies SE
- China Petroleum & Chemical Corporation — Sinopec
- China National Petroleum Corporation / PetroChina
- ENEOS Corporation
- Idemitsu Kosan Co., Ltd.
- FUCHS SE
- PETRONAS Lubricants International
- Valvoline Global Operations / Aramco
- LUKOIL Lubricants Company
- BASF SE
- Recochem Inc. / Prestone
Recent Developments
- December 1, 2025 – Valvoline completed the acquisition of Breeze Autocare, covering a net 162 stores at a net purchase price of USD 593 Million, expanding its US quick-lube service network.
- March 31, 2025 – Shell subsidiary Pennzoil-Quaker State and Blue Tide completed a Baytown re-refining facility capable of processing 5,000 barrels of used motor oil per day, scaling circular lubricant supply in North America.
- September 10, 2025 – BASF launched GLYSANTIN ELECTRIFIED low-electrical-conductivity coolants compliant with Chinese standard GB 29743.2-2025, effective October 1, 2025, targeting the EV thermal-management fluid segment in China.
- February 27, 2025 – Idemitsu approved a JPY 21.3 Billion lithium-sulfide facility with annual capacity of 3 GWh, a maximum government grant of JPY 7.1 Billion, and a target completion date of June 2027, signaling battery-material diversification beyond traditional lubricant operations.
Report Scope
| Report Features | Description |
|---|---|
| Market Value (2026) | USD 8.3 Billion |
| Forecast Revenue (2035) | USD 11.4 Billion |
| CAGR (2026-2035) | 3.5% |
| Base Year for Estimation | 2025 |
| Historic Period | 2020-2024 |
| Forecast Period | 2026-2035 |
| Report Coverage | Revenue Forecast, Market Dynamics, Market Opportunity Analysis, Technology and Innovation Landscape, Competitive Landscape, Recent Developments |
| Segments Covered | By Product Type (Automotive Lubricants, Automotive Coolants and Antifreeze), By Lubricant Type (Engine Oil, Transmission Fluid, Gear Oil, Brake Fluid, Grease, Other Lubricants), By Vehicle Type (Passenger Cars, Light Commercial Vehicles, Heavy Commercial Vehicles, Two-Wheelers), By Propulsion Type (Internal Combustion Engine Vehicles, Hybrid Vehicles, Electric Vehicles), By Sales Channel (Original Equipment Manufacturer (OEM), Aftermarket) |
| Regional Analysis | North America (US and Canada), Europe (Germany, France, The UK, Spain, Italy, and Rest of Europe), Asia Pacific (China, Japan, South Korea, India, Australia, and Rest of APAC), Latin America (Brazil, Mexico, and Rest of Latin America), Middle East and Africa (GCC, South Africa, and Rest of MEA) |
| Competitive Landscape | Shell plc, Exxon Mobil Corporation, BP plc / Castrol, Chevron Corporation, TotalEnergies SE, China Petroleum & Chemical Corporation (Sinopec), China National Petroleum Corporation / PetroChina, ENEOS Corporation, Idemitsu Kosan Co., Ltd., FUCHS SE, PETRONAS Lubricants International, Valvoline Global Operations / Aramco, LUKOIL Lubricants Company, BASF SE, Recochem Inc. / Prestone |
| Customization Scope | Customization for segments, region/country-level will be provided. Additional customization can be done based on requirements. |
| Purchase Options | We have three licenses to opt for: Single User License, Multi-User License (Up to 5 Users), Corporate Use License (Unlimited User and Printable PDF) |





































