


Report Overview
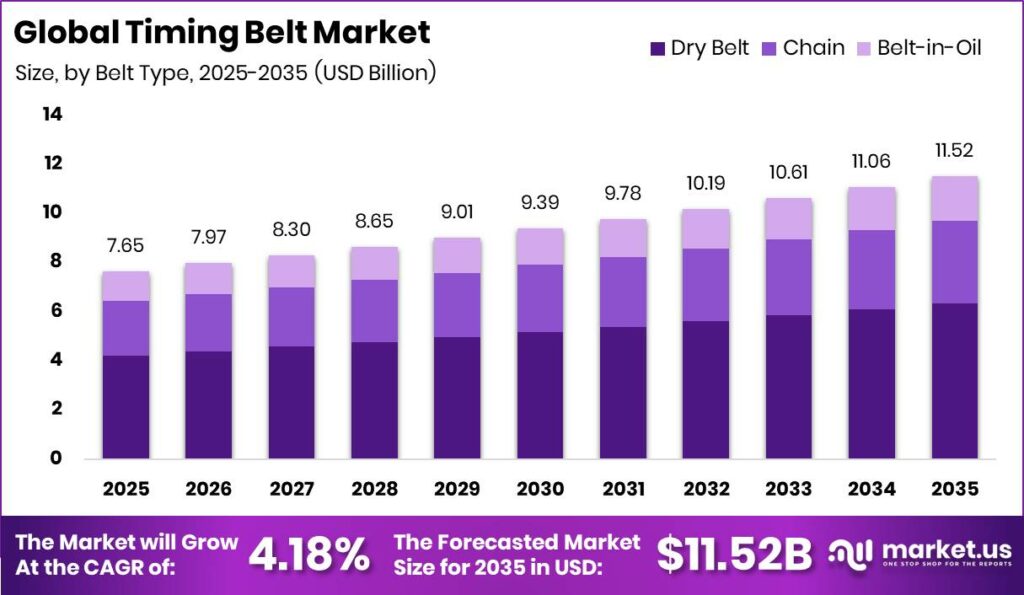
Global Timing Belt Market size is expected to be worth around USD 11.52 Billion by 2035 from USD 7.65 Billion in 2025, growing at a CAGR of 4.18% during the forecast period 2026 to 2035. Therefore, capital allocators treat this category as a steady replacement and first-fit franchise rather than a speculative growth story.
The Timing Belt Market covers synchronous belts and related drive hardware that keep camshaft and crankshaft rotation locked in internal combustion and hybrid engines. Product structure spans belt type, tensioning and idle hardware, vehicle class, and OEM versus replacement channels. This structure lets suppliers price engineered wet systems separately from commodity dry belts.
Key Takeaways
- The market is valued at USD 7.65 Billion in 2025 and is projected to reach USD 11.52 Billion by 2035 at a CAGR of 4.18%.
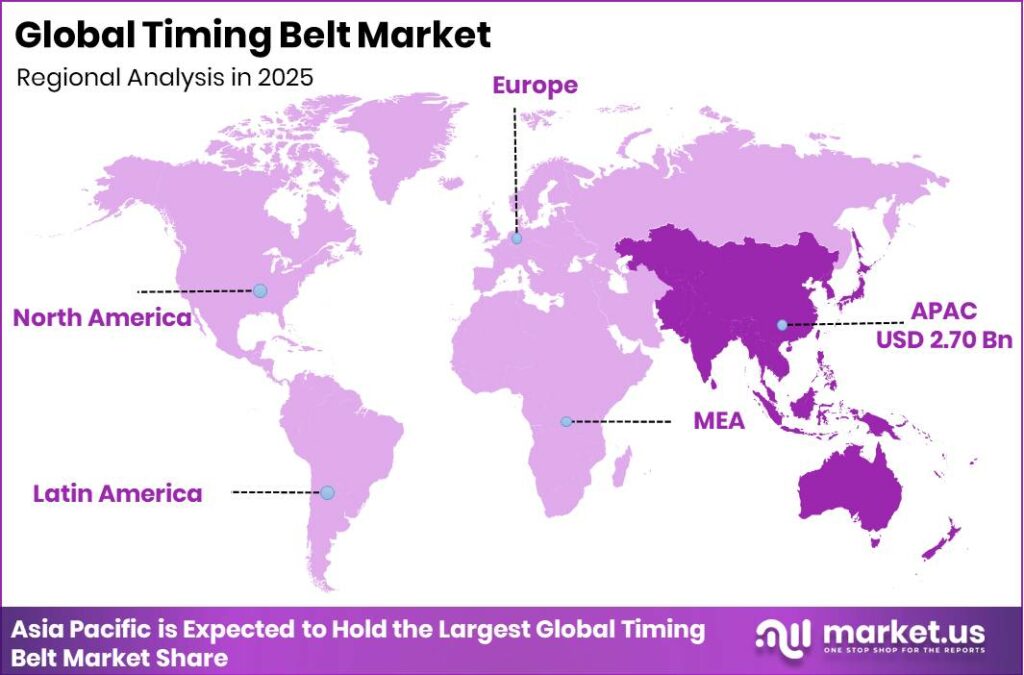
- Asia Pacific leads with a 35.30% share, equal to about USD 2.70 Billion in 2025.
- Dry Belt leads By Belt Type with a 55.10% share.
- Tensioner leads By Component with a 45.20% share.
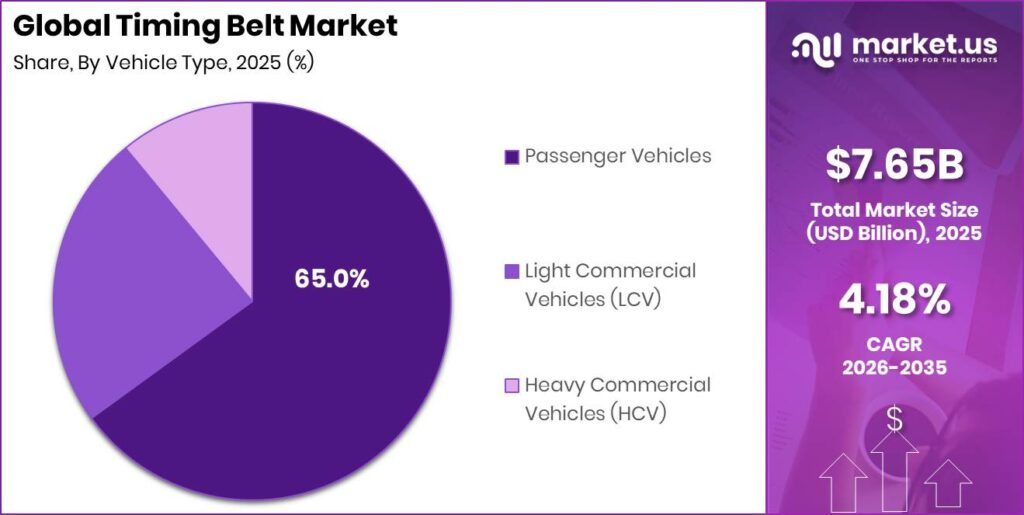
- Passenger Vehicles lead By Vehicle Type with a 65.00% share.
- OEM leads By Distribution Channel with a 74.10% share.
As per our research, up to 70% of recorded engine failures in certain workshops link to timing belt wear, misalignment, or missed replacement. This failure concentration pushes fleets and dealers toward kit-based service packages. Suppliers who bundle belt, tensioner, and idler capture higher ticket value per bay visit.
According to a 2025 automotive timing belt replacement guide, preventive replacement is advised every 72 months even when mileage limits are not yet reached. This age rule stabilizes aftermarket pull-through independent of annual kilometers driven. Consequently, distributors can forecast kit demand on calendar cohorts rather than only odometer bands.
A technical maintenance sheet specifies first inspection at 90,000 km and follow-up checks every 30,000 km thereafter. Structured condition-based intervals raise shop labor attach rates for tension and alignment checks. This means service networks that train technicians on interval discipline lock recurring parts revenue before catastrophic belt breakage.
Belt Type Analysis
Dry Belt dominates with 55.10% due to broad installed ICE base.
In 2025, Dry Belt held a dominant market position in the By Belt Type segment of Timing Belt Market, with a 55.10% share. OICA data show global vehicle production rose to 96.4 million units in 2025 from 92.7 million in 2024. High dry-belt penetration on legacy engines keeps first-fit and replacement volumes large. Vendors who defend dry SKU breadth protect volume while wet systems lift mix.
Chain systems act as the fastest-growing belt-type alternative where OEMs want longer service life and lower stretch risk. Global motor vehicle output near 96.4 million units in 2025 still leaves large chain-ready gasoline and diesel platforms in production. Chains raise content value per engine versus basic dry rubber. Suppliers with chain kit depth win platforms that exit dry belt specifications.
Belt-in-Oil systems serve friction-cut and emissions-driven engine designs that run the belt inside the oil bath. IEA tracking places electric car sales above 20 million units in 2025, yet hybrid and efficient ICE still need wet-belt hardware. Higher elastomer grade lifts average selling price per vehicle. Early movers on wet SKUs gain margin even when pure BEV share rises.
Component Analysis
Tensioner dominates with 45.20% due to mandatory load control function.
In 2025, Tensioner held a dominant market position in the By Component segment of Timing Belt Market, with a 45.20% share. Industry guides treat tension loss of 15% below specification as a work-order trigger on critical drives. Correct tension prevents tooth jump and early belt wear. Suppliers who sell matched tensioner-belt kits raise attach rate and cut comeback claims.
Idler pulleys form the fastest-growing component line as multi-point routing and dual-idler layouts spread on downsized engines. Predictive-maintenance programs in related belt drives report unplanned downtime cuts near 40% when routing hardware is monitored with the belt. Idlers fail from bearing wear even when the belt looks intact. Aftermarket kits that include idlers capture full system replacement spend.
Timing shield and cover parts protect the drive from debris and oil splash while supporting noise and safety rules. Manufacturing routes often target above 95% completion on inspection of belt, alignment, and thermal signatures. Covers that simplify service access reduce bay time. OEMs favor modular cover designs that speed line assembly and field service.
Sprocket hardware transfers torque between crank, cam, and accessory paths and wears with chain or belt tooth profiles. Top-risk asset rules often put 20% of belt-driven assets behind 80% of failure exposure in industrial analogs. Matched sprocket geometry extends belt life. Component makers who certify sprocket-belt pairs reduce warranty disputes.
Vehicle Type Analysis
Passenger Vehicles dominates with 65.00% due to high global car output.
In 2025, Passenger Vehicles held a dominant market position in the By Vehicle Type segment of Timing Belt Market, with a 65.00% share. OICA-linked tallies place passenger cars near 67 million of roughly 92 million total vehicles in a recent full production year. Dense car parc multiplies scheduled belt jobs. Brands that cover high-volume passenger platforms secure durable OEM and service pull.
Light Commercial Vehicles are the fastest-growing vehicle class for timing content as delivery and urban fleet mileage rises. Global vehicle sales reached about 99.8 million units in 2025, lifting light work-van and pickup utilization. Higher annual kilometers pull replacement earlier than private cars. Fleet contracts favor suppliers with LCV-specific kit coverage and bulk logistics.
Heavy Commercial Vehicles use heavy-duty timing or chain solutions under high torque and long duty cycles. Commercial vehicle production sits near 25 million units in recent OICA-scale global splits. Downtime cost on trucks justifies premium belts and tensioners. Suppliers who certify HCV duty ratings win tendered fleet and OEM truck programs.
Distribution Channel Analysis
OEM dominates with 74.10% due to first-fit factory fitment.
In 2025, OEM held a dominant market position in the By Distribution Channel segment of Timing Belt Market, with a 74.10% share. Global production of about 96.4 million vehicles in 2025 anchors factory belt and tensioner demand. Long-term supply contracts stabilize plant utilization. Tier-one winners lock multi-year platform awards before aftermarket volumes mature.
Aftermarket is the fastest-growing channel as aging parc and fixed age or mileage intervals force belt kit jobs. Workshop evidence ties up to 70% of some engine failure sets to belt-related issues when service is late. Planned full jobs typically cost far less than engine rebuilds after breakage. Organized e-commerce and branded kits take share from informal parts channels.
Key Market Segments
By Belt Type
- Dry Belt
- Chain
- Belt-in-Oil
By Component
- Tensioner
- Idler Pulleys
- Timing Shield/Cover
- Sprocket
By Vehicle Type
- Passenger Vehicles
- Light Commercial Vehicles (LCV)
- Heavy Commercial Vehicles (HCV)
By Distribution Channel
- OEM
- Aftermarket
Regional Analysis
Asia Pacific Dominates the Timing Belt Market with a Market Share of 35.30%, Valued at USD 2.70 Billion
Asia Pacific leads on the back of dense vehicle manufacturing in China, India, Japan, and Korea. Regional share of 35.30% and value near USD 2.70 Billion in 2025 give local converters scale on dry and wet belts. High first-fit output feeds a large future replacement base. Investors should weight capacity and joint ventures toward APAC export hubs.
North America and Europe remain high-value regions for wet-belt migration, hybrid platforms, and branded aftermarket kits. In May 2026, Gates Corporation agreed to acquire the belts business of The Timken Company, including selected manufacturing assets, to widen industrial and mobility belt capacity. This deal strengthens supply options for Western OEM and industrial buyers. Faster growth still tracks emerging Asia ICE and hybrid builds more than mature BEV-heavy markets.
Latin America and Middle East and Africa add smaller but rising replacement demand as vehicle parc ages and organized parts retail expands. Combined, these regions absorb overflow export from Asian plants when local assembly is thin. Channel formalization raises branded kit penetration. Suppliers who localize SKUs and anti-counterfeit marking protect price realization.
Key Regions and Countries
North America
- US
- Canada
Europe
- Germany
- France
- The UK
- Spain
- Italy
- Rest of Europe
Asia Pacific
- China
- Japan
- South Korea
- India
- Australia
- Rest of APAC
Latin America
- Brazil
- Mexico
- Rest of Latin America
Middle East and Africa
- GCC
- South Africa
- Rest of MEA
Market Dynamics
Market Opportunity Analysis - Aftermarket kits, LCV fleets, and Asia localization remain underpriced entry points
Aftermarket remains underexploited relative to the 74.10% OEM channel share even though it is the fastest channel. Aging parc and fixed service intervals create kit demand outside factory contracts. New entrants who certify full belt, tensioner, and idler kits can take share from fragmented local sellers. Early brand authentication programs raise willingness to pay in India and ASEAN.
Light Commercial Vehicles grow faster than the 65.00% passenger core yet still trail in dedicated SKU depth at many suppliers. Higher fleet kilometers pull replacements earlier than private cars. Specialists who design LCV-duty tensioners and idlers win multi-year fleet agreements. This segment offers volume without waiting for new passenger platform awards.
Asia Pacific already holds 35.30% share and about USD 2.70 Billion, but localized wet-belt and export conversion capacity is still uneven. Cost-advantaged plants can serve global replacement demand while domestic ICE and hybrid output continues. Investors who fund qualified greenfield or brownfield lines capture margin expansion before peers relocate. This reflects a structural cost gap versus legacy Western conversion.
Belt-in-Oil and chain sub-segments sit below Dry Belt’s 55.10% share yet carry higher engineered content. Emissions-led wet systems and durability-led chains reprice the average unit upward. Challengers who lock HNBR supply and OEM validation win mix even if dry unit volumes plateau. This creates a path to share gains without matching dry commodity scale.
Technology and Innovation Landscape - Materials, diagnostics, and predictive service redefine belt value
Synchronous belt drives deliver about 5% energy savings versus V-belt layouts in motor power use. That efficiency factor enters kWh calculations for industrial and some auxiliary automotive drives. Manufacturers who market certified efficiency gains win energy-conscious plant buyers. This signals a shift from pure mechanical fit to documented operating cost reduction.
A 2025 study using vibration signals and artificial neural networks reached diagnostic accuracies between 96.90% and 99.34% across healthy and five fault states. High classification reliability supports early fault alerts before tooth jump. Tool vendors and belt makers can embed or partner on ANN diagnostics. Workshops that adopt these tools cut catastrophic engine claims.
AI-driven predictive maintenance on related belt systems can cut unplanned downtime by up to 40% and maintenance cost by nearly 30%. Timing-belt service networks can borrow the same sensor and analytics stack. Suppliers who bundle belts with monitoring software open subscription revenue. Fleets gain measurable uptime that justifies premium kit pricing.
Plant guides recommend logging belt tension every 30 days on critical drives and every 90 days on non-critical drives, with work orders when tension falls 15% below specification. Structured logging standardizes replacement triggers across sites. Component makers who publish tension specs matched to sensors become default OEM partners. This creates stickier multi-year service relationships.
Drivers
Wet-belt migration for emissions compliance is the strongest active growth lever, adding about 1.4% to baseline CAGR. Euro 6d enforcement and Euro 7 phase-in from 2026 to 2027, plus tighter US EPA light-duty greenhouse rules for model years 2025 to 2026, push OEMs toward oil-immersed belts. Wet designs cut parasitic friction and can shave 1 to 3 grams of CO2 per kilometer. Higher HNBR content lifts unit price and can expand supplier gross margins by roughly 200 to 400 basis points.
Aging vehicle parc and replacement cycles add about 1.1% to growth as owners service belts on time and mileage rules. ICE and hybrid production growth in India, ASEAN, and China contributes roughly 0.9%. Direct-injection and downsized turbo engines add about 0.7% through tougher thermal duty. Organized aftermarket and full-hybrid expansion add a further combined uplift near 1.1% over short to long horizons.
| Driver | (~) % Impact on CAGR Forecast | Geographic Relevance | Impact Timeline |
|---|---|---|---|
| Wet-belt migration for emissions compliance | +1.4% | Europe, North America, Japan | Medium term (2 to 4 years) |
| Aging vehicle parc & replacement-cycle demand | +1.1% | Global (North America, EU, India) | Short term (2 years or less) |
| ICE & hybrid production growth in emerging Asia | +0.9% | India, ASEAN, China | Medium term (2 to 4 years) |
| Direct-injection & downsized turbo engine penetration | +0.7% | Global | Medium term (2 to 4 years) |
| Formalization of organized aftermarket & e-commerce parts | +0.6% | India, Southeast Asia | Short term (2 years or less) |
| Full-hybrid (HEV/PHEV) drivetrain expansion | +0.5% | Japan, North America, EU | Long term (4 years or more) |
Restraints
Battery-electric vehicle penetration is the main structural restraint, cutting about 1.5% from baseline growth because BEVs remove cam-crank synchronization from the bill of materials. IEA Global EV Outlook tracking shows electric car sales above 17 million units in 2024 and more than 20 million in 2025, over one-quarter of new cars worldwide. Market.us registration analysis recorded a 2% ICE sales contraction in India in Q1 2025 against a 22% EV surge. First-fit belt demand erodes as BEV share crosses self-sustaining thresholds.
Timing-chain substitution on new platforms deducts about 1.0% in North America, Japan, and Korea. Elevated financing rates remove roughly 0.6% by slowing vehicle purchases globally. ICE registration bans and phase-out rules in the EU, UK, and California cut about 0.5% on a long horizon. HNBR feedstock inflation trims about 0.4% by squeezing converter margins in the short term.
| Restraint | (~) % Impact on CAGR Forecast | Geographic Relevance | Impact Timeline |
|---|---|---|---|
| BEV displacement of belt-driven powertrains | -1.5% | China, EU, North America | Medium term (2 to 4 years) |
| Timing-chain substitution in new engine platforms | -1.0% | North America, Japan, Korea | Short term (2 years or less) |
| Elevated interest rates constraining vehicle financing | -0.6% | Global | Short term (2 years or less) |
| ICE new-registration bans & phase-out mandates | -0.5% | EU, UK, California | Long term (4 years or more) |
| HNBR feedstock cost inflation compressing margins | -0.4% | Global | Short term (2 years or less) |
Challenges
Elastomer feedstock supply volatility is the heaviest ongoing friction, dragging about 0.7% off maximum growth. Timing belts rely on specialty HNBR and glass-fiber cord from a concentrated supplier set, and automotive uses over 40% of HNBR output. Synthetic rubber supply expands near 6% annually, leaving thin buffers when butadiene and acrylonitrile prices swing. Price spikes can compress converter gross margins by 150 to 300 basis points and complicate fixed OEM contracts.
Wet-belt reliability and warranty exposure subtract about 0.6% in Europe and North America as degradation claims rise. Counterfeit aftermarket parts remove roughly 0.5% in India, ASEAN, and MEA by undercutting branded kits. Precision tooling and skilled-labor gaps cost about 0.4% in North America and the EU. Cross-border tariff and logistics friction adds about 0.3% of global drag over a medium horizon.
| Challenge | (~) % CAGR Friction Drag | Geographic Relevance | Mitigation Horizon |
|---|---|---|---|
| Elastomer feedstock supply volatility | -0.7% | Global (Asia-sourced) | Medium term (2 to 4 years) |
| Wet-belt reliability & warranty exposure | -0.6% | Europe, North America | Medium term (2 to 4 years) |
| Counterfeit aftermarket infiltration | -0.5% | India, ASEAN, MEA | Long term (4 years or more) |
| Precision tooling & skilled-labor deficit | -0.4% | North America, EU | Long term (4 years or more) |
| Cross-border tariff & logistics friction | -0.3% | Global | Medium term (2 to 4 years) |
Opportunities
Localized manufacturing hubs in India, ASEAN, and Africa offer about 1.3% potential CAGR upside above baseline. India holds only about 3% of globally traded auto components against a Vision 2030 aim near 8%, while ACMA-linked turnover reached roughly US$80 billion in FY25 at a 14% five-year CAGR. PLI-linked investment above ₹66,000 crore can cut fully loaded cost per belt by an estimated 15 to 25%. Export-oriented converters can gain 300 to 500 basis points of gross margin on shipped SKUs.
Digitally authenticated branded aftermarket kits add about 1.0% upside in India, ASEAN, and Latin America. Non-automotive industrial and robotics belt drives contribute roughly 0.8% on a long horizon. Predictive-maintenance sensor belts offer about 0.6% in North America, the EU, and Japan. M&A roll-ups of regional converters add about 0.5% for scale buyers over two to four years.
| Opportunity | (~) % Potential CAGR Upside | Geographic Relevance | Execution Window |
|---|---|---|---|
| Emerging-market localized manufacturing hubs | +1.3% | India, ASEAN, Africa | Medium term (2 to 4 years) |
| Digitally-authenticated branded aftermarket kits | +1.0% | India, ASEAN, LATAM | Short term (2 years or less) |
| Non-automotive industrial & robotics belt drives | +0.8% | Global | Long term (4 years or more) |
| Predictive-maintenance sensor-integrated belt systems | +0.6% | North America, EU, Japan | Long term (4 years or more) |
| M&A roll-up of fragmented regional converters | +0.5% | Global | Medium term (2 to 4 years) |
Key Company Insights
ContiTech holds scale across automotive and industrial belt platforms that serve high-volume passenger and commercial engines. Brand reach supports OEM awards and organized aftermarket kits where failure repair can run €3,000 to €8,000 versus planned jobs near €450 to €750. This gap favors premium kit positioning. ContiTech risk sits in BEV mix shift if industrial diversification lags.
BorgWarner Inc. positions powertrain content where hybrid and efficient ICE still need precise valve timing hardware. A 2025 interval overview cites common passenger-car belt windows of 100,000 to 180,000 km and 5 to 10 years by brand. Long intervals stretch replacement cycles but raise the cost of a single miss. BorgWarner advantage depends on winning hybrid platforms that retain belt or chain drives.
Key Players
- ContiTech
- BorgWarner Inc.
- Schaeffler Technologies AG & Co. KG
- SKF
- NTN Group
- Aisin Corporation
- Tsubakimoto Chain Co.
- J.K. Fenner Limited
- The Goodyear Tire & Rubber Company
- Gates Corporation
- Dayco Incorporated
- Ningbo GUL TZ Rubber Belt Co., Ltd.
- Toyopower
- British Gaskets Limited
- L.G. Balakrishnan & Bros Ltd.
- B&B Manufacturing
- The Carlstar Group
- ACDelco
- Federal-Mogul Motorparts Corporation
- Bando USA
- Ningbo Beidi Synchronous Belt
- Ningbo Fulong Synchronous Belt
- MAHLE Aftermarket
Recent Developments
- November 2025: Dayco launched Timing Belt-in-Oil technology for the North American automotive aftermarket, extending coverage to more than 2 million Ford and Lincoln turbocharged vehicles and moving OE wet-belt know-how into replacement channels.
- September 2025: Dayco introduced 66 new product applications across its aftermarket portfolio, including timing chain kits, tensioners, and belt system parts that widen vehicle coverage for repair markets.
Geopolitical Impact Analysis
Data from the WTO context and bilateral filings show US measures including a 25% ad valorem tariff on certain automobile parts and vehicles affecting India-origin flows from May 2025. Separate structures still apply rates near 25% on light trucks and elevated steel and aluminum component duties. These tariffs raise landed cost for imported timing kits, tensioners, and sprockets. Therefore, suppliers reroute production toward local or FTA-favored plants to protect OEM contract margins.
UNCTAD Review of Maritime Transport 2025 indicates seaborne trade growth slowing to about 0.5% in 2025 after 2.2% in 2024, with longer-route uncertainty. Container fleet capacity was still set to expand about 6.7% in 2025, yet rerouting inflates transit time for elastomer and finished belts. Longer lead times force higher safety stocks of HNBR-grade belts. As a result, distributors raise working capital and prefer dual-continent inventory nodes.
Report Scope
| Report Features | Description |
|---|---|
| Market Value (2025) | USD 7.65 Billion |
| Forecast Revenue (2035) | USD 11.52 Billion |
| CAGR (2026-2035) | 4.18% |
| Base Year for Estimation | 2025 |
| Historic Period | 2020-2024 |
| Forecast Period | 2026-2035 |
| Report Coverage | Revenue Forecast, Market Dynamics, Market Opportunity Analysis, Technology and Innovation Landscape, Competitive Landscape, Recent Developments |
| Segments Covered | By Belt Type (Dry Belt, Chain, Belt-in-Oil), By Component (Tensioner, Idler Pulleys, Timing Shield/Cover, Sprocket), By Vehicle Type (Passenger Vehicles, Light Commercial Vehicles (LCV), Heavy Commercial Vehicles (HCV)), By Distribution Channel (OEM, Aftermarket) |
| Regional Analysis | North America (US and Canada), Europe (Germany, France, The UK, Spain, Italy, and Rest of Europe), Asia Pacific (China, Japan, South Korea, India, Australia, and Rest of APAC), Latin America (Brazil, Mexico, and Rest of Latin America), Middle East and Africa (GCC, South Africa, and Rest of MEA) |
| Competitive Landscape | ContiTech, BorgWarner Inc., Schaeffler Technologies AG & Co. KG, SKF, NTN Group, Aisin Corporation, Tsubakimoto Chain Co., J.K. Fenner Limited, The Goodyear Tire & Rubber Company, Gates Corporation, Dayco Incorporated, Ningbo GUL TZ Rubber Belt Co., Ltd., Toyopower, British Gaskets Limited, L.G. Balakrishnan & Bros Ltd., B&B Manufacturing, The Carlstar Group, ACDelco, Federal-Mogul Motorparts Corporation, Bando USA, Ningbo Beidi Synchronous Belt, Ningbo Fulong Synchronous Belt, MAHLE Aftermarket |
| Customization Scope | Customization for segments, region / country-level will be provided. Additional customization can be done based on requirements. |
| Purchase Options | We have three licenses to opt for: Single User License | Multi-User License (Up to 5 Users) | Corporate Use License (Unlimited User and Printable PDF) |





































