


Report Overview
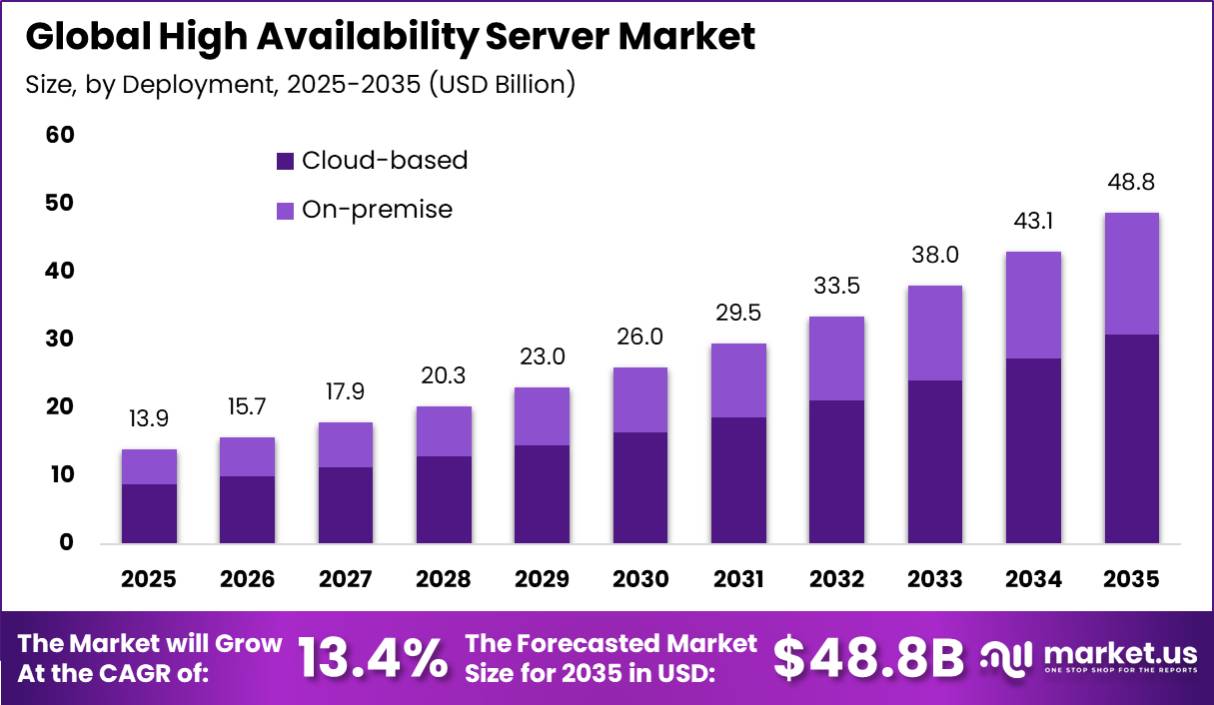
In 2025, the Global High Availability Server Market was valued at USD 13.9 billion. The market is projected to grow at a CAGR of 13.4% during 2026–2035, reaching approximately USD 48.8 billion by 2035. North America dominated the global market in 2025, accounting for more than 38.2% of the total market share and generating approximately USD 5.3 billion in revenue.
Data centres remain a major source of demand for high-availability servers. According to the IEA, data centres consumed about 415 TWh of electricity in 2024, representing nearly 1.5% of global electricity consumption. This electricity demand could reach around 945 TWh by 2030, reflecting the continued expansion of data-centre infrastructure and computing capacity worldwide.
The rising use of cloud computing, AI, online transactions, data storage, and real-time applications is increasing the need for servers with redundancy, failover support, backup power connections, and fast recovery capabilities. These systems help businesses reduce downtime and maintain continuous operations across payments, logistics, healthcare, manufacturing, customer service platforms, and other critical digital applications.
U.S. retail e-commerce sales reached USD 316.1 billion in the fourth quarter of 2025, increasing 5.3% year on year and representing 16.6% of total retail sales. UNCTAD reported global greenfield data-centre investment above USD 270 billion in 2025, while the United States accounted for 45% of global data-centre electricity use in 2024.
Key Takeaway
- The High Availability Server Market was valued at USD 13.9 billion in 2025 and is projected to reach USD 48.8 billion by 2035, growing at a CAGR of 13.4%.
- Cloud-based deployment held the largest share at 63.2% in 2025, driven by rising enterprise cloud adoption.
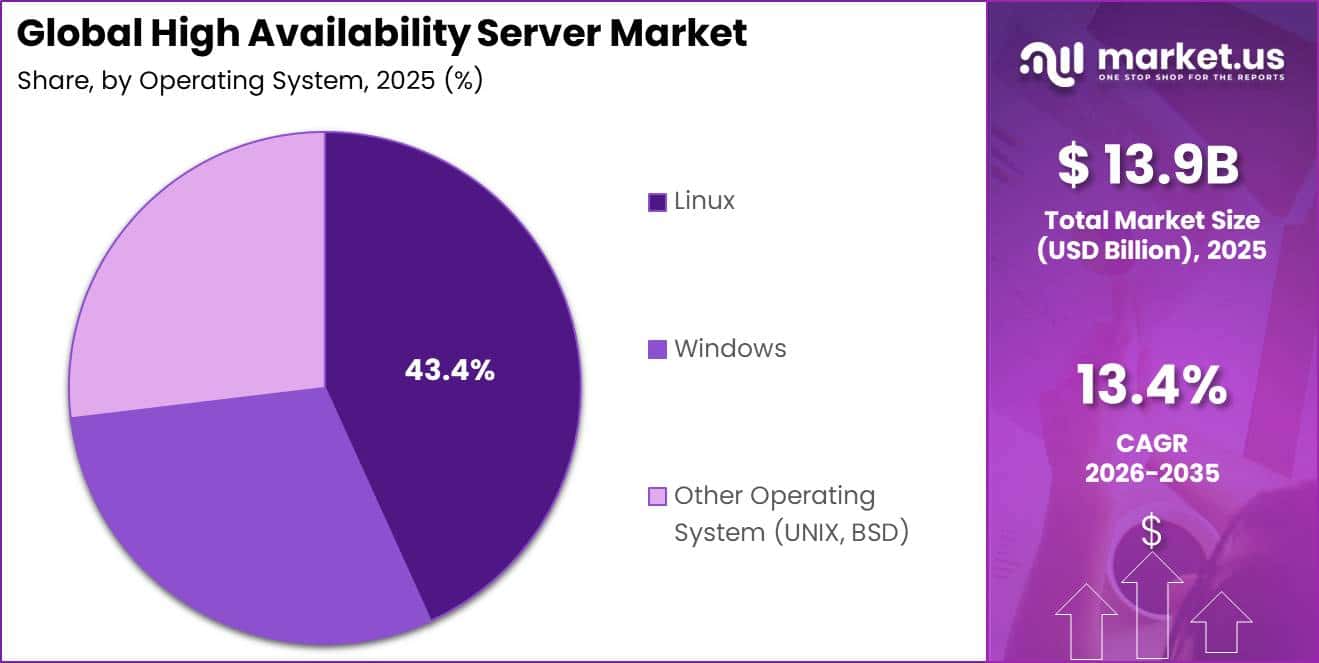
- Linux led the operating system segment with a 43.4% share, supported by strong container and Kubernetes adoption.
- IT and Telecommunications was the leading end-user industry with a 28.6% share, driven by growing internet and 5G usage.
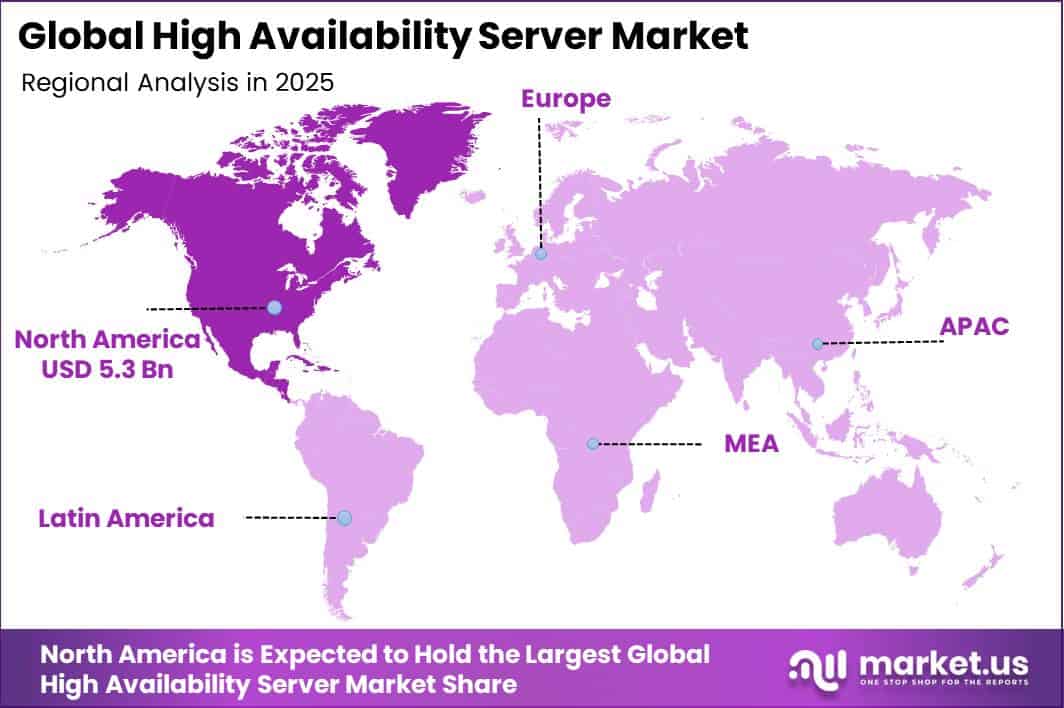
- North America led the market in 2025 with a 38.2% share, generating approximately USD 5.3 billion in revenue.
Market Statistics and Data Insights
- AI and hyperscaler infrastructure spending is expanding the installed server base. The IEA reported that capital expenditure by five major technology companies exceeded USD 400 billion in 2025 and is expected to increase by another 75% in 2026. Global data-centre electricity consumption reached about 485 TWh in 2025 and is projected to approach 950 TWh by 2030.
- Data-centre greenfield investment is creating direct demand for redundant computing infrastructure. UN Trade and Development reported that announced data-centre FDI exceeded USD 270 billion in 2025. Data centres represented more than one-fifth of global greenfield project values, while investment in the sector increased by around USD 125 billion during the year.
- Enterprise cloud migration is increasing always-on server requirements. In 2025, 52.7% of EU enterprises purchased cloud services, an increase of 7.4 percentage points from 2023. Cloud adoption reached about 85% among large enterprises. Among cloud users, 85.2% used cloud email, 71.7% office software, and 71.5% file storage, showing how essential business workloads are increasingly hosted remotely.
- Expanding internet and 5G traffic is increasing continuous telecom computing loads. The ITU estimated that 6 billion people, or 74% of the global population, used the internet in 2025. Global 5G population coverage reached 55.1%, while mobile-broadband traffic averaged 184 GB per subscription.
- Data-centre power requirements are creating practical limits for redundant server deployments. U.S. data centres consumed about 176 TWh of electricity in 2023, representing 4.4% of total U.S. electricity consumption. The U.S. Department of Energy estimates consumption could increase to 325–580 TWh by 2028, equivalent to about 6.7%–12% of national electricity use.
- Trade duties create direct procurement risk for server hardware and electronic components. The WTO recorded an additional 10% U.S. tariff on Chinese-origin goods in February 2025, which was subsequently increased to 20% in March 2025. The WTO estimated that, if reciprocal tariffs and wider trade-policy uncertainty fully materialized, world merchandise trade could decline by 1.5% in 2025.
- Underdeveloped digital infrastructure creates an opportunity for sovereign and edge availability systems. The ITU estimated that 2.2 billion people remained offline in 2025. UNCTAD reported that only USD 9 billion was invested in ICT infrastructure in developing countries in 2024, compared with an estimated USD 62 billion needed each year globally.
- Automated infrastructure recovery is becoming standard in cloud-native environments. CNCF found that 77% of surveyed organizations had adopted GitOps principles, while 60% used CI/CD across most or all applications. Kubernetes production use reached 80% in 2024, up from 66% in 2023, strengthening the shift toward automated workload placement, restart, and recovery.
- AI is pushing server infrastructure toward much higher power density. Data-centre electricity demand increased 17% in 2025, compared with 3% growth in global electricity demand. The IEA projects accelerated server electricity use to grow around 30% annually through 2030, while hyperscale AI data centres can require more than 100 MW of power.
- Uptime Institute’s 2025 Global Data Center Survey covered more than 800 data-centre owners and operators. It found that 45% of IT workloads remained in corporate facilities, around 1 in 10 impactful outages caused serious or severe disruption, and nearly two-thirds of operators experienced difficulty hiring or retaining qualified staff.
- In Uptime Institute’s 2025 survey, 57% of respondents said their most recent major data-center outage cost more than USD 100,000, while 1 in 5 reported outage costs above USD 1 million, showing the financial importance of redundant and high-availability infrastructure.
By Deployment
In 2025, Cloud-based deployment held a dominant position in the High Availability Server Market, capturing more than a 63.2% share. Its leadership is supported by the growing preference for flexible and reliable computing systems that reduce the need for businesses to purchase and maintain large amounts of on-site server infrastructure.
Cloud adoption continues to strengthen demand for high-availability servers. In 2025, around 52.7% of EU enterprises used paid cloud computing services, representing an increase of 7.4 percentage points compared with 2023. Among large enterprises, cloud usage reached 84.7%, showing the strong dependence of major organizations on remotely hosted computing resources.
By Operating System
In 2025, Linux held a dominant position in the High Availability Server Market, capturing more than a 43.4% share. Its strong position is supported by its open-source structure, scalability, reliability, and ability to support enterprise workloads without additional per-server licence costs. Linux is widely used across containerised and cloud-native computing environments.
According to the Linux Foundation and Cloud Native Computing Foundation, 91% of surveyed organizations were using containers in production in 2024. Kubernetes production adoption also reached 80% in 2024, compared with 66% in 2023, showing the rapid shift toward automated and distributed computing infrastructure. Linux provides strong support for clustering, virtualisation, automation, and a wide range of server hardware.
By End-user Industry
In 2025, the IT and Telecommunication segment held a dominant position in the High Availability Server Market, capturing more than a 28.6% share. The segment’s strong position is supported by the need for telecom operators and IT service providers to keep networks, applications, and digital platforms running without interruption.
According to the International Telecommunication Union, around 5.5 billion people used the internet in 2024, representing nearly 68% of the global population. During the same year, 5G coverage reached 51%, showing the continued expansion of high-speed digital connectivity worldwide.
Growing internet and 5G usage creates large volumes of authentication, routing, messaging, billing, content delivery, and network-management workloads. These services operate continuously, making system downtime costly for operators and customers. High-availability servers support telecom and IT infrastructure through redundant processing, data replication, automatic failover, and continuous workload management.
Key Market Segments
By Deployment
- Cloud-based
- On-premise
By Operating System
- Linux
- Windows
- Other Operating System (UNIX, BSD)
By End-user Industry
- IT and Telecommunication
- BFSI
- Retail
- Healthcare
- Industrial
- Other
Geopolitical Impact Analysis
Geopolitical tensions are increasing procurement costs and supply risks in the High Availability Server Market because servers depend on globally sourced processors, memory modules, solid-state drives, network cards, printed circuit boards, power supplies, and cooling components. In 2025, China challenged an additional 10% U.S. tariff on affected Chinese imports at the World Trade Organization.
Such changes are more difficult for high-availability systems because redundant servers, storage equipment, and networking components must be tested for compatibility and reliability before deployment. The WTO projected that reciprocal tariffs and policy uncertainty could reduce global merchandise trade by 1.5% in 2025, creating additional uncertainty for international hardware procurement and component availability.
Shipping disruptions are also affecting the market. UN Trade and Development reported that Red Sea rerouting added around 12 sailing days to the Shanghai-Rotterdam route, increased transit times by nearly 30%, and reduced effective global container shipping capacity by about 9%. Diversions also increased container-ship demand by 12% and tripled bunker-fuel consumption, raising transportation and logistics expenses.
Energy costs create another layer of uncertainty. The World Bank projected its energy price index to decline by 12% in 2025, while warning that Middle East conflict could push prices higher. Together, tariffs, shipping delays, and energy volatility are encouraging server suppliers to adopt regional assembly, multiple sourcing strategies, and larger safety-stock inventories.
Regional Analysis
North America held the dominant position in the High Availability Server Market in 2025, accounting for more than a 38.2% share and generating approximately USD 5.3 billion in revenue. The region benefits from a strong presence of cloud providers, telecom companies, financial institutions, healthcare networks, and digital platforms that require continuous system availability.
The U.S. digital economy generated around USD 2.6 trillion in value added in 2022, representing 10.0% of national GDP. This large digital economy creates strong demand for high-availability servers that support redundant processing, automated failover, data replication, and business continuity.
Asia Pacific is emerging as the fastest-growing regional market, supported by rapid digitalisation, wider mobile connectivity, and rising investment in cloud and AI infrastructure. According to the International Telecommunication Union, 66% of the Asia-Pacific population used the internet in 2024, compared with 30% in 2010, while 4G coverage reached 96% of the population.
Key Regions and Countries
- North America
- US
- Canada
- Europe
- Germany
- France
- The UK
- Spain
- Italy
- Rest of Europe
- Asia Pacific
- China
- Japan
- South Korea
- India
- Australia
- Rest of APAC
- Latin America
- Brazil
- Mexico
- Rest of Latin America
- Middle East & Africa
- GCC
- South Africa
- Rest of MEA
Market Dynamics
Drivers
| Driver | (~) % CAGR | Geographic Relevance | Impact Timeline |
|---|---|---|---|
| AI compute uptime demand | +2.4% | Global | Short term (2 years or less) |
| Cloud workload concentration | +1.9% | North America, Europe, Asia Pacific | Short term (2 years or less) |
| Digital-service continuity needs | +1.6% | Global | Medium term (2 to 4 years) |
| Critical-infrastructure modernisation | +1.3% | North America, Europe, Japan | Medium term (2 to 4 years) |
| Enterprise hybrid refresh cycles | +1.1% | Global | Medium term (2 to 4 years) |
AI compute uptime demand
AI workloads are making high availability a core infrastructure requirement rather than only a backup feature. The IEA projects global data-centre electricity demand to exceed 945 TWh by 2030, more than double the 2024 level, while electricity use from AI-optimised facilities is expected to increase by more than 4x. This growth raises the cost of downtime across AI training, inference, storage, and orchestration workloads.
UN Trade and Development reported ICT greenfield project values of nearly USD 200 billion in 2024, led by data centres and data processing. The International Telecommunication Union also recorded 6 billion internet users in 2025, equal to 74% of the global population. These trends support an estimated +2.4% incremental contribution to CAGR, driven by higher server density, redundant infrastructure, clustered storage, and automated failover requirements.
Restraints
| Restraint | (~) % CAGR | Geographic Relevance | Impact Timeline |
|---|---|---|---|
| Trade-duty cost pass-through | -1.8% | North America, China, Europe | Short term (2 years or less) |
| Customer capital-budget deferrals | -1.4% | Global | Short term (2 years or less) |
| Public-cloud substitution | -1.2% | North America, Europe | Medium term (2 to 4 years) |
| Restricted technology exports | -1.0% | China, United States, Middle East | Medium term (2 to 4 years) |
| Legacy-system migration risk | -0.8% | Global | Medium term (2 to 4 years) |
Trade-duty cost pass-through
Trade-duty exposure is an immediate restraint for the High Availability Server Market because these systems depend on imported processors, memory, storage, boards, power units, and network interfaces. In 2025, the WTO recorded a Chinese consultation request over an additional 10% U.S. tariff on affected imports. The WTO also estimated that tariff uncertainty could reduce global merchandise trade by 1.5% in 2025, making hardware procurement less predictable.
UN Trade and Development reported that ICT greenfield project values approached USD 200 billion in 2024, increasing the volume of equipment exposed to cross-border sourcing risks. The estimated -1.8% CAGR deduction reflects delayed purchasing decisions, higher safety-stock costs, and pressure on supplier margins, while some buyers may shift toward lower-cost standardised cloud infrastructure.
Challenges
| Challenge | (~) % CAGR | Geographic Relevance | Mitigation Horizon |
|---|---|---|---|
| Power-density thermal design | -1.6% | Global | Medium term (2 to 4 years) |
| Multi-vendor stack integration | -1.2% | Global | Medium term (2 to 4 years) |
| Semiconductor qualification cycles | -1.0% | Global | Medium term (2 to 4 years) |
| Cyber recovery testing | -0.9% | Global | Short term (2 years or less) |
| Specialist skills scarcity | -0.7% | North America, Europe, Asia Pacific | Long term (4 years or more) |
Power-density thermal design
In the United States, data centres consumed around 176 TWh in 2023, equal to 4.4% of national electricity use. UN Trade and Development also reported ICT greenfield project values of nearly USD 200 billion in 2024. These pressures contribute to an estimated -1.6% friction drag, driven by higher cooling costs, longer liquid-cooling validation cycles, and the need to manage redundancy within limited rack-level power and thermal capacity.
Opportunities
| Opportunity | (~) % CAGR | Geographic Relevance | Execution Window |
|---|---|---|---|
| Sovereign edge availability platforms | +2.0% | Asia Pacific, Middle East, Europe | Medium term (2 to 4 years) |
| Availability-as-a-service contracts | +1.5% | Global | Short term (2 years or less) |
| Industrial edge resilience | +1.3% | Asia Pacific, North America, Europe | Medium term (2 to 4 years) |
| Lifecycle retrofit programmes | +1.0% | Global | Short term (2 years or less) |
| Regional infrastructure partnerships | +0.8% | Latin America, Africa, Southeast Asia | Long term (4 years or more) |
Sovereign edge availability platforms
Sovereign edge availability platforms remain a future growth opportunity as many developing markets are still expanding local digital infrastructure. The International Telecommunication Union estimated that 2.2 billion people remained offline in 2025, indicating strong future demand for locally hosted connectivity, payments, public services, and enterprise applications.
UN Trade and Development reported ICT greenfield project values of nearly USD 200 billion in 2024, although much of this investment remains concentrated in established technology hubs. Providers that combine hardware, remote monitoring, failover testing, and service-level support could improve recurring gross-margin potential by an estimated 15%–25% compared with one-time equipment sales, while reducing downtime risks and expanding demand beyond centralised cloud infrastructure.
Key Players Analysis
The High Availability Server Market is led by major technology companies including Dell Technologies, Hewlett Packard Enterprise, IBM, and Cisco. Dell reported USD 60.8 billion in fiscal 2026 Infrastructure Solutions Group revenue, including USD 24.7 billion from AI-optimised servers and USD 19.5 billion from traditional servers and networking.
The company also invested USD 3.1 billion in R&D. HPE generated USD 17.7 billion in fiscal 2025 server revenue, up 10.2%, while its operating margin declined to 7.6% from 11.2%. IBM reported USD 15.7 billion in infrastructure revenue in 2025, increasing 12.1%, alongside USD 8.3 billion in R&D spending.
Oracle, Fujitsu, NEC, and Unisys form an important group of competitive challengers. Oracle generated USD 2.9 billion in fiscal 2025 hardware revenue, down 4%, while infrastructure cloud services and license-support revenue reached USD 24.6 billion. Cisco generated USD 56.7 billion in fiscal 2025 revenue and invested USD 9.3 billion, equal to 16.4% of revenue, in R&D.
Its USD 28 billion Splunk acquisition strengthened monitoring and incident-response capabilities. Fujitsu reported FY2024 R&D spending of ¥110.0 billion, while NEC generated ¥2.03 trillion from IT services in FY2025 and spent ¥99.2 billion on R&D. Specialist suppliers include Unisys, Stratus Technologies, and CenterServ. Unisys generated USD 629 million from Enterprise Computing Solutions in 2025, while Stratus was acquired by SMART Global Holdings for USD 225 million.
Top Key Players in the Market
- HP Development Company L.P.
- Fujitsu
- Oracle Corporation
- Cisco Systems
- CenterServ
- Dell Inc.
- Unisys Global Technologies
- NEC Corporation
- IBM Corporation
- Stratus Technologies
Recent Developments
- In February 2026, Oracle announced plans to raise approximately USD 45–50 billion during calendar 2026 to expand Oracle Cloud Infrastructure capacity. The funding plan combines debt and equity financing, including an at-the-market equity programme of up to USD 20 billion.
- In February 2025, IBM completed its acquisition of HashiCorp for USD 35 per share in cash, representing an enterprise value of approximately USD 6.4 billion. HashiCorp provides infrastructure automation and security technologies for hybrid and multi-cloud environments.
Report Scope
| Report Features | Description |
|---|---|
| Market Value (2025) | USD 13.9 Billion |
| Forecast Revenue (2035) | USD 48.8 Billion |
| CAGR (2026-2035) | 13.4% |
| Base Year for Estimation | 2025 |
| Historic Period | 2020-2024 |
| Forecast Period | 2026-2035 |
| Report Coverage | Revenue Forecast, Market Dynamics, Competitive Landscape, Recent Developments |
| Segments Covered | By Deployment (Cloud-based, On-premises); By Operating System (Linux, Windows, Other Operating System (UNIX, BSD)); By End-user Industry (IT and Telecommunication, BFSI, Retail, Healthcare, Industrial, Other) |
| Regional Analysis | North America – US, Canada; Europe – Germany, France, The UK, Spain, Italy, Rest of Europe; Asia Pacific – China, Japan, South Korea, India, Australia, Singapore, Rest of APAC; Latin America – Brazil, Mexico, Rest of Latin America; Middle East & Africa – GCC, South Africa, Rest of MEA |
| Competitive Landscape | HP Development Company L.P., Fujitsu, Oracle Corporation, Cisco Systems, CenterServ, Dell Inc., Unisys Global Technologies, NEC Corporation, IBM Corporation, Stratus Technologies |
| Customization Scope | Customization for segments, region/country-level will be provided. Additional customization can be done based on requirements. |
| Purchase Options | We have three licenses to opt for: Single User License, Multi-User License (Up to 5 Users), Corporate Use License (Unlimited Users and Printable PDF) |





























