Report Overview
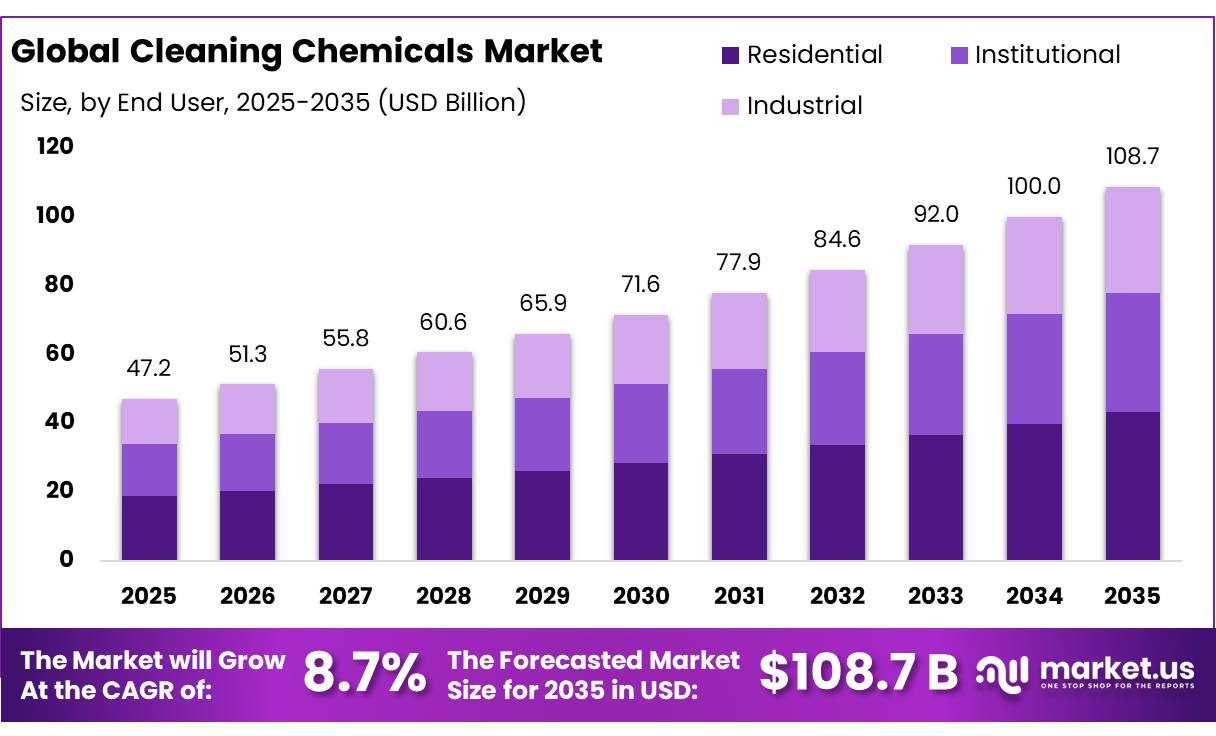
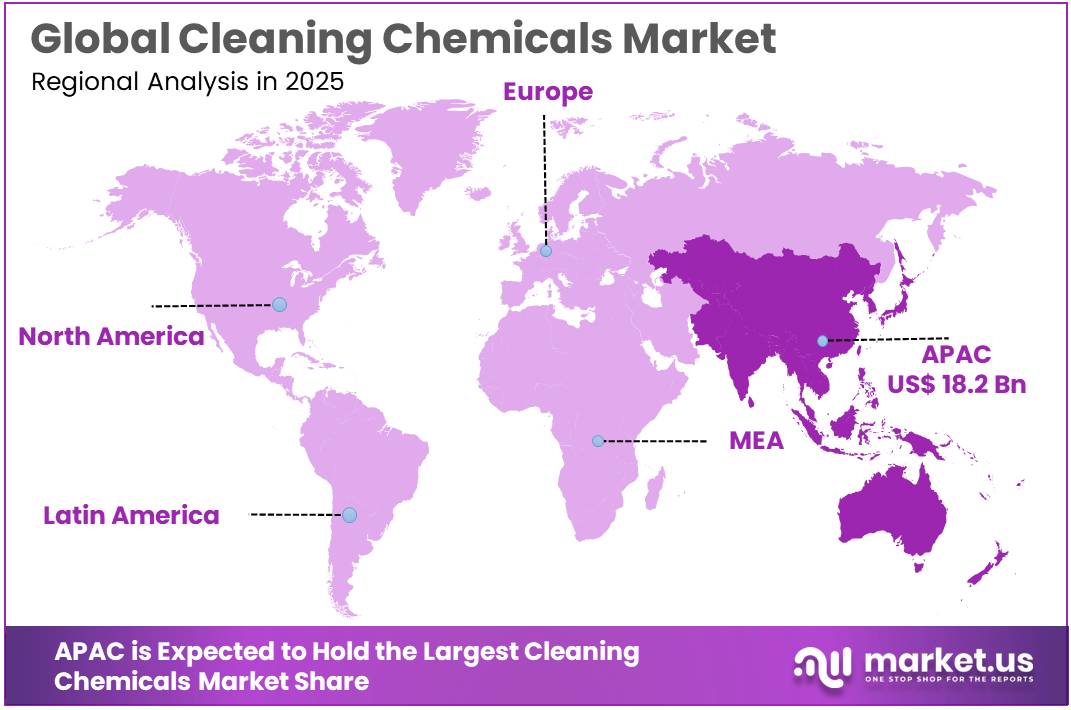
The Global Cleaning Chemicals Market size is expected to be worth around USD 108.7 Billion by 2035, from USD 47.2 Billion in 2025, growing at a CAGR of 8.7% during the forecast period from 2026 to 2035. In 2025, Asia-Pacific held a dominant market position, capturing more than a 38.78% share, holding USD 18.2 Billion revenue.
The cleaning chemicals industry plays an important role in maintaining hygiene, sanitation, workplace safety, and industrial cleanliness across residential, commercial, and industrial environments. It includes a wide range of products, such as surface cleaners, detergents, disinfectants, degreasers, industrial cleaning agents, floor cleaners, and specialty sanitation chemicals. These products are widely used in healthcare facilities, food processing plants, hospitality, manufacturing units, offices, transportation, and institutional buildings.
- According to the American Chemistry Council (ACC), cleaning products represent nearly 10% of US chemical manufacturing, employ approximately 66,000 people, and contribute around USD 60 billion to the US economy. The United States also recorded a positive cleaning products trade balance of approximately USD 1.1 billion in 2024, reflecting its strong manufacturing and export position. These figures demonstrate the importance of cleaning chemicals within the wider chemical manufacturing industry.
Several factors are driving the growth of the cleaning chemicals industry. Rising hygiene standards in hospitals, laboratories, food manufacturing facilities, and public infrastructure are increasing the regular consumption of disinfectants and specialized cleaning solutions. Industrial expansion is also creating demand for heavy-duty degreasers, equipment cleaners, metal cleaning chemicals, and maintenance formulations. According to the ACC’s chemical industry outlook, global consumer chemicals output was projected to increase by 0.4% in 2025 and 2.2% in 2026, indicating an improving production environment for consumer-oriented chemical products.
- Government initiatives and environmental regulations are also influencing product development and manufacturing practices. In the United States, the Environmental Protection Agency’s Safer Choice programme encourages manufacturers to use ingredients that meet specific human health and environmental criteria. The programme reported 1,656 certified products in fiscal year 2025, demonstrating the presence of an established framework for safer cleaning product formulations.
In Europe, the proposed revision of the detergents and surfactants regulatory framework focuses on improving product safety, ingredient information, and environmental protection. According to the European Parliament, detergents account for approximately 4.2% of the European Union chemicals industry’s production value, highlighting the sector’s industrial importance.
Key Takeaways
- Cleaning Chemicals Market size is expected to be worth around USD 108.7 Billion by 2035, from USD 47.2 Billion in 2025, growing at a CAGR of 8.7%.
- Sanitizers And Disinfectants held a dominant market position, capturing more than a 42.67% share.
- Residential held a dominant market position, capturing more than a 39.78% share.
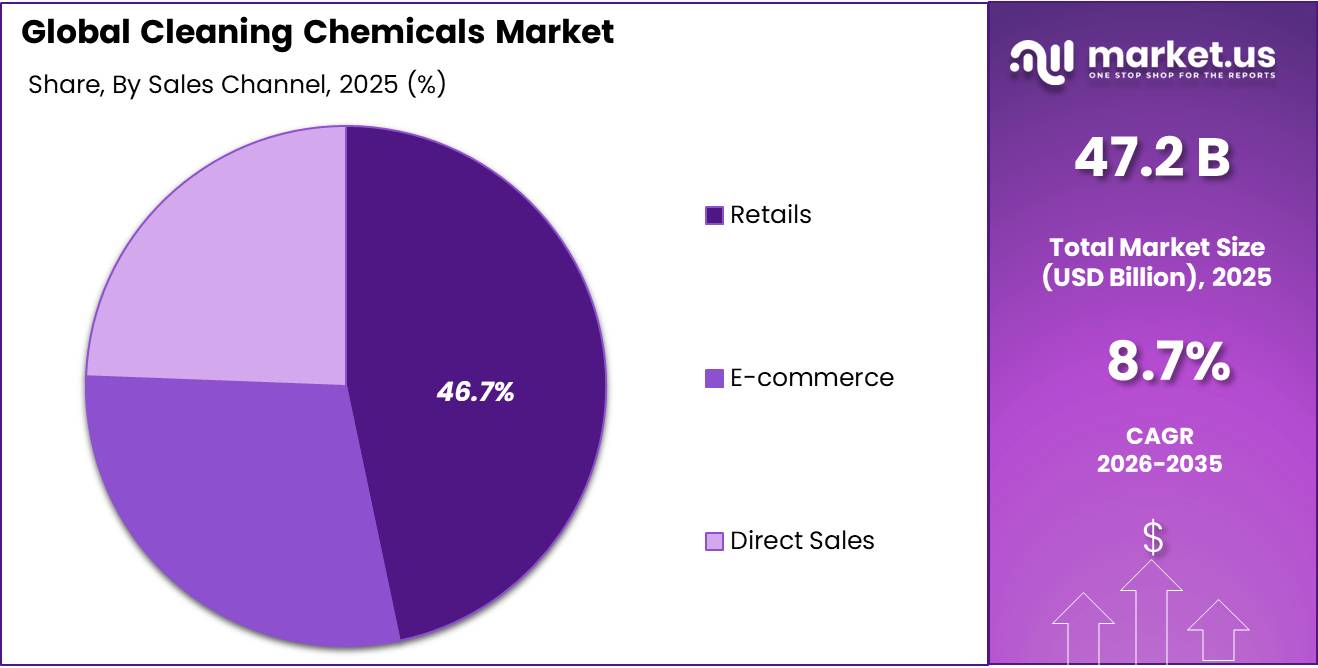
- Retails held a dominant market position, capturing more than a 46.78% share.
- Asia-Pacific dominated the Cleaning Chemicals Market in 2025, accounting for 38.78% of the global market, with a market value of USD 18.2 billion.
By Product Type Analysis
Sanitizers and Disinfectants – Strong hygiene requirements and effective microbial control support segment dominance.
In 2025, “Sanitizers And Disinfectants” held a dominant market position, capturing more than a 42.67% share of the Cleaning Chemicals Market by Product Type. The segment benefits from continuous demand across healthcare facilities, food processing units, hospitality, commercial buildings, and industrial workplaces. Sanitizers and disinfectants are widely used to control harmful microorganisms, maintain hygienic surfaces, and reduce the risk of contamination. Their importance in hospitals, laboratories, and food-handling environments supports regular purchasing and repeat consumption.
Glass & Façade Cleaners play an important role in maintaining the appearance, cleanliness, and durability of commercial buildings, offices, hotels, shopping centres, and industrial facilities. These products are designed to remove dust, fingerprints, grease, watermarks, and environmental deposits from glass surfaces, windows, and building façades without leaving streaks or residues. Demand is supported by regular maintenance requirements in commercial infrastructure and the growing use of glass in modern building designs.
According to the US Bureau of Labor Statistics, janitors and building cleaners held approximately 2.4 million jobs in 2025, and their responsibilities include washing windows and glass. This reflects the large workforce involved in routine building-cleaning activities and supports the need for specialized glass-cleaning products. Manufacturers are focusing on streak-free formulations, concentrated cleaners, and solutions suitable for large glass surfaces.
By End User Analysis
Residential – Regular household cleaning and rising hygiene awareness support segment dominance.
In 2025, “Residential” held a dominant market position, capturing more than a 39.78% share of the Cleaning Chemicals Market by End User. The segment is supported by regular demand for household cleaning products, including surface cleaners, floor cleaners, dishwashing liquids, detergents, bathroom cleaners, and disinfectants. Increasing attention to household hygiene, cleanliness, and sanitation encourages consumers to use cleaning chemicals for everyday maintenance. Demand is also supported by the need for convenient, effective, and easy-to-use cleaning solutions.
Institutional demand for cleaning chemicals is driven by the regular maintenance of hospitals, schools, hotels, offices, public buildings, and other commercial facilities. These environments require specialized floor cleaners, surface disinfectants, washroom cleaners, degreasers, and heavy-duty sanitation products to maintain cleanliness and meet hygiene requirements.
According to the US Bureau of Labor Statistics, approximately 2.4 million janitors and building cleaners were employed in 2025. Educational services accounted for 17% of their employment, while healthcare and social assistance represented 7%. This demonstrates the significant role of institutional facilities in generating recurring cleaning requirements. The segment also benefits from professional cleaning contracts, scheduled sanitation programmes, and increased attention to infection prevention.
By Sales Channel Analysis
Retail – Wide product availability and convenient purchasing options support segment dominance.
In 2025, “Retails” held a dominant market position, capturing more than a 46.78% share of the Cleaning Chemicals Market by Sales Channel. The segment benefits from the widespread availability of cleaning products through supermarkets, hypermarkets, convenience stores, and specialty retail outlets. Residential consumers and small businesses prefer retail channels because they allow direct product selection, comparison of brands, and immediate purchases.
E-commerce is gaining importance in the cleaning chemicals market as consumers and institutional buyers increasingly prefer online platforms for convenient product selection and repeat purchases. Online channels provide access to different brands, product specifications, customer reviews, bulk packaging, and subscription-based purchasing options.
According to the US Census Bureau, total US retail e-commerce sales reached USD 1,233.7 billion in 2025, registering a 5.4% increase compared with 2024. E-commerce accounted for 16.4% of total US retail sales during the year. This growth highlights the increasing importance of online distribution and creates opportunities for cleaning chemical manufacturers to expand their digital presence, offer bulk purchasing options, and reach customers through online marketplaces.
Key Market Segments
By Product Type
- Sanitizers And Disinfectants
- Glass & Façade Cleaners
- Kitchen/Food Hygiene Cleaners
- Sanitary Cleaners
- Laundry Cleaning
- Others
By End User
- Residential
- Institutional
- Industrial
By Sales Channel
- Retails
- E-commerce
- Direct Sales
Driver Analysis
Household Format Upgrading
Consumer migration from basic powders and bars toward liquid detergents, dishwashing liquids and application-specific formulations increases category value where convenience and measured performance justify higher expenditure per cleaning task. Hindustan Unilever’s FY2025–26 reporting provides current company-level evidence: Home Care generated INR 23,672 crore of revenue, delivered high-single-digit underlying volume growth and 4% underlying sales growth, while its liquids portfolio crossed INR 4,000 crore and recorded strong double-digit underlying sales growth.
In a hypothetical cohort of 100,000 households, assume 20% convert from a basic product costing USD 0.08 per wash to a differentiated formulation costing USD 0.11, at 200 washes annually. Converted households increase expenditure from USD 320,000 to USD 440,000, creating USD 120,000 of incremental annual category value, or 7.5% relative to the cohort’s original USD 1.6 million expenditure. The example assumes equal wash frequency and effective dosing; liquid format alone does not guarantee superior performance or higher realized value.
Suppliers capture growth through trial packs, refill availability, distribution and formulation differentiation, although overconcentration, poor dosing instructions or price gaps can undermine repeat purchasing. The +1.0 pp contribution assumes 25% revenue exposure grows 4.0 percentage points faster through net household adoption and product-mix improvement, deducting displaced powder and bar sales rather than counting liquids as wholly additional demand.
Drivers Impact Analysis
| Driver | (~) % Impact on CAGR Forecast | Geographic Relevance | Impact Timeline |
|---|---|---|---|
| Household format upgrading | +1.0 pp | India, Indonesia, Brazil | Short term (≤ 2 years) |
| Hospitality cleaning throughput | +0.8 pp | Spain, France, Saudi Arabia, Thailand | Short term (≤ 2 years) |
| Healthcare hygiene protocols | +0.7 pp | US, Germany, UK, Japan | Short term (≤ 2 years) |
| Food-production sanitation | +0.6 pp | US, EU, China, India | Short term (≤ 2 years) |
| Performance-based chemical purchasing | +0.5 pp | US, EU, Australia, Singapore | Medium term (2–4 years) |
Restraint Analysis
Premium-Product Affordability Limits
Household format upgrading cannot expand indefinitely when the incremental cost per cleaning task exceeds consumers’ willingness or ability to pay, limiting conversion into higher-value liquids and specialist products without necessarily reducing essential cleaning frequency. Hindustan Unilever’s FY2025–26 reporting shows that Home Care volume growth exceeded underlying sales growth and describes calibrated pricing alongside premiumization, demonstrating that stronger physical demand does not automatically translate into proportionate revenue growth; this company evidence does not establish a country-wide downtrading rate.
In a hypothetical cohort of 100,000 households performing 200 washes annually, a basic formulation costing USD 0.08 per wash requires USD 16 of annual expenditure per household, compared with USD 22 for a USD 0.11 alternative—a 37.5% increase. If a supplier expects 20,000 households to convert but only 12,000 accept the premium, the unrealized annual revenue uplift is USD 48,000: 8,000 households multiplied by 200 washes and a USD 0.03 differential.
The full premium-product sales value is not lost market revenue because those households continue buying the basic alternative. Smaller packs may reduce the immediate cash outlay but do not necessarily improve cost per wash, while promotional support can erode the margin expected from premiumization. The −0.50 pp contribution assumes 20% revenue exposure grows 2.5 percentage points more slowly through lower-than-assumed mix upgrading, excluding supplier-share shifts and simple nominal price reductions.
Restraint Impact Analysis
| Restraint | (~) % Impact on CAGR Forecast | Geographic Relevance | Impact Timeline |
|---|---|---|---|
| Premium-product affordability limits | −0.50 pp | India, Indonesia, Brazil | Short term (≤ 2 years) |
| Antimicrobial registration barriers | −0.40 pp | US | Short term (≤ 2 years) |
| Hazardous-mixture market-access rules | −0.30 pp | EU, EEA | Short term (≤ 2 years) |
| Selective disinfection requirements | −0.35 pp | US household, community facilities | Medium term (2–4 years) |
| Chemical-consumption efficiency ceilings | −0.25 pp | US, Germany, UK, Australia | Medium term (2–4 years) |
Opportunity Analysis
Refill-Channel Expansion
Suppliers could establish closed-loop refill channels that reach underserved households or institutional microbusinesses, using lower packaging and distribution costs to improve affordability without relying solely on premium-product pricing. The EU’s revised detergents framework explicitly addresses refill sales, including labeling, exposure mitigation and measures preventing incompatible products from being mixed; the Council’s December 2025 announcement identifies refill distribution as an area covered by the modernization. These provisions create a clearer operating framework, not proof of consumer adoption or a reason to assume every requirement applied immediately in 2026.
The incremental opportunity is demand recovered from non-users or under-served customers through a new channel—not transferring existing bottled sales into refill containers and counting them again. In an illustrative 200-outlet network, 250 participating households per outlet purchasing six litre-equivalents annually generate 300,000 litre-equivalents. At USD 1.50 of supplier revenue per litre-equivalent, gross annual chemical sales are USD 450,000; if 60% displaces existing in-scope purchases at the same realized value, net additional revenue is USD 180,000.
A hypothetical USD 0.20 reduction in packaging and outbound handling per litre-equivalent releases USD 60,000 before refill-system operation, retailer compensation and losses. Suppliers must validate container compatibility, product identity, contamination controls and repeat-purchase economics. The +0.40 pp coefficient assumes 10% revenue exposure grows 4.0 percentage points faster through net-new channel demand, excluding refill equipment, packaging revenue and demand already allocated to household format upgrading.
Opportunity Impact Analysis
| Opportunity | (~) % Potential CAGR Upside | Geographic Relevance | Execution Window |
|---|---|---|---|
| Refill-channel expansion | +0.40 pp | Germany, France, Netherlands, India | Medium term (2–4 years) |
| Microbial maintenance formulations | +0.30 pp | Germany, France, Netherlands | Medium term (2–4 years) |
| Electronics precision-cleaning packages | +0.30 pp | Taiwan, South Korea, Japan, Malaysia | Medium term (2–4 years) |
| Reusable-packaging wash chemistry | +0.25 pp | Germany, France, Netherlands | Medium term (2–4 years) |
| Validated small-batch cleaning systems | +0.25 pp | US, Germany, India, Ireland | Medium term (2–4 years) |
Challenges Analysis
Feedstock Procurement and Repricing
Cleaning-chemical manufacturers must coordinate formulation-dependent raw materials, packaging and delivery commitments while input costs and availability move faster than customer repricing cycles, creating working-capital and contribution-margin volatility without necessarily stopping sales. Ecolab’s 2026 public filings identify difficulty procuring raw materials, raw-material cost fluctuations, supply-chain challenges, trade-policy exposure and contractual limits on pricing flexibility as continuing risks; these disclosures establish the mechanism, not a measured cost increase for the entire cleaning-chemicals market.
In an illustrative manufacturer with USD 100 million of annual sales and USD 35 million of raw-material expenditure, an 8% input-cost increase adds USD 2.8 million annually. A three-month repricing lag creates approximately USD 700,000 of unoffset cost exposure, assuming uniform purchasing and no hedging or inventory benefit. Increasing raw-material cover from 45 to 60 days ties up approximately USD 1.44 million at the original expenditure rate, or USD 1.55 million after the assumed inflation.
Neither amount is itself lost market revenue; the commercial damage arises if cash absorption constrains expansion, shortages reduce order fulfillment or surcharges weaken retention. Suppliers need approved alternatives, visibility into critical inputs, differentiated safety stocks and contracts that balance service continuity with repricing flexibility. The −0.30 pp contribution assumes 15% revenue exposure grows 2.0 percentage points more slowly through residual procurement-related delivery losses and constrained expansion, excluding nominal price inflation, full production shutdowns and affordability-related demand rejection already assigned to restraints.
Challenges Impact Analysis
| Challenge | (~) % CAGR Friction Drag | Geographic Relevance | Mitigation Horizon |
|---|---|---|---|
| Feedstock procurement and repricing | −0.30 pp | US, EU, China, India | Medium term (2–4 years) |
| Reformulation and batch consistency | −0.25 pp | US, EU, Japan | Long term (≥ 4 years) |
| Variable field cleaning conditions | −0.25 pp | India, China, US, EU | Long term (≥ 4 years) |
| Distributed dosing and training | −0.20 pp | US, UK, Germany, India | Long term (≥ 4 years) |
| Portfolio and inventory complexity | −0.20 pp | US, EU, Brazil, Southeast Asia | Medium term (2–4 years) |
Geopolitical Impact Analysis
Impact of the Ongoing Middle East War on the Cleaning Chemicals Market
The ongoing US-Israel-Iran conflict in the Middle East is creating pressure on the global cleaning chemicals industry through higher energy costs, shipping delays, and uncertainty in chemical raw material supplies. The conflict has disrupted movement through the Strait of Hormuz, affecting the availability and transportation costs of petroleum-based ingredients, including surfactants, solvents, and other chemical intermediates used in cleaning formulations.
According to the US Energy Information Administration, Brent crude oil averaged USD 124 per barrel in October 2026, increasing production and transportation cost pressures for chemical manufacturers. The International Energy Agency has also reported that approximately 20% of global liquefied natural gas supply moved through the Strait of Hormuz in 2025, highlighting the region’s importance to industrial energy supplies.
Higher freight charges and insurance premiums are adding further pressure on manufacturers and distributors. As a result, cleaning chemical companies may face higher input costs, delayed deliveries, and reduced profit margins. These conditions are encouraging manufacturers to diversify suppliers, maintain additional raw material inventories, and strengthen regional sourcing networks. Prolonged conflict could increase product prices and create opportunities for local chemical production and alternative bio-based formulations.
Regional Insights
Asia-Pacific – 38.78% Market Share | USD 18.2 Billion
Asia-Pacific dominated the Cleaning Chemicals Market in 2025, accounting for 38.78% of the global market, with a market value of USD 18.2 billion. The region’s leadership is supported by strong chemical manufacturing capabilities, increasing household hygiene awareness, expanding commercial infrastructure, and rising demand from healthcare, hospitality, food processing, and industrial facilities. China, Japan, and South Korea remain important contributors due to their established chemical production bases and industrial cleaning requirements.
According to China’s National Bureau of Statistics, chemical raw material and chemical product manufacturing increased by 7.8% in 2025, reflecting strong industrial activity and supporting demand for cleaning agents, solvents, and specialty chemical formulations. This industrial expansion strengthens regional demand for both household and institutional cleaning products.
Within Asia-Pacific, industrial and institutional cleaning applications represent important growth opportunities. Expanding manufacturing facilities, healthcare infrastructure, commercial buildings, hotels, and food processing operations are increasing the need for specialized cleaning chemicals. China recorded 6.4% growth in manufacturing value added in 2025, while chemical manufacturing increased by 7.8% during the same year. These developments support demand for industrial degreasers, surface disinfectants, floor cleaners, equipment cleaning agents, and specialty sanitation products.
Manufacturers are also focusing on concentrated formulations, biodegradable ingredients, and low-toxicity products to meet changing environmental requirements. Growing adoption of professional facility management and automated cleaning systems is creating additional opportunities for suppliers across the region.
Key Regions and Countries Insights
- North America
- US
- Canada
- Europe
- Germany
- France
- The UK
- Spain
- Italy
- Rest of Europe
- Asia Pacific
- China
- Japan
- South Korea
- India
- Australia
- Rest of APAC
- Latin America
- Brazil
- Mexico
- Rest of Latin America
- Middle East & Africa
- GCC
- South Africa
- Rest of MEA
Key Players Analysis
BASF SE maintains a strong position in the cleaning chemicals industry through its Care Chemicals division, which supplies surfactants, enzymes, chelating agents, biocides, and specialty ingredients for household and industrial cleaning products. In 2025, BASF reported total group sales of EUR 59.657 billion, while its Care Chemicals division generated EUR 4.765 billion in sales. The company continues to focus on sustainable formulations, improved cleaning performance, and advanced ingredients for home care and institutional cleaning applications.
Dow Inc. supports the cleaning chemicals industry through specialty ingredients, surfactants, silicones, and formulation technologies used in household, commercial, and industrial cleaning applications. In 2025, the company recorded net sales of approximately USD 39.97 billion and invested USD 752 million in research and development. Its product development activities focus on improving cleaning efficiency, formulation stability, and sustainability. Dow’s broad manufacturing network and technical expertise help it serve cleaning product manufacturers across multiple international markets.
3M Company participates in the cleaning products industry through consumer cleaning solutions, surface-care products, cleaning tools, and commercial maintenance products. In 2025, the company reported total net sales of USD 24.948 billion, representing 1.5% annual growth. Its Consumer business generated USD 4.920 billion, while Safety and Industrial recorded USD 11.384 billion in sales. The company continues to focus on product innovation, operational efficiency, and improved cleaning solutions for household and professional users.
Top Key Players Outlook
- BASF SE
- Dow Inc.
- 3M Company
- Reckitt Benckiser Group plc
- Evonik Industries
- Ecolab Inc.
- DuPont de Nemours Inc.
- Akzo Nobel N.V.
- Kao Corporation
- Albemarle Corporation
- Eastman Chemical Company
- The Clorox Company
- Lanxess AG
- Solvay S.A.
- Huntsman International LLC
- Clariant AG
- Stepan Company
- Pilot Chemical Company
- Spartan Chemical Company Inc.
- Dober Chemical Corp.
- Haylide Chemicals Pvt. Ltd.
- Nutan Chemicals
- Grand Chemical Works
- Other Key Players
Recent Developments
- In March 2026, Reckitt highlighted the success of Dettol Activ-Botany, reporting that the product exceeded initial adoption forecasts by 23% and achieved a 44% share of TikTok’s hygiene category in China in 2025.
- In March 2026, Evonik reported total group sales of EUR 14.1 billion for 2025, with adjusted EBITDA of EUR 1.87 billion and free cash flow of EUR 695 million. The company also confirmed a 2026 adjusted EBITDA outlook of EUR 1.7 billion to EUR 2.0 billion, supporting continued investment in specialty chemicals and innovation.
- In March 2026, Ecolab announced an agreement to acquire CoolIT Systems for approximately USD 4.75 billion. CoolIT was expected to generate around USD 550 million in sales over the following 12 months.
Report Scope
| Report Features | Description |
|---|---|
| Market Value (2025) | USD 47.2 Bn |
| Forecast Revenue (2035) | USD 108.7 Bn |
| CAGR (2026-2035) | 8.7% |
| Base Year for Estimation | 2025 |
| Historic Period | 2020-2024 |
| Forecast Period | 2026-2035 |
| Report Coverage | Revenue Forecast, Market Dynamics, Competitive Landscape, Recent Developments |
| Segments Covered | By Product Type (Sanitizers And Disinfectants, Glass & Façade Cleaners, Kitchen/Food Hygiene Cleaners, Sanitary Cleaners, Laundry Cleaning, Others), By End User (Residential, Institutional, Industrial), By Sales Channel (Retails, E-commerce, Direct Sales) |
| Regional Analysis | North America – US, Canada; Europe – Germany, France, The UK, Spain, Italy, Rest of Europe; Asia Pacific – China, Japan, South Korea, India, Australia, Singapore, Rest of APAC; Latin America – Brazil, Mexico, Rest of Latin America; Middle East & Africa – GCC, South Africa, Rest of MEA |
| Competitive Landscape | BASF SE, Dow Inc., 3M Company, Reckitt Benckiser Group plc, Evonik Industries, Ecolab Inc., DuPont de Nemours Inc., Akzo Nobel N.V., Kao Corporation, Albemarle Corporation, Eastman Chemical Company, The Clorox Company, Lanxess AG, Solvay S.A., Huntsman International LLC, Clariant AG, Stepan Company, Pilot Chemical Company, Spartan Chemical Company Inc., Dober Chemical Corp., Haylide Chemicals Pvt. Ltd., Nutan Chemicals, Grand Chemical Works, Other Key Players |
| Customization Scope | Customization for segments, region/country-level will be provided. Moreover, additional customization can be done based on the requirements. |
| Purchase Options | We have three licenses to opt for: Single User License, Multi-User License (Up to 5 Users), Corporate Use License (Unlimited User and Printable PDF) |