Report Overview
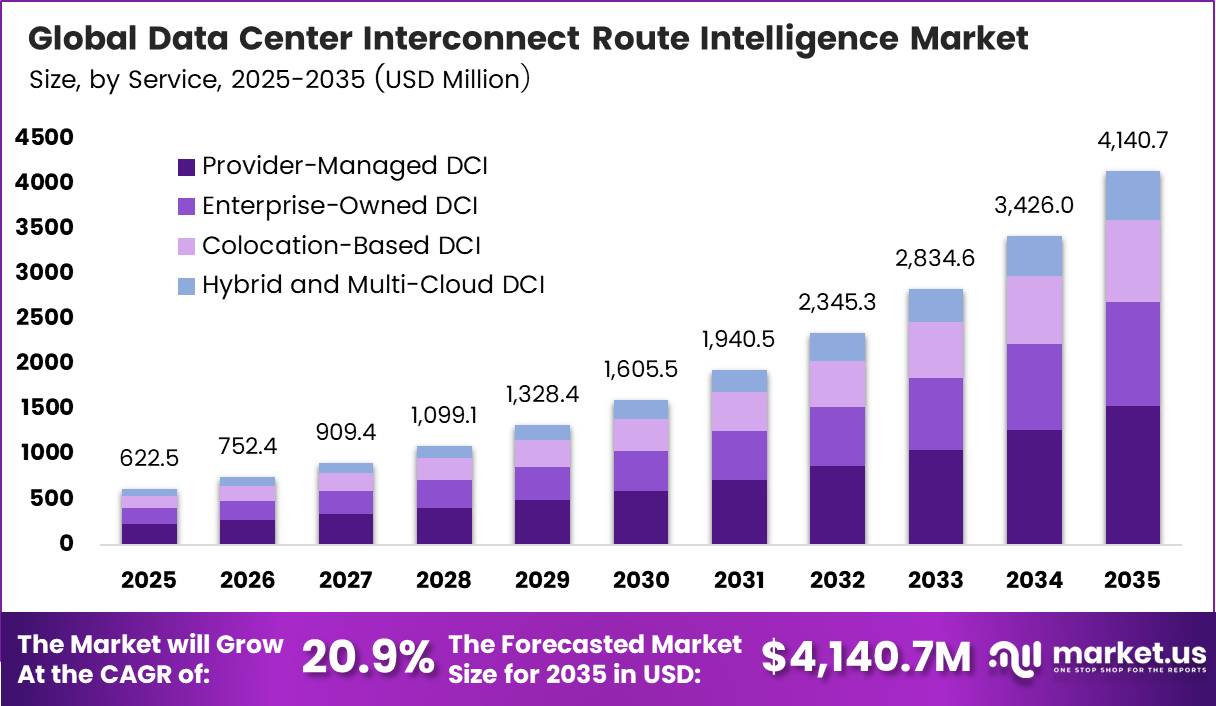
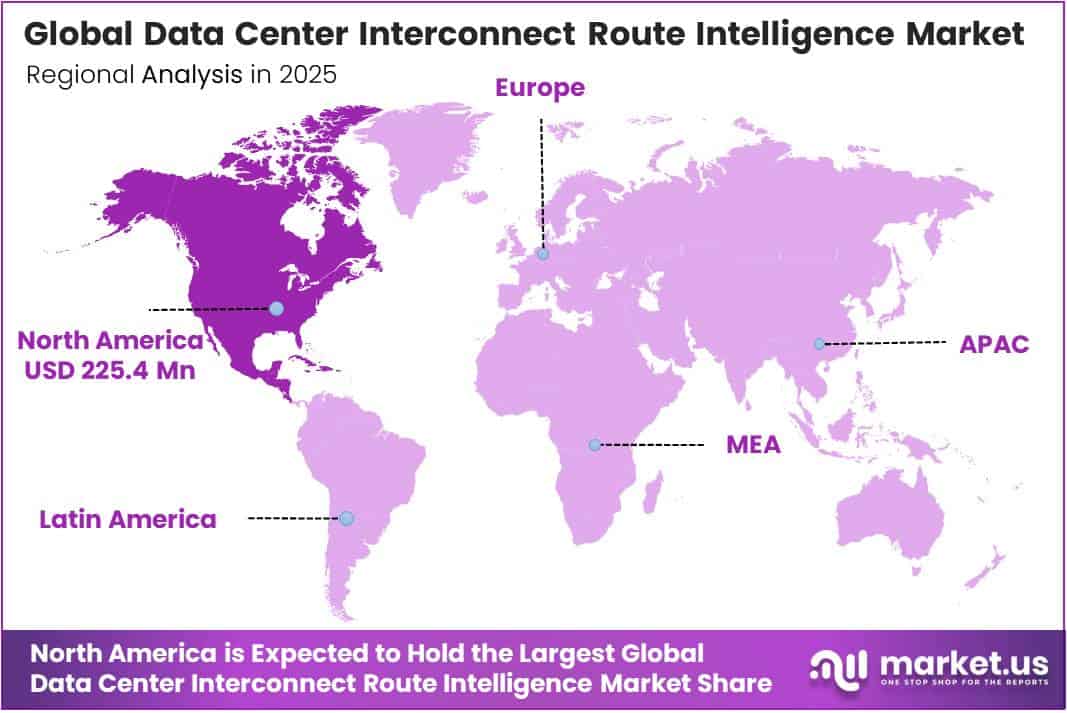
In 2025, the Global Data Center Interconnect Route Intelligence Market was valued at USD 622.5 million. The market is projected to grow at a CAGR of 20.9% during 2026–2035, reaching approximately USD 4,140.7 million by 2035. North America dominated the global market in 2025, accounting for more than 36.2% of the total market share and generating approximately USD 225.4 million in revenue.
AI workloads drive most of this growth. The IEA reported that data centers used about 415 TWh of power in 2024. The IEA expects that figure to more than double to around 945 TWh by 2030, a rise of about 15% each year. That is more than 4 times faster than power demand from all other sectors. The IEA also sees data center use rising to about 1,200 TWh by 2035.
Every new megawatt of AI compute adds traffic between sites. Operators split GPU clusters across campuses because a single 100 MW site can draw as much power as 100,000 households. This pushes demand for high-capacity optical links and smart routing software that steers traffic in real time.
The IEA found that the United States accounts for by far the largest part of new data center power demand, and that the US and China together drive almost 80% of the global rise to 2030. US hyperscalers build multi-gigawatt AI campuses that need many terabits of capacity between nearby sites. Ciena, a US-based optical leader, reported FY2025 revenue of USD 4.77 billion, up 19% year over year.
Key Takeaways
- The Data Center Interconnect Route Intelligence Market reached USD 622.5 million in 2025 and will reach USD 4,140.7 million by 2035. at a CAGR of 20.9% from 2026 to 2035.
- By Solution, Hardware and Optical Transport leads with a 54.3% share.
- By Connectivity Medium, Wavelength Services leads with a 30.2% share.
- By Data Rate, 400G leads with a 28.2% share.
- By Deployment, Provider-Managed DCI leads with a 37.3% share.
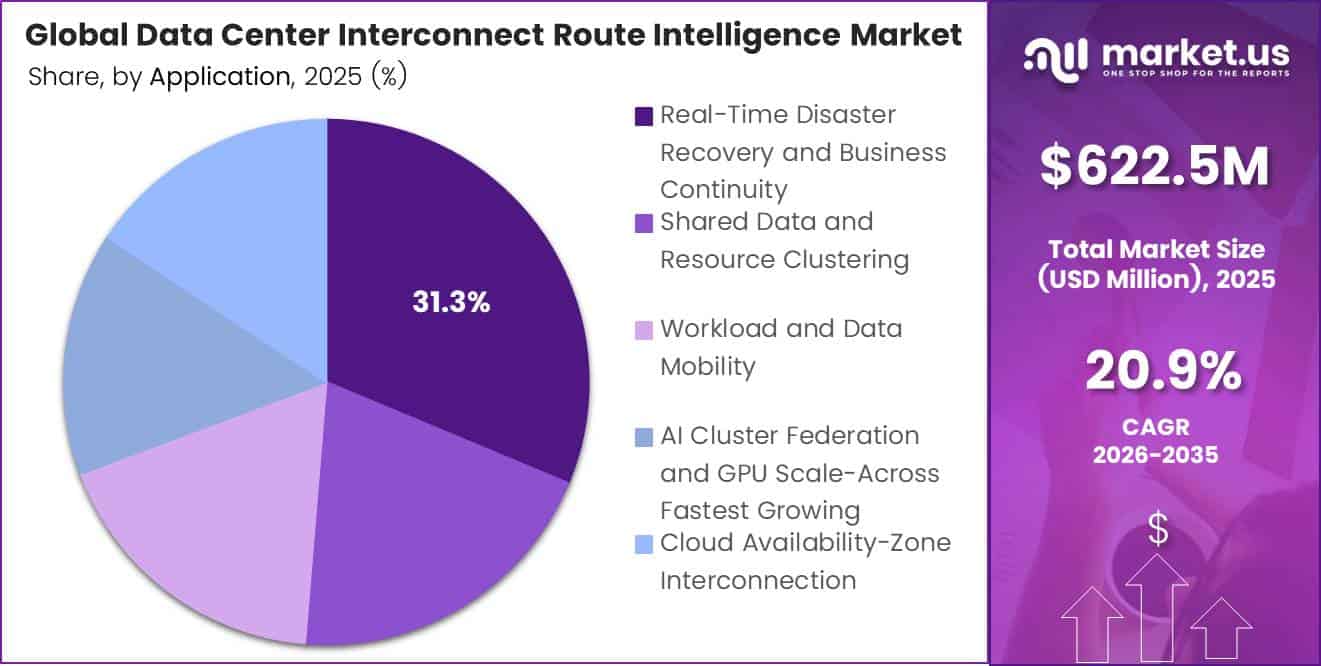
- By Application, Real-Time Disaster Recovery and Business Continuity leads with a 31.3% share.
- North America leads with a 36.2% share, worth USD 225.4 million.
By Solution
Hardware and Optical Transport dominates with 54.3% due to heavy coherent optics and line-system spending.
Hardware and Optical Transport leads because every interconnect link needs physical gear before any routing logic can run. Ciena posted Q3 FY2025 revenue of $1.7 billion, up 37% year on year. The company said strong AI demand for optical links across WAN and data center markets drove this growth.
Route-Intelligence Software grows fastest as operators look for smarter ways to manage busy links. Arista’s FY2025 service revenue rose about 28% to $1.4 billion, which shows steady spending on software support, telemetry, and network automation. Teams now want tools that pick the best path, predict congestion, and reroute traffic in seconds.
By Connectivity Medium
Wavelength Services dominates with 30.2% due to fast, scalable leased capacity between sites.
Wavelength Services holds the top spot because firms get dedicated, high-speed capacity without having to own or run fiber themselves. Demand for links between facilities keeps climbing. Equinix passed 500,000 interconnections worldwide and added 7,800 net connections in a single quarter.
Equinix also grew interconnection revenue by 9% year on year, which shows that buyers keep paying for ready-made links. Leased wavelengths fit this need well, because they deploy fast and scale in clear steps.
IPoDWDM and Routed Optical Networking grows fastest because it folds optical transport into the router itself. This cuts out extra boxes, saves power, and shrinks floor space. Arista reported FY2025 revenue of $9.006 billion, up 28.6%, as large cloud and AI operators bought routing platforms that link GPUs, compute and storage. Operators now prefer simpler, flatter networks that one team can manage end to end.
By Data Rate
400G dominates with 28.2% due to a mature, low-cost pluggable optics ecosystem.
400G leads because it offers the best balance of price, power use, and supply today. Most operators have already built their metro and regional DCI around 400G pluggables. This makes 400G the safe, proven choice for daily traffic.
Supplier scale supports this base. Ciena guided full-year FY2025 revenue to a midpoint of $6.42 billion. Its reconfigurable line systems hold about 70% share among hyperscaler deployments, giving buyers a stable platform to run 400G waves at volume.
1.6T and Above grows fastest as AI clusters push link needs far beyond current limits. Ciena reported that its 1.6T-capable WaveLogic 6 Extreme modem is ramping faster than the previous generation. Shipments of its 800G pluggables also doubled from one quarter to the next. Operators move to 1.6T to carry more traffic per fiber pair and lower the cost per bit, so this tier is gaining speed.
By Deployment
Provider-Managed DCI dominates with 37.3% due to outsourced operations and guaranteed service levels.
Provider-Managed DCI leads because most firms would rather buy a finished service than build and staff their own optical network. Digital demand keeps rising fast. ITU data shows 6 billion people, or 74% of the world, were online in 2025.
Internet use grew 3.3% year on year, which pushes more traffic between data centers. Carriers can meet this demand at scale with shared networks, set service terms, and round-the-clock monitoring. That makes the managed model the default for most enterprises.
Hybrid and Multi-Cloud DCI grows fastest because firms now spread workloads across several clouds and regions at once. IEA data shows the United States held 45% of global data center power use in 2024, China held 25%, and Europe held 15%. Workloads are spread across these regions, so firms need links that join private sites with many cloud regions. This drives quick uptake of hybrid designs.
By Application
Real-Time Disaster Recovery and Business Continuity dominates with 31.3% due to strict uptime and data-protection mandates.
Real-Time Disaster Recovery and Business Continuity leads because no firm can afford to lose live data or stay offline for long. Data centers used about 415 TWh of power in 2024, close to 1.5% of global electricity, which shows how much of the economy now runs on them.
AI Cluster Federation and GPU Scale-Across grows fastest as single sites run out of power and space. The IEA expects data center electricity use to reach about 945 TWh by 2030, with AI server power use rising about 30% each year. Operators now split training jobs across several campuses and link GPUs with very high-speed optics. This scale-across model is fueling sharp growth.
Key Market Segments
By Solution
- Hardware and Optical Transport
- Route-Intelligence Software
- Managed Connectivity Services
- Professional Services and Integration
By Connectivity Medium
- Wavelength Services
- Dark Fiber
- Carrier Ethernet
- IPoDWDM and Routed Optical Networking
- Submarine Cable Systems
By Data Rate
- Up to 100G
- 200G and 300G
- 400G
- 800G
- 1.6T and Above
By Deployment
- Provider-Managed DCI
- Enterprise-Owned DCI
- Colocation-Based DCI
- Hybrid and Multi-Cloud DCI
By Application
- Real-Time Disaster Recovery and Business Continuity
- Shared Data and Resource Clustering
- Workload and Data Mobility
- AI Cluster Federation and GPU Scale-Across
- Cloud Availability-Zone Interconnection
Geopolitical Impact Analysis
US and China trade tensions now shape the cost of optical gear. In 2025, the US raised Section 301 tariffs on Chinese Streaming Analytics to 50%. That hits the DSP chips, lasers, and optical modules inside coherent transceivers. Vendors that build in China face higher landed costs, so many now assemble in Thailand, Malaysia, and Mexico.
Raw materials add more risk. China supplies most of the world’s gallium and germanium. It placed export controls on both in 2023 and banned their sale to the US in December 2024. Germanium and indium phosphide feed photodetectors and laser chips. When supply tightens, component makers pay more, and they pass those costs on to buyers.
Shipping problems stretch lead times. UNCTAD reported that Red Sea attacks cut Suez Canal transits by more than 40% at the peak. Ships that go around the Cape of Good Hope add about 10 to 14 days to Asia and Europe routes. Submarine cable laying ships and line systems face the same risks, and repair work in contested waters has slowed.
The WTO has warned that tariff escalation could cut goods trade growth. The IMF has also lowered its global growth outlook because of trade uncertainty. For buyers, this means longer orders, buffer stocks of optics, and more interest in open line systems that let them switch suppliers. Route-intelligence software gains from this shift, because operators want tools that move traffic away from at-risk paths and suppliers.
Regional Analysis
North America dominates the Data Center Interconnect Route Intelligence Market, holding a 36.2% share and generating USD 225.4 million in revenue. The US hosts the largest group of hyperscale operators in the world: Microsoft, Amazon, Google, Meta, and Oracle. These firms now build AI campuses rated at more than 1 GW each.
One campus often spreads over several buildings or sites within 80 km of each other. That design needs dense wavelength links and smart routing to keep GPU clusters in sync. The US Department of Energy reported that data centers used about 4.4% of total US electricity in 2023. It expects that share to reach 6.7% to 12% by 2028.
Asia Pacific is the fastest-growing region in the market. China leads regional demand through its “East Data, West Computing” program. That program links 8 national computing hubs and 10 data center clusters. Japan and South Korea are adding AI capacity around Tokyo, Osaka, and Seoul.
Key Regions and Countries
North America
- US
- Canada
Europe
- Germany
- France
- The UK
- Spain
- Italy
- Rest of Europe
Asia Pacific
- China
- Japan
- South Korea
- India
- Australia
- Rest of APAC
Latin America
- Brazil
- Mexico
- Rest of Latin America
Middle East and Africa
- GCC
- South Africa
- Rest of MEA
Market Dynamics
Drivers
| Driver | (~) % Impact on CAGR Forecast | Geographic Relevance | Impact Timeline |
|---|---|---|---|
| AI Training Cluster Interconnect Buildout | +3.4% | North America, Asia Pacific | Short term (2 years or less) |
| 800G/1.6T Coherent Pluggable Adoption | +2.1% | Global | Short term (2 years or less) |
| Multi-Cloud Route Diversity Mandates | +1.6% | North America, Europe | Medium term (2 to 4 years) |
| Hyperscaler Dark Fiber Leasing Growth | +1.3% | North America, Europe, Middle East | Short term (2 years or less) |
| Operational Resilience Regulations (DORA) | +1.1% | Europe | Short term (2 years or less) |
| Network Telemetry & Streaming Analytics | +0.9% | Global | Medium term (2 to 4 years) |
AI Training Cluster Interconnect Buildout
Distributed AI training now links clusters across campuses and metros, so the business has shifted. Route intelligence used to be a static fiber-map licence. It is now a subscription for real-time latency and diversity analytics, priced per path and per wavelength. Per hyperscaler earnings calls, combined capital expenditure from the largest four US cloud operators passed US$200 billion in 2024 and rose by more than 40% in 2025.
A large and growing share of that spending went to multi-site GPU campuses, which need deterministic inter-site latency under 1 ms for synchronous training. Per Uptime Institute operator surveys, rack densities above 30 kW are becoming common in AI halls. That density forces new campuses toward power-rich rural sites 50 to 200 km from existing metro hubs, which multiplies the number of route segments that must be validated.
Restraints
| Restraint | (~) % Impact on CAGR Forecast | Geographic Relevance | Impact Timeline |
|---|---|---|---|
| Critical Infrastructure Map Disclosure Restrictions | -1.9% | North America, Europe, China | Short term (2 years or less) |
| Elevated Cost of Capital for Carriers | -1.4% | Global | Short term (2 years or less) |
| Data Localization & Cross-Border Bans | -1.1% | China, India, Russia, Middle East | Medium term (2 to 4 years) |
| Proprietary Carrier Route Data Lock-In | -0.9% | Global | Medium term (2 to 4 years) |
| Export Controls on Advanced Network Analytics | -0.7% | China, Russia | Short term (2 years or less) |
Critical Infrastructure Map Disclosure Restrictions
The root cause is security classification of physical fiber paths. Governments increasingly treat geospatial route data as sensitive critical-infrastructure information. CISA guidance on communications-sector critical infrastructure limits what operators can share.
The quantitative bottleneck: route intelligence platforms typically need 70% to 80% geospatial completeness to produce diversity scores that buyers can certify. Where carriers redact conduit coordinates, coverage falls below 50% in affected corridors, and those deals stall at procurement.
The strategic impact is delayed CapEx on analytics tools. Enterprises and financial institutions defer platform purchases until legal teams clear data-handling terms, which adds 6 to 9 months to sales cycles. Vendors also face roughly 3 to 5 points of gross-margin compression from compliance hosting and security clearances.
Challenges
| Challenge | (~) % CAGR Friction Drag | Geographic Relevance | Mitigation Horizon |
|---|---|---|---|
| Fragmented Fiber Inventory Data | -1.5% | Global | Medium term (2 to 4 years) |
| Optical Network Engineering Talent Shortage | -1.1% | North America, Europe, Asia Pacific | Long term (4 years or more) |
| Multi-Vendor Telemetry Interoperability Gaps | -0.8% | Global | Medium term (2 to 4 years) |
| Subsea Cable Fault Exposure | -0.6% | Red Sea, Baltic, Asia Pacific | Medium term (2 to 4 years) |
| Power-Constrained Site Relocation Volatility | -0.5% | North America, Europe | Short term (2 years or less) |
Fragmented Fiber Inventory Data
The structural weakness is that fiber records are scattered across legacy GIS files, CAD drawings, and spreadsheets. Many carriers hold decades-old as-built records with lateral position errors of 10 to 30 m. That is enough to hide shared trenches across bridges and rail crossings.
According to TM Forum operator benchmarking, telecom operators spend roughly 20% to 30% of network-planning effort reconciling inventory data. Per NTIA BEAD program mapping work, federal broadband maps went through several challenge rounds to fix location errors.
For route intelligence vendors, the friction shows up as onboarding costs. Normalizing one regional carrier’s data can take 4 to 8 months and absorb 15% to 25% of first-year contract value. To cope, vendors need long-term fixes: data-sharing consortia, MEF and TM Forum open API standards, and machine-learning conflation pipelines. They also need to retrain field crews on GNSS-tagged as-built capture.
Opportunities
| Opportunity | (~) % Potential CAGR Upside | Geographic Relevance | Execution Window |
|---|---|---|---|
| Route Risk Scoring for Insurance & Finance | +2.2% | North America, Europe | Medium term (2 to 4 years) |
| Neutral Route Data Exchange Marketplaces | +1.7% | Global | Medium term (2 to 4 years) |
| Emerging Market Hyperscale Corridors | +1.4% | India, Southeast Asia, Middle East, Africa | Long term (4 years or more) |
| Digital Twin Integration for Grid-Fiber Co-Planning | +1.0% | North America, Europe | Long term (4 years or more) |
| Roll-Up of Regional GIS Specialists | +0.8% | North America, Europe | Short term (2 years or less) |
Route Risk Scoring for Insurance & Finance
This opportunity is still largely untapped. Route intelligence is sold almost entirely to network engineers today, while insurers, infrastructure lenders and data-center REIT investors underwrite connectivity risk with little or no path-level data.
Licensing standardized route-concentration scores as underwriting data would turn existing datasets into a high-margin information product. Incremental gross margins could exceed 80%, compared with 60% to 65% for engineering SaaS. The cost of serving each additional score would fall by more than 70%, because the underlying route graph is reused.
Key Players Analysis
Tier 1 leaders include Ciena, Nokia, Huawei, Cisco, and Juniper. Ciena posted Q4 FY2025 revenue of USD 1.35 billion, up 20% year over year. Its WaveLogic coherent optics lead many hyperscale DCI deals. Ciena spent about USD 758 million on R&D in FY2024. Nokia grew its optical business by buying Infinera for USD 2.3 billion. That price includes the repurchase of about USD 760 million in convertible notes.
Cisco reported FY2025 revenue of about USD 56.7 billion and invests more than USD 9 billion each year in R&D. It pushes routed optical networking through Acacia pluggables. HPE closed its USD 14 billion purchase of Juniper in July 2025, which combines Juniper’s routing with HPE’s data center reach. Huawei and ZTE lead in China and many emerging markets. Huawei spent more than CNY 179 billion on R&D in 2024.
Tier 2 challengers hold strong niche roles. Lumentum and Coherent supply lasers, transceivers, and optical parts to both Tier 1 vendors and hyperscalers. Coherent reported FY2025 revenue of about USD 5.8 billion. Lumentum gains from cloud demand for 800G and 1.6T transceivers.
Ekinops, ADTRAN, Ribbon, Smartoptics, and PacketLight serve regional carriers and enterprises with compact DCI platforms. ADTRAN reported 2024 revenue of about USD 923 million. Smartoptics focuses on open line systems for enterprise and colocation DCI.
Top Key Players in the Market
- Ciena Corporation
- Nokia Oyj
- Huawei Technologies Co., Ltd.
- ZTE Corporation
- Cisco Systems, Inc.
- Juniper Networks, Inc.
- Ekinops S.A.
- ADTRAN Holdings, Inc.
- Ribbon Communications Inc.
- Smartoptics Group AS
- PacketLight Networks Ltd.
- Lumentum Holdings Inc.
- Coherent Corp.
Recent Developments
- In February 2025, Nokia Oyj completed its USD 2.3 billion purchase of Infinera, a deal that greatly expands its optical networking business.
- In July 2025, Hewlett Packard Enterprise completed its USD 14 billion purchase of Juniper Networks, Inc. and added Juniper’s routing and AI-native networking to its range.
- In August 2025, Coherent Corp. agreed to sell its Aerospace and Defense business for USD 400 million, so it can focus on datacom and optical networking.
- In October 2025, Ciena Corporation agreed to buy Nubis Communications for about USD 270 million to add high-density interconnect for AI data centers. Ciena Corporation reported fiscal Q1 2026 revenue of about USD 1.43 billion, up 33% year over year, driven by cloud and DCI demand.
Report Scope
| Report Features | Description |
|---|---|
| Market Value (2025) | USD 622.5 Million |
| Forecast Revenue (2035) | USD 4,140.7 Million |
| CAGR (2026-2035) | 20.9% |
| Base Year for Estimation | 2025 |
| Historic Period | 2020-2024 |
| Forecast Period | 2026-2035 |
| Report Coverage | Revenue Forecast, Market Dynamics, Competitive Landscape, Recent Developments |
| Segments Covered | By Solution (Hardware and Optical Transport, Route-Intelligence Software, Managed Connectivity Services, Professional Services and Integration); By Connectivity Medium (Wavelength Services, Dark Fiber, Carrier Ethernet, IPoDWDM and Routed Optical Networking, Submarine Cable Systems); By Data Rate (Up to 100G, 200G and 300G, 400G, 800G, 1.6T and Above); By Deployment (Provider-Managed DCI, Enterprise-Owned DCI, Colocation-Based DCI, Hybrid and Multi-Cloud DCI); By Application (Real-Time Disaster Recovery and Business Continuity, Shared Data and Resource Clustering, Workload and Data Mobility, AI Cluster Federation and GPU Scale-Across, Cloud Availability-Zone Interconnection) |
| Regional Analysis | North America – US, Canada; Europe – Germany, France, The UK, Spain, Italy, Rest of Europe; Asia Pacific – China, Japan, South Korea, India, Australia, Singapore, Rest of APAC; Latin America – Brazil, Mexico, Rest of Latin America; Middle East & Africa – GCC, South Africa, Rest of MEA |
| Competitive Landscape | Ciena Corporation, Nokia Oyj, Huawei Technologies Co., Ltd., ZTE Corporation, Cisco Systems, Inc., Juniper Networks, Inc., Ekinops S.A., ADTRAN Holdings, Inc., Ribbon Communications Inc., Smartoptics Group AS, PacketLight Networks Ltd., Lumentum Holdings Inc., Coherent Corp. |
| Customization Scope | Customization for segments, region/country-level will be provided. Moreover, additional customization can be done based on the requirements. |
| Purchase Options | We have three licenses to opt for: Single User License, Multi-User License (Up to 5 Users), Corporate Use License (Unlimited Users and Printable PDF) |