


Report Overview
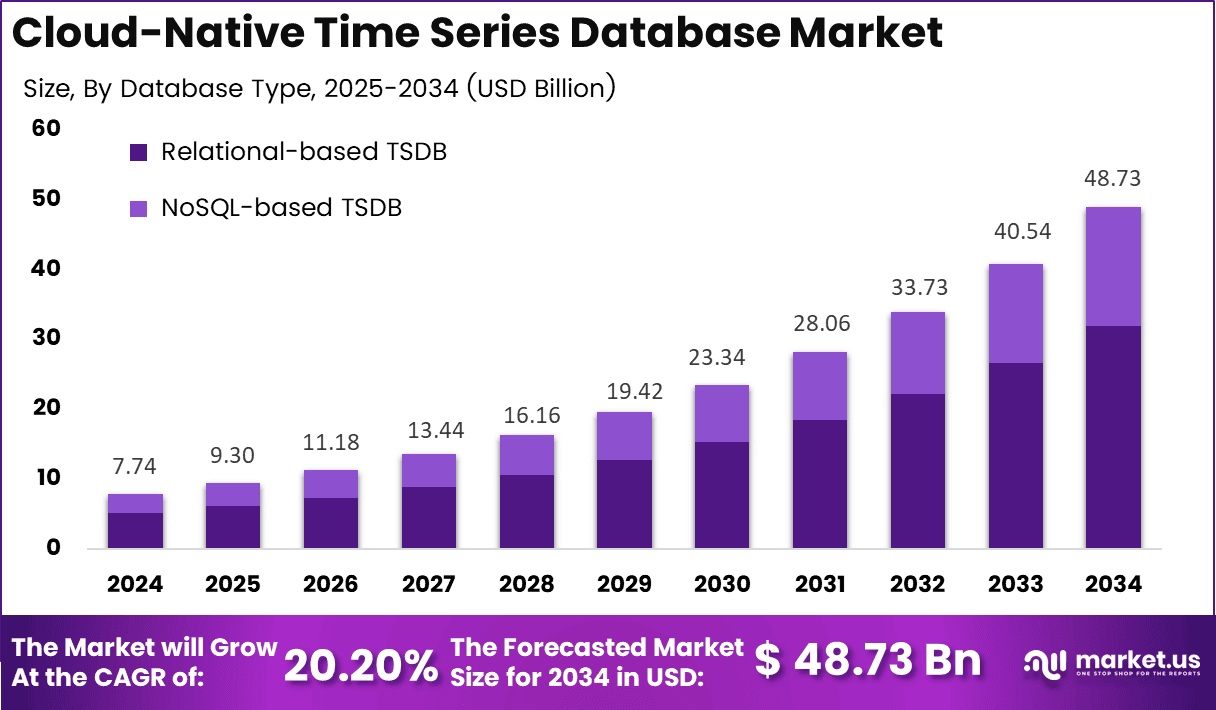
In 2024, the Global Cloud-Native Time Series Database Market was valued at USD 7.7 billion. The market is projected to grow at a CAGR of 20.2% during 2025–2034, reaching approximately USD 48.7 billion by 2034. North America held a dominant market position, capturing more than a 39.2% share, holding USD 2.8 billion in revenue.
Industrial users, telecom operators, retailers, and logistics companies increasingly rely on cloud-native time series databases to manage sensor readings, network events, transactions, and system logs. These databases support real-time monitoring, fault detection, demand planning, and automated decision-making without requiring companies to manage physical servers.
North America benefits from strong digital infrastructure and smart-grid adoption. U.S. utilities had installed about 119 million advanced smart meters, representing 72% of all U.S. electric meters. The U.S. Department of Energy also announced nearly USD 2 billion for 38 grid-resilience projects in October 2024, while global automobile production reached 75.5 million cars in 2024, further increasing the volume of sensor and performance data that requires scalable time-series storage.
Key Takeaways
- The Global Cloud-Native Time Series Database Market was valued at USD 7.7 billion in 2024 and is projected to reach USD 48.7 billion by 2034, growing at a 20.2% CAGR during 2025–2034.
- Public cloud led the deployment type segment with a 48.4% share, supported by scalability and lower infrastructure management requirements.
- Sensor data dominated the data source segment with a 38.6% share, driven by growing connected devices and real-time monitoring applications.
- Relational-based TSDB led the database type segment with a 65.6% share, reflecting strong adoption for structured time-series workloads.
- BFSI remained a major industry segment, supported by fraud analytics and a 22.1% growth factor.
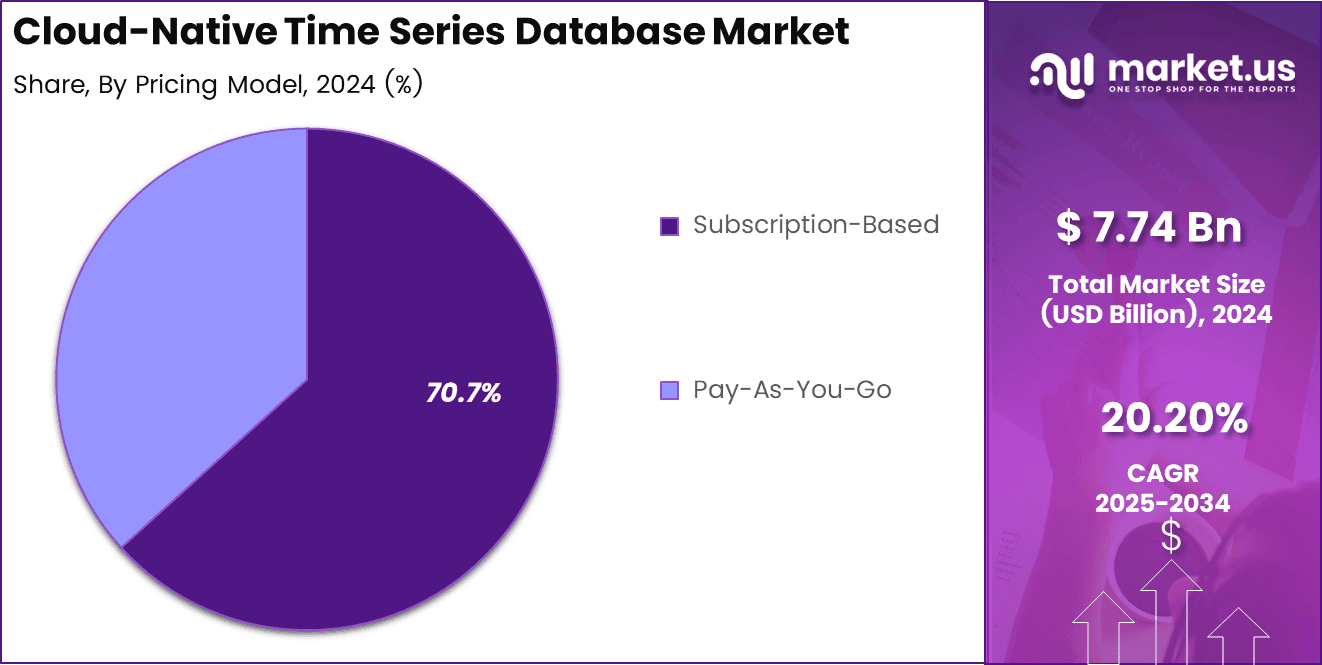
- Subscription-based offers flexible adoption and provides around 70.7% cost-saving potential, supporting initial market uptake.
- North America dominated the market with more than 39.2% share, generating around USD 2.8 billion in revenue.
By Deployment Type
The deployment type segment of the cloud-native time series database market encompasses public cloud, private cloud, and hybrid cloud, each contributing uniquely to growth. Public cloud holds a 48.4% share, with an additional 15.2% growth potential, valued at a notable amount, driven by scalability and cost-efficiency for IoT and analytics, projected to grow steadily to a substantial figure.
Private cloud, with about a 25% share and an extra 10.8% scalability factor at a meaningful value, focuses on security for sensitive data in healthcare and government, expected to rise at a moderate pace to a respectable amount, bolstered by compliance needs.
Hybrid cloud, with a balanced 26.6% share and a 12.5% adaptability boost at a reasonable value, bridges public scalability with private control, forecasted to expand at a steady rate to a significant amount, ideal for dynamic IT workloads. By a future point, public cloud may exceed half the market share, driven by edge computing and multi-cloud strategies, enhancing flexibility and real-time analytics across industries.
By Data Source
The data source segment includes sensor data, application performance data, network and device metrics, financial data, operational data, and others, each fueling market expansion. Sensor data leads with a 38.6% share, plus 20.1% innovation potential at a substantial value, growing at a strong pace to a significant figure, driven by IoT for predictive maintenance.
Application performance data, with a 22% share and 14.3% optimization gain at a meaningful amount, is set for steady growth to a respectable value, aiding DevOps with real-time monitoring. Network and device metrics, with an 18.5% share and 16.7% connectivity boost at a reasonable value, will rise at a solid rate to a notable amount, supporting 5G networks.
Financial data, with a 12.3% share and an 11.9% precision increase at a modest amount, targets steady growth to a growing value for trading analytics. Operational data, with a 5.6% share and 9.2% efficiency rise at a modest figure, and others, with a 3% share and 7.8% diversity factor at a minimal amount, are projected at moderate and gradual CAGRs to increasing values, respectively.
By Database Type
The database type segment comprises relational-based TSDB and NoSQL-based TSDB, shaping market dynamics. Relational-based TSDB dominates with a 65.6% share, plus an 18.4% reliability boost, valued at a significant amount, leveraging SQL for structured data, projected to grow at a strong pace to a substantial figure, ideal for BFSI transactions.
NoSQL-based TSDB, holding a 34.4% share with a 13.6% flexibility increase at a meaningful value, excels in unstructured data handling, forecasted to grow at a moderate pace to a respectable amount, suited for IoT high-velocity streams.
By a future point, relational-based TSDB may reach a dominant portion, while NoSQL-based could hit a growing segment, supported by hybrid optimizations. The predictive value lies in relational’s reliability for complex queries and NoSQL’s scalability, reducing costs and enabling real-time decisions, positioning them as pivotal for enterprise-grade applications and innovative data architectures across industries.
By Industry
The industry segment includes BFSI, government, education, IT & telecommunications, manufacturing, healthcare, retail & e-commerce, media & entertainment, and others, driving diverse applications.
BFSI leads with a major share at a substantial value, growing at a strong pace to a significant figure for fraud analytics, with a 22.1% growth factor. Government, with a notable share at a meaningful amount, targets steady growth to a respectable value for public safety, with a 15.3% compliance boost.
Education, with a modest share at a reasonable figure, and IT & Telecom, with a considerable share at a notable amount, are set for moderate and solid CAGRs to increasing values, with 12.7% and 19.8% innovation gains, respectively. Others, with a minimal share at a modest value, aim for gradual growth to a rising amount, with a 9.6% diversity increase.
By Pricing Model
Subscription-based dominates with a 70.7% share at a significant value, ensuring predictability, forecasted at a strong CAGR to a substantial amount, with a 20.9% loyalty increase. By a future point, pay-as-you-go may reach a growing portion, ideal for experimentation, while subscription-based could hit a dominant segment, leveraging premium features.
The pricing model segment features pay-as-you-go and subscription-based options, influencing market accessibility. Pay-as-you-go holds a notable share at a meaningful value, offering flexibility, projected at a moderate CAGR to a respectable amount, with a 16.3% cost-saving potential and 29.3% initial adoption.
Key Market Segment
By Deployment Type
- Public Cloud
- Private Cloud
- Hybrid Cloud
By Data Source
- Sensor Data
- Application Performance Data
- Network and Device Metrics
- Financial Data
- Operational Data
- Others
By Database Type
- Relational-based TSDB
- NoSQL-based TSDB
By Industry
- BFSI
- Government
- Education
- IT & Telecommunications
- Manufacturing
- Healthcare
- Retail & E-commerce
- Media & Entertainment
- Others
By Pricing Model
- Pay-As-You-Go
- Subscription-Based
Regional Analysis
North America is leading the cloud-native time series database market with USD 2.8 billion, expected to maintain the largest share. Europe, APAC, MEA, and Latin America also contribute, with North America’s dominance driven by technological adoption and demand for scalable solutions.
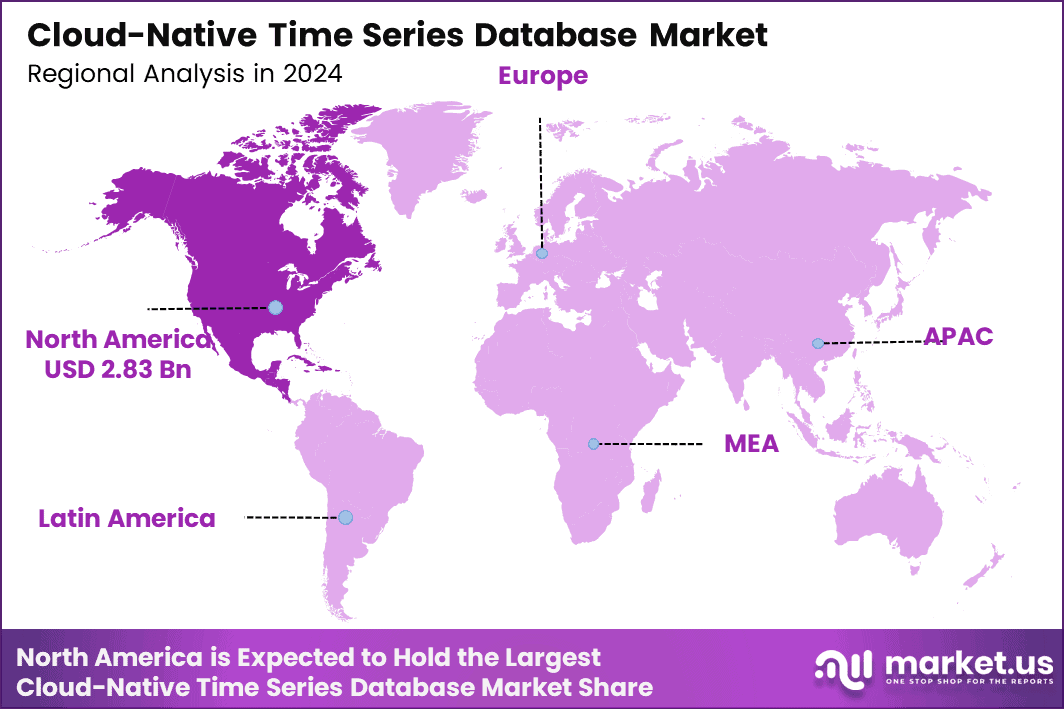
Globally, the cloud-native time series database market is expanding across various regions, fueled by rising data needs and innovation. Each area offers unique growth opportunities, with businesses adapting to local trends. This diversification supports a robust global market, enhancing the adoption of advanced database technologies worldwide.
US Market Size
The U.S. cloud-native time series database market is set to grow significantly, starting at USD 2.4 billion in 2024 and projected to reach USD 12.7 billion by 2034, with an 18.0% CAGR. This steady rise reflects strong demand and technological adoption, offering lucrative opportunities for investors and businesses in the region.
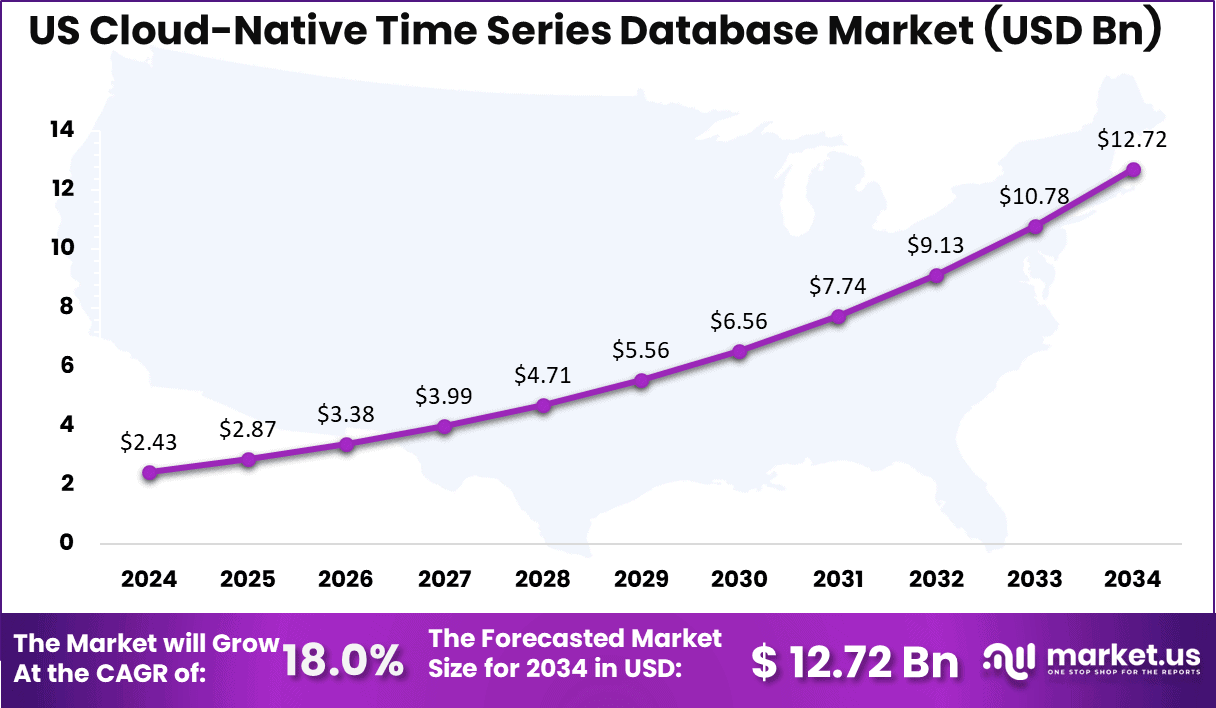
Globally, the cloud-native time series databases Market is expanding, driven by increasing data needs and innovation. Businesses can benefit from scalable solutions and emerging trends, positioning themselves for long-term success. The growth highlights a shift towards advanced data management across various industries worldwide.
Key Regions and Countries
- North America
- US
- Canada
- Europe
- Germany
- France
- The UK
- Spain
- Italy
- Rest of Europe
- Asia Pacific
- China
- Japan
- South Korea
- India
- Australia
- Rest of APAC
- Latin America
- Brazil
- Mexico
- Rest of Latin America
- Middle East & Africa
- GCC
- South Africa
- Rest of MEA
Market Dynamics
Drivers
| Driver | (~) % Impact on CAGR Forecast | Geographic Relevance | Impact Timeline |
|---|---|---|---|
| Connected Device Telemetry | +2.1% | Global | Short term (2 years or less) |
| Observability Stack Adoption | +1.7% | North America, Europe, Asia-Pacific | Short term (2 years or less) |
| Real-Time Fraud Analytics | +1.4% | North America, Europe, developed Asia-Pacific | Medium term (2 to 4 years) |
| Cloud-Native Application Growth | +1.3% | Global | Short term (2 years or less) |
| Industrial Monitoring Demand | +1.1% | North America, Europe, China, India | Medium term (2 to 4 years) |
| Network Performance Management | +0.9% | Global telecom markets | Medium term (2 to 4 years) |
Connected Device Telemetry
Connected-device telemetry is the main active demand engine because every sensor, application event, and network record creates data that must be written, retained, and queried over time. The International Telecommunication Union estimated that 5.5 billion people were online in 2024, an increase of 227 million from the prior year, expanding the user base for digital services that create event logs.
GSMA Intelligence projects global IoT connections to reach 38.7 billion by 2030, with enterprise use representing 63% of connections. The U.S. Department of Energy identifies more than 9,200 generating units and over 1 million megawatts of U.S. grid capacity, each increasingly supported by monitored equipment and operational data.
Restraints
| Restraint | (~) % Impact on CAGR Forecast | Geographic Relevance | Impact Timeline |
|---|---|---|---|
| Regulated Data Residency | -1.8% | Europe, Middle East, Asia-Pacific | Short term (2 years or less) |
| Lengthy Procurement Reviews | -1.4% | Public sector and regulated industries | Medium term (2 to 4 years) |
| Legacy License Commitments | -1.2% | Global enterprise accounts | Medium term (2 to 4 years) |
| Migration Validation Costs | -1.0% | Global data-intensive industries | Short term (2 years or less) |
| Mission-Critical Downtime Risk | -0.9% | Global regulated industries | Short term (2 years or less) |
| Fragmented National Rules | -0.7% | Europe and emerging markets | Medium term (2 to 4 years) |
Regulated Data Residency
Data-residency requirements can halt database purchases when buyers cannot demonstrate where time-stamped customer, payment, industrial, or health data will be stored, copied, and recovered. The European Commission made the Data Act, requiring cloud-service changes that affect portability, switching, and data access terms.
The European Insurance and Occupational Pensions Authority confirms that the Digital Operational Resilience Act brings formal third-party ICT oversight to financial entities. The European Commission also opened infringement procedures against 23 Member States after the 17 October 2024 deadline for NIS2 transposition.
Challenges
| Challenge | (~) % CAGR Friction Drag | Geographic Relevance | Mitigation Horizon |
|---|---|---|---|
| Cloud Data Skills Gap | -1.7% | Global | Long term (4 years or more) |
| High Ingest Cost Control | -1.4% | Global high-volume workloads | Medium term (2 to 4 years) |
| Schema Design Complexity | -1.2% | Global enterprise accounts | Medium term (2 to 4 years) |
| Multi-Cloud Data Movement | -1.1% | North America, Europe, Asia-Pacific | Medium term (2 to 4 years) |
| Query Performance Tuning | -0.9% | Global real-time workloads | Short term (2 years or less) |
| Long-Term Data Retention | -0.8% | Global regulated industries | Long-term (4 years or more) |
Cloud Data Skills Gap
The limited supply of specialists able to combine database engineering, cloud security, distributed systems, and operational analytics slows delivery rather than preventing purchases. ISC2 estimated a global cybersecurity workforce gap of about 4.8 million people in its 2024 workforce study, while the World Economic Forum reported that 63% of employers viewed skills gaps as their main barrier to business transformation in 2025.
ENISA analysed 4,875 incidents in its threat monitoring, with availability attacks, ransomware, and data threats among its leading categories. Database vendors and buyers must therefore spend more on specialist hiring, managed support, automated retention policies, access controls, and performance monitoring.
Opportunities
| Opportunity | (~) % Potential CAGR Upside | Geographic Relevance | Execution Window |
|---|---|---|---|
| Utility Digital Twin Platforms | +2.0% | North America, Europe, Asia-Pacific | Medium term (2 to 4 years) |
| Automotive Fleet Analytics | +1.7% | North America, Europe, China, Japan | Medium term (2 to 4 years) |
| Usage-Based Insurance Platforms | +1.4% | North America, Europe, Asia-Pacific | Medium term (2 to 4 years) |
| Carbon Monitoring Services | +1.2% | Europe, North America, developed Asia-Pacific | Long term (4 years or more) |
| Edge Database Subscriptions | +1.1% | Industrial and remote locations | Medium term (2 to 4 years) |
| Vertical Data Management Bundles | +0.9% | Global regulated sectors | Short term (2 years or less) |
Utility Digital Twin Platforms
Utility digital twins are a future white-space opportunity because many grid operators have installed connected assets but have not yet converted their data into integrated, real-time operational models. The U.S. Energy Information Administration reports approximately 119 million advanced-metering installations, equal to about 72% of U.S. electricity meters, creating a large but incompletely monetized source of interval data.
The UK Department for Energy Security and Net Zero recorded 36.2 million smart meters in operation at the end of the second quarter of 2024. The U.S. Department of Energy committed up to 3 billion for Smart Grid Grants across fiscal years 2022 to 2026.
Suppliers that package ingestion, long-term retention, anomaly detection, and digital-twin functions can move from database capacity sales to higher-margin operational subscriptions; a standardized utility bundle could reasonably improve delivery margin by 5% to 8% and reduce implementation effort per deployment by 10% to 15%.
Key Player Analysis
AWS is the clear Tier-1 leader due to its broad cloud reach and ability to bundle time-series workloads with other cloud services. AWS generated USD 128.7 billion in 2025, up 20% from USD 107.6 billion a year earlier. Its estimated competitive influence is around 25–35%, although AWS does not disclose standalone time-series database revenue.
Kyndryl acts mainly as a Tier-1 services and migration partner rather than a direct database vendor. It reported USD 15.1 billion in fiscal 2025 revenue, USD 18.2 billion in signings, and USD 2.5 billion in adjusted EBITDA. Its strength lies in migrating and managing enterprise environments that use cloud-native databases.
Tier-2 challengers include Nutanix, QuestDB, Greptime, and Quix Analytics. Nutanix generated USD 2.54 billion in fiscal 2025 revenue, up 18%, while spending USD 736.8 million on R&D. QuestDB has raised more than USD 15 million in venture funding, while Greptime and Quix Analytics remain specialist providers with likely low-single-digit competitive shares.
Intel, Adobe, CtrlS Datacenters, and Spyrosoft are adjacent participants. Intel reported USD 52.9 billion in 2025 revenue and USD 13.8 billion in R&D spending, while Adobe recorded USD 23.8 billion in fiscal 2025 revenue and USD 4.29 billion in R&D. Spyrosoft generated PLN 465.4 million in 2024 revenue, up 11.9%, mainly supporting implementation and engineering services.
Top Key Player
- Amazon Web Services, Inc.
- QuestDB
- Kyndryl Inc.
- Intel Corporation
- Quix Analytics
- CtrlS Datacenters Ltd.
- Adobe
- Nutanix
- Spyrosoft
- Greptime Inc.
- Other
Recent Development
- In September 2025, TigerData dropped deployment templates for Timestream via CloudFormation, easing infra-as-code for time-series setups. Early tests show 25% quicker rollouts, a boon for enterprises chasing that seamless Postgres flow.
- In March 2024, AWS kicked off Amazon Timestream for InfluxDB v2.7, bringing open-source APIs to the masses for real-time insights. This one’s a quiet powerhouse, cutting setup time in half for devs building monitoring stacks, and it’s already pulling in over 30% more users from legacy setups.
Report Scope
| Report Features | Description |
|---|---|
| Market Value (2024) | USD 7.7 Bn |
| Forecast Revenue (2034) | US 48.7 Bn |
| CAGR(2025-2034) | 20.2% |
| Base Year for Estimation | 2024 |
| Historic Period | 2020-2023 |
| Forecast Period | 2025-2034 |
| Report Coverage | Revenue forecast, AI impact on Market trends, Share Insights, Company ranking, competitive landscape, Recent Developments, Market Dynamics, and Emerging Trends |
| Segments Covered | By Deployment Type (Public Cloud, Private Cloud, Hybrid Cloud), By Data Source (Sensor Data, Application Performance Data, Network and Device Metrics, Financial Data, Operational Data, Others), By Database Type (Relational-based TSDB, NoSQL-based TSDB), By Industry (BFSI, Government, Education, IT & Telecommunications, Manufacturing, Healthcare, Retail & E-commerce, Media & Entertainment, Others), By Pricing Model (Pay-As-You-Go, Subscription-Based) |
| Regional Analysis | North America – US, Canada; Europe – Germany, France, The UK, Spain, Italy, Russia, Netherlands, Rest of Europe; Asia Pacific – China, Japan, South Korea, India, New Zealand, Singapore, Thailand, Vietnam, Rest of Latin America; Latin America – Brazil, Mexico, Rest of Latin America; Middle East & Africa – South Africa, Saudi Arabia, UAE, Rest of MEA |
| Competitive Landscape | Amazon Web Services, Inc., QuestDB, Kyndryl Inc., Intel Corporation, Quix Analytics, CtrlS Datacenters Ltd., Adobe, Nutanix, Spyrosoft, Greptime Inc., Other |
| Customization Scope | Customization for segments, region/country-level will be provided. Moreover, additional customization can be done based on the requirements. |
| Purchase Options | We have three licenses to choose from: Single User License, Multi-User License (Up to 5 Users), Corporate Use License (Unlimited Users, Printable PDF) |





























