
Quick Navigation
Report Overview
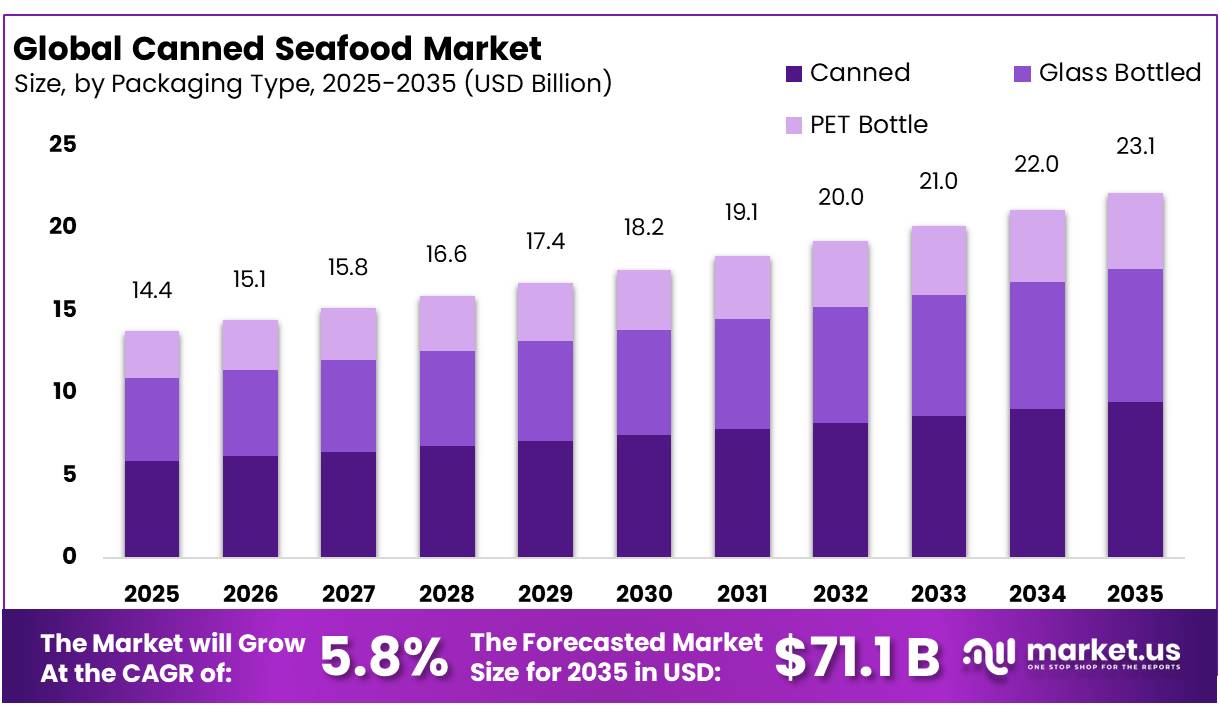
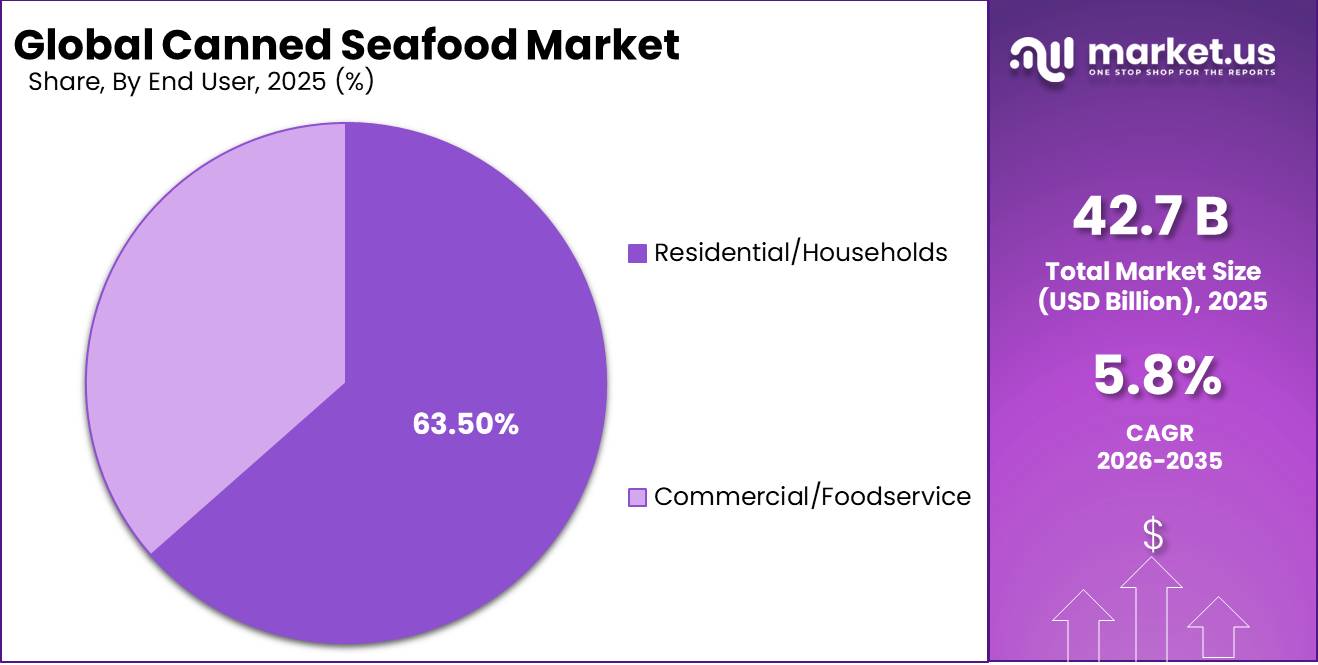
In 2025, the Global Canned Seafood Market was valued at USD 42.7 billion, and between 2026 and 2035, this market is estimated to register a CAGR of 5.8%, reaching about USD 71.1 billion by 2035. Asia Pacific held a dominant market position, capturing more than a 46.40% share, holding USD 19.82 billion in revenue.
Canned seafood covers fish and shellfish that are cleaned, cooked, sealed, and heat-processed in metal containers to provide safe, convenient protein with a long ambient shelf life. The category includes tuna, sardines, salmon, mackerel, anchovies, crab, clams, and mixed seafood preparations. Its industrial structure connects fishing fleets, aquaculture farms, cold-chain operators, can manufacturers, processors, retailers, and food-service distributors.The supply base remains substantial.
- Food and Agriculture Organization of the United Nations (FAO) reported in June 2024 that global fisheries and aquaculture production reached 223.2 million tonnes in 2022, including 185.4 million tonnes of aquatic animals. Aquaculture supplied 94.4 million tonnes of aquatic animals and exceeded capture fisheries for the first time, giving processors a broader and more predictable raw-material base.
- In December 2025, the European Commission reported that EU fishery and aquaculture imports totalled 5.9 million tonnes worth EUR 29.9 billion in 2024.
Key Takeaways
- The global canned seafood market was valued at USD 42.7 billion in 2025.
- The global canned seafood market is projected to grow at a CAGR of 5.8 % and is estimated to reach USD 71.1 billion by 2035.
- On the basis of product type, canned fish dominated the market, constituting 75.30% of the total market share.
- Based on product form, chunks and pieces dominated the canned seafood market, with a substantial market share of around 58.50%.
- Based on packaging type, steel cans led the market, comprising 72.50% of the total market.
- Among end users, residential/households held a major share in the canned seafood market, accounting for 63.50% of the market share.
- Among distribution channels, offline channels are the most considerable within the market, accounting for around 64.90% of the revenue.
- In 2025, Asia Pacific was the most dominant region in the canned seafood market, accounting for 46.40% of the total global consumption.
Demand is supported by convenience, portion control, protein intake, affordability, and reduced dependence on refrigeration. Tuna remains especially important. In December 2025, the European Commission reported that EU consumer spending on fishery and aquaculture products increased by 4% in 2024 to EUR 62.8 billion. During the same year, household consumption of fresh fish declined by 5%, highlighting changing purchasing patterns and creating opportunities for convenient, shelf-stable products such as canned tuna, sardines, salmon, and mackerel. In the United States, NOAA reported in March 2026 that seafood consumption reached 19.1 pounds per person in 2023, with imports supplying an estimated 80%.
Future growth opportunities lie in responsibly sourced tuna, premium sardines, ready-to-eat meals, low-sodium recipes, easy-open packaging, and smaller portions. Stronger traceability, catch documentation, and sustainability claims can improve retailer confidence and export access. Packaging redesign also creates opportunity: the EU Packaging and Packaging Waste Regulation entered into force in February 2025 and targets recyclable packaging by 2030, encouraging processors to improve can materials, labels, coatings, and secondary packaging without reducing food safety or shelf stability. This supports differentiated products across supermarkets, online retail, and catering.
Canned Seafood Market Segmentation
Product Type Analysis
Canned Fish leads with 75.30% because of broad availability, familiar taste, and convenient everyday use.
In 2025, Canned Fish (Tuna, Salmon, Sardines, Others) held a dominant market position, capturing more than a 75.30% share. In December 2025, the segment remained strong because consumers widely preferred shelf-stable seafood that was easy to store, prepare, and serve. Tuna, salmon, and sardines supported demand across households, retail stores, food service outlets, and emergency food supplies.
Canned Crustaceans, including crab, shrimp, prawns, and lobster, emerged as the growing segment in 2026. Demand increased as consumers showed greater interest in premium seafood, convenient meal preparation, and restaurant-style products for use at home across specialty retail and online grocery channels worldwide.
Product Form Analysis
Chunks and Pieces lead with 58.50% because they offer convenience, flexible portions, and easy meal preparation.
In 2025, Chunks and Pieces held a dominant market position, capturing more than a 58.50% share. In December 2025, the segment remained preferred because the format was easy to pack, store, portion, and mix into meals. Consumers commonly used canned seafood chunks and pieces in sandwiches, salads, pasta, rice dishes, spreads, and ready meals.
Whole / Fillet emerged as the growing segment in 2026. Demand increased as consumers looked for premium presentation, recognizable seafood cuts, and products suited to direct serving. The format gained attention across specialty retail, gourmet meals, home dining, and online grocery channels because it offered a more natural appearance and product appeal.
Packaging Type Analysis
Steel Cans lead with 72.50% because they provide durability, long shelf life, and dependable product protection.
In 2025, Steel Cans held a dominant market position, capturing more than a 72.50% share. In December 2025, the segment remained widely used because steel cans protect seafood from light, air, moisture, and physical damage. Their strong structure supports safe heat processing, long storage periods, and reliable transportation across retail and food-service networks. Consumers also recognize the format as practical, stackable, and easy to store.
Retort Pouches & Jars emerged as the growing segment in 2026. Demand increased as consumers preferred lighter packs, easy opening, convenient portions, and attractive shelf presentation. These modern formats also supported ready-to-eat meals, premium seafood products, online grocery sales, and portable consumption across households and global food-service channels.
End User Analysis
Residential/Households lead with 63.50% because canned seafood offers convenient storage, quick preparation, and dependable everyday nutrition.
In 2025, Residential/Households held a dominant market position, capturing more than a 63.50% share. In December 2025, households remained the main users because canned seafood was easy to store, affordable to serve, and suitable for fast meals. Consumers used tuna, sardines, salmon, and other canned products in sandwiches, salads, pasta, rice dishes, and snacks. Long shelf life reduced frequent shopping needs and helped families keep seafood available without refrigeration before opening.
Commercial/Foodservice emerged as the growing segment in 2026. Restaurants, cafés, hotels, caterers, and institutional kitchens increasingly used canned seafood for salads, sandwiches, sauces, pizzas, and prepared meals. Consistent quality, lower preparation time, easier inventory control, and reduced handling supported its wider adoption across professional kitchens in many global markets.
Distribution Channel Analysis
Offline leads with 64.90% because shoppers value immediate access, product choice, and familiar retail buying.
In 2025, Offline held a dominant market position, capturing more than a 64.90% share. In December 2025, supermarkets, hypermarkets, convenience stores, specialty seafood shops, and independent groceries remained the main purchasing points for canned seafood. These outlets allowed consumers to compare brands, pack sizes, ingredients, and prices before buying. Strong shelf visibility, frequent promotions, dependable stock availability, and immediate product access supported purchases.
Online emerged as the growing segment in 2026. Consumers increasingly purchased canned tuna, sardines, salmon, and shellfish through grocery platforms and retailer websites. Home delivery, subscription ordering, wider product choice, simple price comparison, and access to premium or imported items supported steady online adoption.
Key Market Segments
By Product Type
- Canned Fish
- Tuna
- Salmon
- Sardines
- Others
- Canned Crustaceans
- Crab
- Shrimp & Prawns
- Lobster
- Others
- Canned Mollusks
- Canned Cephalopods
By Product Form
- Chunks and Pieces
- Whole / Fillet
By Packaging Type
- Steel Cans
- Retort Pouches & Jars
- Others
By End User
- Residential/Households
- Commercial/Foodservice
By Distribution Channel
- Offline
- Hypermarkets & Supermarkets
- Convenience Stores
- Specialty Food Stores
- Others
- Online
- E-Commerce Platforms (Amazon, Walmart, etc.)
- Brand / D2C Websites
Driver Analysis
Protein affordability and pantry-value demand
Canned seafood is gaining from value-seeking food behavior because it sits at the intersection of low preparation time, long shelf life, and relatively dense nutrition. U.S. dietary guidance still anchors seafood at about 8 ounces per week for adults, while a 3-ounce seafood serving can provide up to 40% of daily protein needs, supporting canned fish as a practical substitute when households trade down from fresh protein during inflationary periods.
In Europe, 2024 consumer spending on fishery and aquaculture products rose 4% to €62.8 billion even as volumes declined, indicating that consumers remained in the category despite price pressure; that pattern tends to favor shelf-stable formats with lower waste and better budget visibility, especially tuna, sardines, and mackerel. Strategically, this driver supports velocity in mass retail, club, and e-grocery, improves inventory turns for mainstream SKUs, and favors manufacturers that can maintain opening-price-point packs while protecting gross margin through mix engineering, pack-size calibration, and promotional efficiency.
Drivers Impact Analysis
| Driver | (~) % Impact on CAGR Forecast | Geographic Relevance | Impact Timeline |
|---|---|---|---|
| Affordable shelf-stable protein demand | +2.3% | North America, Europe, LATAM, urban APAC, MEA | Short term (≤ 2 years) |
| Omega-3 and health-positioning pull | +1.8% | North America core, EU, Japan, South Korea, Australia | Medium term (2-4 years) |
| Sustainability and traceability premiumization | +1.5% | U.K., Germany, Nordics, U.S. retail chains | Medium term (2-4 years) |
| Emerging-market halal and export expansion | +1.6% | Middle East, Africa, Southeast Asia, Thailand export corridors | Medium term (2-4 years) |
| Value-added flavor and meal formats | +1.4% | North America, Western Europe, Japan, South Korea | Short term (≤ 2 years) |
| E-commerce and pantry-restocking momentum | +1.2% | U.S., U.K., EU-5, China, India metros | Short term (≤ 2 years) |
Restraint Analysis
Traceability compliance burden
Compliance costs are rising faster than volume growth in many import markets, making traceability not just a market-entry requirement but a structural drag on smaller suppliers and a margin diluent for larger ones. The U.S. Seafood Import Monitoring Program applies to 13 vulnerable species groups representing about 45% of U.S. seafood imports, requiring harvest-event and chain-of-custody documentation, while the EU continues to tighten fisheries control and digital traceability expectations for tuna value chains; these systems improve legitimacy and sourcing visibility, but they also add audit, ERP, documentation, and rejection-risk costs across fragmented global supply networks.
In economic terms, compliance spending is increasingly front-loaded: processors must invest in data capture, supplier qualification, lot segregation, and certificate management before realizing any pricing upside, and smaller packers with weak digital infrastructure can lose retailer access entirely or accept lower-margin subcontracting roles, which suppresses category expansion by concentrating market power in fewer compliant suppliers.
Restraint Impact Analysis
| Restraint | (~) % Impact on CAGR Forecast | Geographic Relevance | Impact Timeline |
|---|---|---|---|
| Tuna catch volatility | -1.3% | Thailand hub, EU packers, U.S. importers, Japan | Short term |
| Tariffs and trade barriers | -1.0% | U.S. core, Thailand, Ecuador, Vietnam, APAC export corridors | Short term |
| Metal can cost inflation | -0.8% | North America core, EU, Asian processors | Medium term |
| Traceability compliance burden | -0.7% | EU core, U.S. import channels, UK, Canada | Medium term |
| Fresh/perceived-quality substitution | -0.6% | Western Europe, North America, affluent APAC | Medium term |
| Packaging chemical regulation risk | -0.4% | U.S., EU, premium retail channels | Long term |
Opportunity Analysis
Halal and MENA corridor build-out
This is not a baseline driver because most global suppliers still treat the Middle East and wider halal ecosystem as overflow export markets rather than as purpose-built growth platforms with tailored certification, pack economics, and route-to-market design. Krungsri Research explicitly highlights the halal market, especially the Middle East and parts of North Africa, as a strategic expansion path for Thai canned tuna exporters, and Thailand’s own 2025 export mix shows Middle East and African destinations accounted for 37.0% of total canned tuna export volume in the first five months of the year, demonstrating substantial channel depth already exists.
The upside comes from moving beyond transactional exports into halal-certified product development, Arabic labeling, tailored oil and spice profiles, and regional distributor consolidation; that can expand addressable demand by unlocking higher-income Gulf consumers, institutional foodservice, pilgrimage-related channels, and Muslim diaspora retail in Europe, with potential EBIT improvement of 150 to 300 basis points if suppliers capture premium halal trust rather than competing purely on price. This white space is especially attractive because it diversifies away from tariff-sensitive U.S. exposure while leveraging Thailand’s scale advantages and established food-safety reputation.
Opportunity Impact Analysis
| Opportunity | (~) % Potential CAGR Upside | Geographic Relevance | Execution Window |
|---|---|---|---|
| Snack-format premiumization | +1.4% | North America core, UK, Japan, South Korea, urban APAC | Short term |
| Halal and MENA corridor build-out | +1.2% | GCC, North Africa, Thailand export base, EU halal pockets | Medium term |
| Certified private-label roll-up | +1.0% | UK, Canada, EU core, U.S. premium retail | Short term |
| Pouch and bowl meal platforms | +0.9% | North America, Western Europe, Australia, affluent APAC | Medium term |
| Species mix expansion beyond tuna | +0.8% | EU, Japan, South Korea, North America | Medium term |
| Automation-led co-manufacturing M&A | +0.7% | Thailand, Ecuador, Vietnam, Iberia, North Africa | Long term |
Challenges Analysis
Packaging conversion and liner transition
Packaging is now a strategic challenge because canned seafood producers must simultaneously manage metal-cost volatility, easy-open convenience demands, and the transition away from BPA-linked food-contact materials without interrupting throughput or shelf-life performance. In the EU, BPA and related hazardous bisphenols in food-contact materials were banned from January 20, 2025, with important fishery-product transition windows extending to July 20, 2026 and, for certain single-use food contact articles preserving fishery products, to January 20, 2028; compliance also requires testing such as LC-MS/MS at 1 µg/kg detection limit and formal declarations of conformity.
In the U.S., packaging trade sources reported that strengthened tariffs on steel, aluminum, and copper in 2026 are increasing costs for domestic can manufacturers, compounding the burden of material conversion with input-price inflation. For seafood canners, liner reformulation and can qualification can take 6–12 months per SKU-family once migration testing, retort validation, corrosion behavior, taste neutrality, and line-speed compatibility are considered, and even a 1%–2% increase in can cost has a meaningful effect when packaging can represent 15%–25% of finished-goods cost in value segments.
Challenges Impact Analysis
| Challenge | (~) % CAGR Friction | Geographic Relevance | Mitigation Horizon |
|---|---|---|---|
| Raw fish sourcing volatility | -1.5% | APAC fishing hubs, EU import markets, Latin America | Medium term (2-4 years) |
| Traceability and IUU compliance | -1.3% | EU regulatory hubs, UK, North America import channels | Medium term (2-4 years) |
| Processing labor and retention gaps | -1.1% | Europe, North America, Southeast Asia plants | Medium term (2-4 years) |
| Packaging conversion and liner transition | -1.0% | EU, North America, Japan, premium export markets | Short term (≤ 2 years) |
| Demand planning and species mix shifts | -0.9% | Global retail channels, EU, US, East Asia | Medium term (2-4 years) |
| Ethical sourcing and audit exposure | -0.8% | Southeast Asia, West Africa, EU/US buyer networks | Long term (≥ 4 years) |
Geopolitical Impact Analysis
Trade Tensions and Supply Chain Disruptions Are Reshaping the Global Canned Seafood Market.
The global canned seafood market is far more connected to geopolitics than many consumers realize. Behind a simple can of tuna or salmon is a highly interconnected global supply chain that depends on stable trade relationships, international fishing agreements, and reliable access to raw materials. When political tensions or global conflicts arise, the effects can quickly ripple across the industry.
The war in Ukraine highlighted just how vulnerable these supply chains can be. Sunflower oil commonly used in many canned seafood products suddenly became difficult to source after disruptions in Ukrainian exports, forcing manufacturers across Europe and Asia to rapidly switch to alternative oils. This not only created operational challenges but also pushed production costs significantly higher.
At the same time, sanctions on Russia disrupted global seafood trade flows. Since Russia is one of the world’s major exporters of crab and salmon, restrictions on Russian seafood created supply shortages in several markets. Buyers and manufacturers were forced to quickly identify new sourcing partners, leading many to increase imports from countries such as Norway, Chile, and Canada to stabilize supply.
These disruptions showed how closely everyday food products are tied to global political events. In fact, several European canned seafood companies publicly confirmed that they had to reformulate products, adjust recipes, and renegotiate supplier agreements in response to the changing geopolitical environment. The situation served as a clear reminder that even basic pantry staples can be heavily influenced by international trade dynamics and global uncertainty.
Regional Analysis
The Asia Pacific region dominates the global canned seafood market, accounting for 46.40% of total consumption worldwide. This leadership position is driven by a unique combination of strong seafood traditions, expanding middle-class populations, and some of the world’s largest seafood production and processing industries concentrated within the region. In countries such as China, Japan, Thailand, Indonesia, and Philippines, seafood has long been an essential part of everyday diets and cultural food habits.
Canned seafood has evolved far beyond its traditional image as a basic pantry backup in the region. Today, a growing number of consumers view it as a practical, affordable, and genuinely nutritious everyday food choice. Increasing awareness around protein intake, omega-3 benefits, and balanced diets has further strengthened demand, particularly among younger and health-conscious consumers. China continues to play a central role in the market as both the largest producer and one of the fastest-growing consumers of canned seafood in the region.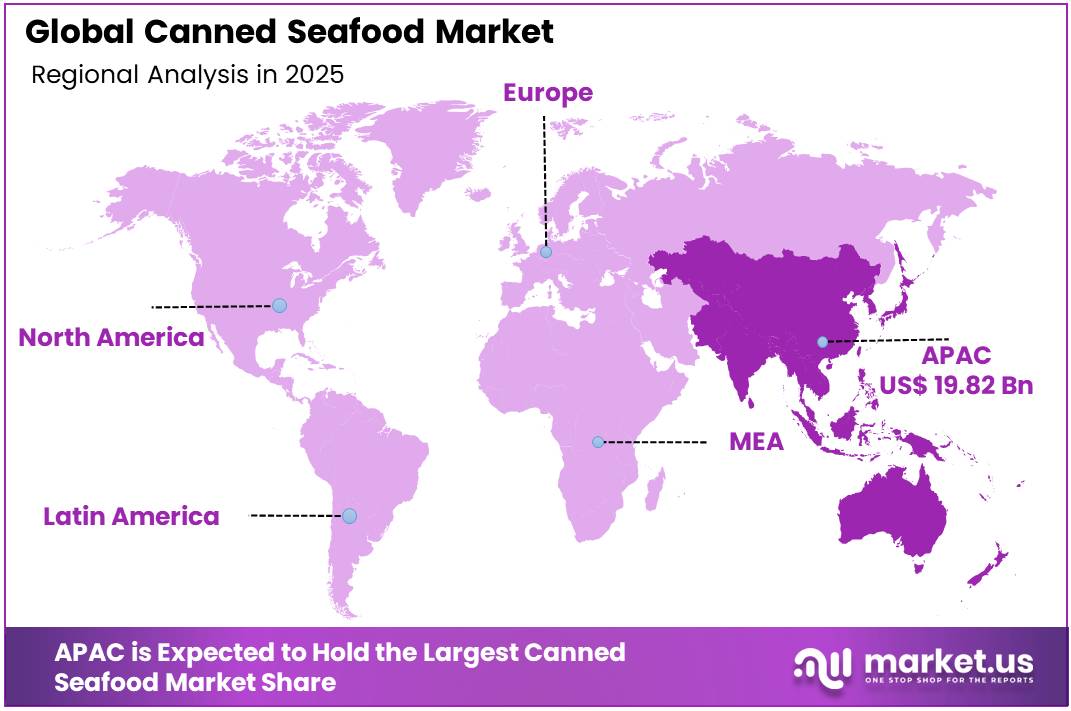
Key Regions and Countries Covered
- North America
- The US
- Canada
- Europe
- Germany
- France
- The UK
- Spain
- Italy
- Russia & CIS
- Rest of Europe
- APAC
- China
- Japan
- South Korea
- India
- ASEAN
- Rest of APAC
- Latin America
- Brazil
- Mexico
- Rest of Latin America
- Middle East & Africa
- GCC
- South Africa
- Rest of MEA
Key Players Analysis
The global canned seafood market is shaped by a handful of powerful players who have built their dominance over decades through strong brand equity, expansive distribution networks, and continuous product innovation. These are companies that have earned their place on grocery shelves around the world not simply through scale, but through a genuine understanding of what consumers need and expect from their food.
The canned seafood market today sits at a fascinating crossroads of heritage and disruption. Established giants like Thai Union, StarKist, and Bumble Bee have spent decades perfecting the art of mass-market canned seafood, but they are now finding themselves sharing the aisle with a new generation of nimble, purpose-driven brands that are rewriting the rules around quality, sustainability, and consumer trust. Shoppers today are more informed, more values-driven, and more adventurous in their food choices than ever before, and the competitive landscape is shifting in real time to reflect that.
Market Key Players
- Thai Union Group PCL
- Bolton Group S.p.A.
- Dongwon Industries Co. (StarKist)
- Bumble Bee Foods LLC
- Maruha Nichiro Corporation
- Nippon Suisan Kaisha Ltd. (Nissui)
- Century Pacific Food Inc.
- Trident Seafoods Corp.
- Calvo Group
- Mowi ASA
- Wild Planet Foods Inc.
- Princes Group (Mitsubishi)
- Conservas Ortiz
- Austevoll Seafood ASA
Key Development
- In September 2023, Bumble Bee Foods announced a partnership with the World Wildlife Fund (WWF) to accelerate its sustainable seafood sourcing commitments, with a specific focus on improving traceability and reducing the environmental footprint of its tuna supply chain across the Pacific Ocean.
- In November 2024, StarKist launched a new range of flavored and protein-enriched canned tuna and salmon products across major retail chains in the United States, targeting health-conscious millennials and Gen Z consumers looking for convenient, high-protein, and ready-to-eat seafood options that fit seamlessly into their busy on-the-go lifestyles.
Report Scope
| Report Features | Description |
|---|---|
| Market Value (2025) | US$42.7 Bn |
| Forecast Revenue (2035) | US$71.1 Bn |
| CAGR (2026-2035) | 5.8 % |
| Base Year for Estimation | 2025 |
| Historic Period | 2020-2024 |
| Forecast Period | 2026-2035 |
| Report Coverage | Revenue Forecast, Market Dynamics, Competitive Landscape, Recent Developments |
| Segments Covered | By Product Type (Canned Fish [Tuna, Salmon, Sardines, and Others], Canned Crustaceans [Crab, Shrimp & Prawns, Lobster, and Others], Canned Mollusks, and Canned Cephalopods), By Product Form (Chunks and Pieces and Whole/Fillet), By Packaging Type (Steel Cans, Retort Pouches & Jars, and Others), By End User (Residential/Households and Commercial/Foodservice), By Distribution Channel (Offline and Online) |
| Regional Analysis | North America – The US & Canada; Europe – Germany, France, The UK, Spain, Italy, Russia & CIS, Rest of Europe; APAC– China, Japan, South Korea, India, ASEAN & Rest of APAC; Latin America– Brazil, Mexico & Rest of Latin America; Middle East & Africa– GCC, South Africa, & Rest of MEA |
| Competitive Landscape | Thai Union Group PCL, Bolton Group S.p.A., Dongwon Industries Co. (StarKist), Bumble Bee Foods LLC, Maruha Nichiro Corporation, and Nippon Suisan Kaisha Ltd. (Nissui). Century Pacific Food Inc., Trident Seafoods Corp., Calvo Group, Mowi ASA, and Wild Planet Foods Inc., Princes Group (Mitsubishi), Conservas Ortiz, and Austevoll Seafood ASA |
| Customization Scope | Customization for segments, region/country-level will be provided. Moreover, additional customization can be done based on the requirements. |
| Purchase Options | We have three licenses to opt for: Single User License, Multi-User License (Up to 5 Users), Corporate Use License (Unlimited Users and Printable PDF) |


