


Report Overview
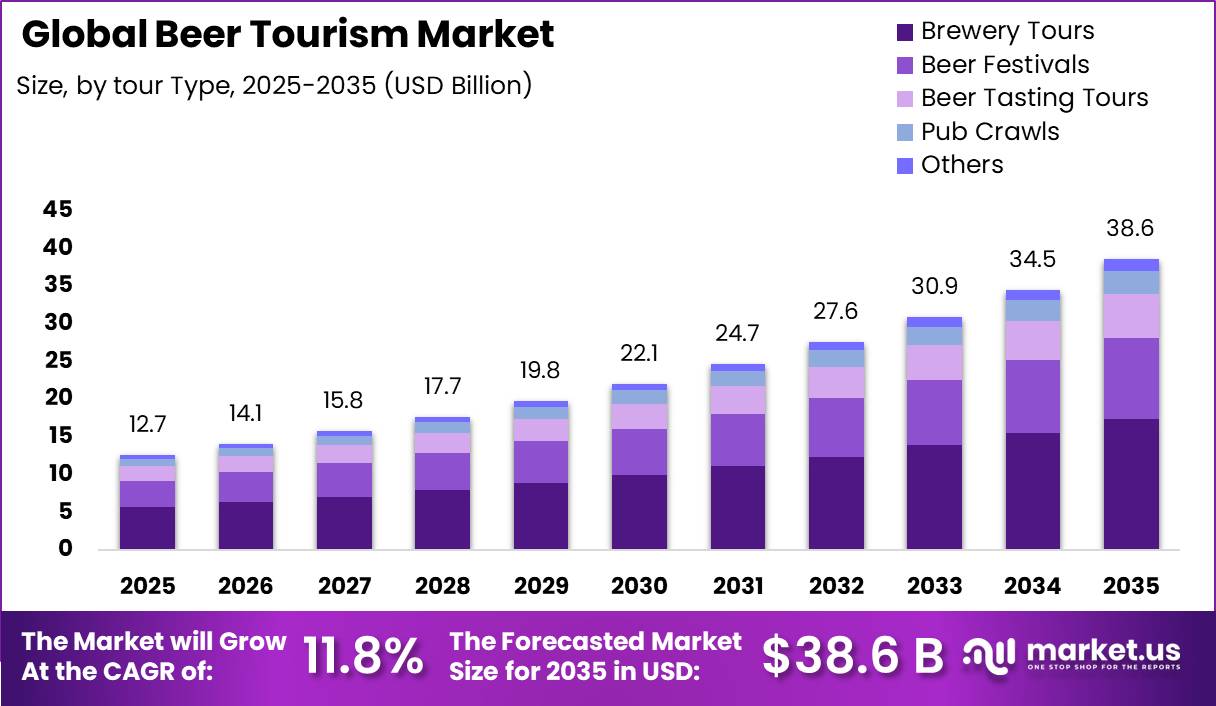
Global Beer Tourism Market size is expected to be worth around USD 38.6 Billion by 2035 from USD 12.7 Billion in 2025, growing at a CAGR of 11.8% during the forecast period 2026 to 2035. Travelers increasingly plan trips around brewery visits, tasting tours, and beer festivals.
This reflects a market built around brewery tours, beer festivals, tasting experiences, and pub crawls. Travel providers package these activities by traveler type, age group, and booking channel. The structure spans group trips, couple getaways, solo adventures, and family outings across multiple regions.
Key Takeaways
- Global Beer Tourism Market size is valued at USD 12.7 Billion in 2025 and is projected to reach USD 38.6 Billion by 2035, growing at a CAGR of 11.8%.
- Brewery Tours dominates the By Tour Type segment with a share of 45.0% in 2025.
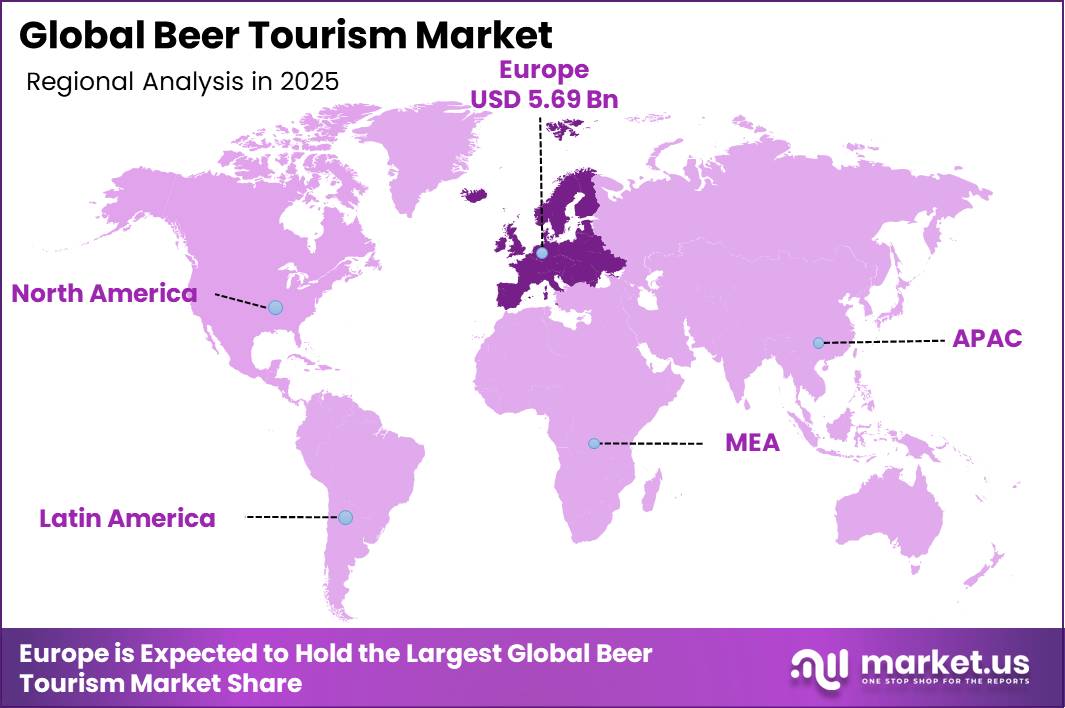
- Europe leads the Beer Tourism Market with a share of 45.0%, valued at USD 5.69 Billion in 2025.
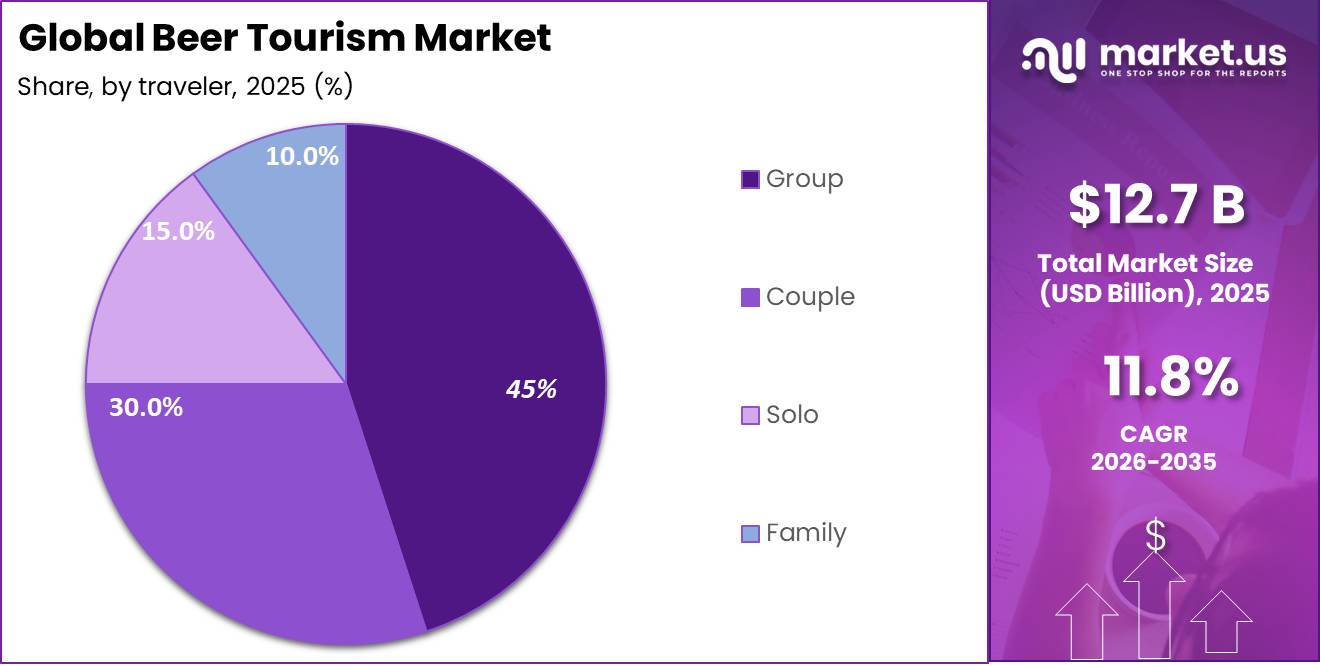
- Group travelers hold the largest share in the By Traveler Type segment at 45.0%.
- The 31-40 Years age group leads the By Age Group segment with a share of 40.0%.
- Online Travel Agencies dominate the By Booking Channel segment with a share of 60.0%.
Public tourism bodies are increasingly funding beer focused travel infrastructure to boost regional economies. In 2025, Clock & Candle Brewatorium secured crowdfunding and private investment funding to complete its brewery tourism destination, including visitor amenities and event programming. This signals growing investor confidence in dedicated beer tourism infrastructure projects.
According to the Brewers Association, the craft brewing industry contributed US$71.8 Billion to the US economy in 2025. This scale gives beer tourism operators a large base of production sites to build trail experiences around. The Brewers Association also found that craft brewing supported more than 415,000 jobs in 2025, expanding regional tourism employment opportunities.
Tourism boards are pairing brewery experiences with heritage and culinary programming to widen visitor appeal. This creates stronger destination positioning for regions building beer centered travel products. Investment in trail infrastructure and event support continues to shape long term market structure.
Tour Type Analysis
Brewery Tours dominates with 45.0% due to strong traveler demand for hands-on brewery experiences.
In 2025, Brewery Tours held a dominant market position in the By Tour Type segment of Beer Tourism Market, with a 45.0% share. Travelers favor guided visits that combine production tours with direct tastings at the source. This preference gives operating breweries a built-in advantage for capturing tourism revenue without festival dependency.
Beer Festivals attract travelers through concentrated, multi-brewery events held over short windows. This format holds a 28.0% share of the Tour Type segment. Festivals let smaller breweries reach visitors who might not otherwise plan individual brewery visits, widening market access for niche producers.
Beer Tasting Tours appeal to travelers seeking curated, structured sampling across multiple styles. This segment holds a 15.0% share, often featuring curated beer glassware and multi-style flights. Structured tastings work well for shorter visits, letting operators serve time constrained travelers.
Pub Crawls suit travelers who prefer flexible, self-guided exploration of local venues without formal booking requirements. This segment holds an 8.0% share. Others, covering niche and mixed format experiences, holds the remaining 4.0% collectively.
According to the British Beer and Pub Association, no and low alcohol beer accounted for almost 3% of the UK beer market in 2025. This trend expands the addressable traveler base beyond alcohol focused visitors. Non-alcohol offerings are becoming a differentiator for brewery tour operators seeking broader appeal.
Traveler Type Analysis
Group dominates with 45.0% due to shared cost splitting and social travel preferences.
In 2025, Group held a dominant market position in the By Traveler Type segment of Beer Tourism Market, with a 45.0% share. Groups often split costs across transportation, tastings, and lodging, lowering per person expense. This affordability drives repeat group bookings for brewery tours and beer festivals.
Couple travelers make up 30.0% of the Traveler Type segment, favoring intimate tasting experiences and boutique breweries. This group often books premium or curated tours over large group packages. Operators targeting couples can charge higher margins through personalized itineraries.
Solo travelers account for 15.0% of this segment, drawn to flexible schedules and self-paced brewery visits. This group relies heavily on digital booking tools and reviews before choosing destinations. Solo demand supports growth in online travel agency bookings within beer tourism.
Family travelers represent 10.0% of the segment, seeking brewery destinations with food, entertainment, and non-alcohol options for children. This group influences venues to expand family friendly programming. Growing family interest signals opportunity for broader destination positioning beyond adult only travel.
Age Group Analysis
31-40 Years dominates with 40.0% due to higher disposable income and travel flexibility.
In 2025, 31-40 Years held a dominant market position in the By Age Group segment of Beer Tourism Market, with a 40.0% share. This age group typically has higher disposable income and established travel habits. Operators can prioritize marketing toward this demographic for stronger conversion rates.
Booking Channel Analysis
Online Travel Agencies dominates with 60.0% due to convenient comparison and booking features.
In 2025, Online Travel Agencies held a dominant market position in the By Booking Channel segment of Beer Tourism Market, with a 60.0% share. Travelers use these platforms to compare brewery tours, festivals, and tasting packages in one place. This convenience strengthens online channels over direct or offline booking methods.
Key Market Segments
By Tour Type
- Brewery Tours
- Beer Festivals
- Beer Tasting Tours
- Pub Crawls
- Others
By Traveler Type
- Group
- Couple
- Solo
- Family
By Age Group
- 31-40 Years
- 21-30 Years
- 41-50 Years
- Above 50 Years
By Booking Channel
- Online Travel Agencies
- Direct Booking
- Offline Travel Agents
Regional Analysis
Europe Dominates the Beer Tourism Market with a Market Share of 45.0%, Valued at USD 5.69 Billion
Europe leads the Beer Tourism Market with a 45.0% share, valued at USD 5.69 Billion in 2025. According to the British Beer and Pub Association, UK consumers were expected to drink 200 million pints of no and low alcohol beer in 2025. This expands tourism appeal beyond traditional full-strength beer travelers.
North America benefits from a large, established beer economy that supports brewery tourism infrastructure. Figures from the Beer Institute show the broader US beer industry supported more than 2.42 million jobs and contributed more than US$471 Billion to the economy. In January 2026, Boulevard Brewing Company expanded its Kansas City visitor attraction, strengthening regional tourism capacity.
Key Regions and Countries
North America
- US
- Canada
Europe
- Germany
- France
- The UK
- Spain
- Italy
- Rest of Europe
Asia Pacific
- China
- Japan
- South Korea
- India
- Australia
- Rest of APAC
Latin America
- Brazil
- Mexico
- Rest of Latin America
Middle East and Africa
- GCC
- South Africa
- Rest of MEA
Drivers
Public tourism bodies increasingly treat food and beverage travel as a core part of destination development. Government backed gastronomy tourism initiatives encourage investment in brewery equipment funding, signage, route planning, and event support. Smaller brewery regions benefit most from resources that would be difficult to fund independently.
This institutional support strengthens partnerships between breweries, restaurants, heritage sites, and tourism operators. Beer tourism businesses gain access to broader marketing campaigns and bundled visitor packages rather than relying only on direct customer acquisition. This creates stronger destination appeal and sustainable long term growth.
| Driver | (~) % Impact on CAGR Forecast | Geographic Relevance | Impact Timeline |
|---|---|---|---|
| Craft brewery density and draw | +2.0% | North America core; UK; Australia; Western Europe | Short term (≤ 2 years) |
| Gastronomy tourism formalization | +1.6% | Europe; Africa; Southeast Asia; Latin spill-over | Medium term (2-4 years) |
| No-alcohol inclusion broadening demand | +1.4% | North America; Western Europe; Japan; GCC | Short term (≤ 2 years) |
| Taproom and brewpub economic pull | +1.5% | U.S.; Canada; UK; Germany | Short term (≤ 2 years) |
| Trail and passport productization | +1.7% | Canada; U.S.; South Africa; Australia | Medium term (2-4 years) |
| Festival ecosystems extending stays | +1.3% | Canada; U.S.; Belgium; Czechia; South Africa | Medium term (2-4 years) |
Restraints
A shrinking base of licensed venues restrains beer tourism because brewery trails and pub circuits depend on dense hospitality networks. British licensed premises fell to 98,746 by June 2025, a decline of 374 venues since the start of the year. The sector has contracted by 14.2% since March 2020.
Fewer venues limit the placement of beer dispensers and reduce route diversity across brewery trails and pub crawls. Secondary towns face the greatest impact, as losing even a few venues can weaken a full day beer tourism experience. This complicates long term tourism investment planning.
| Restraint | (~) % Impact on CAGR Forecast | Geographic Relevance | Impact Timeline |
|---|---|---|---|
| Licensed site shrinkage | -1.5% | UK; Western Europe; North America urban cores | Short term (≤ 2 years) |
| Pub-bar insolvency pressure | -1.1% | UK; Ireland; Australia; U.S. independents | Short term (≤ 2 years) |
| Alcohol access fragmentation | -1.2% | India; U.S. states; Asia inbound corridors | Medium term (2-4 years) |
| New-brewery slowdown | -0.9% | U.S.; Canada; UK; Australia | Medium term (2-4 years) |
| Discretionary travel squeeze | -0.8% | Europe; North America; urban APAC | Short term (≤ 2 years) |
| Dry-day sales blackouts | -0.6% | India; election-linked states; regulated cities | Medium term (2-4 years) |
Challenges
Brewery network fragility challenges beer tourism because trail experiences depend on a stable, diverse local brewery base. In 2025, brewery openings declined to 300, down from 518 in 2024, while 481 breweries closed, straining demand for brewing supplies among remaining operators.
These closures force frequent itinerary revisions and reduce confidence in established beer trails. Smaller destinations face greater risk, since losing a few breweries can weaken their ability to attract dedicated travelers. This raises coordination costs and delays infrastructure investment.
| Challenge | (~) % CAGR Friction Drag | Geographic Relevance | Mitigation Horizon |
|---|---|---|---|
| Hospitality workforce shortfall | -1.1% | Global tourism hubs; North America; EU; Asia | Long term (≥ 4 years) |
| Brewery network fragility | -0.9% | U.S. craft clusters; UK; Australia | Medium term (2-4 years) |
| Drinking-age and service variability | -0.8% | India; EU; U.S. states; Asia inbound tourism | Medium term (2-4 years) |
| Festival capacity and seasonality limits | -0.7% | Canada; U.S.; Europe; South Africa | Medium term (2-4 years) |
| Experience standardization gaps | -0.9% | Multi-brewery regions; city clusters; rural trails | Long term (≥ 4 years) |
| Infrastructure and coordination complexity | -0.8% | Emerging beer destinations; secondary cities | Long term (≥ 4 years) |
Opportunities
Festival to trail conversion offers beer tourism destinations a way to extend visitor spending beyond single day events. Major festivals already draw engaged audiences, with some hosting more than 55 breweries and cideries. Converting festival attendance into broader trail based tourism captures value from visitors already acquired.
Digital tools such as brewery passports and post event marketing can encourage extended stays. If 15% to 20% of attendees add an overnight stay or brewery visit, the economic impact becomes significant. This creates a scalable growth path without requiring new event creation.
| Opportunity | (~) % Potential CAGR Upside | Geographic Relevance | Execution Window |
|---|---|---|---|
| Digital beer passport ecosystems | +2.1% | North America core; UK; Australia; India metros | Short term (≤ 2 years) |
| No-alcohol beer itineraries | +1.7% | Western Europe; North America; GCC; Japan | Short term (≤ 2 years) |
| Brewery-lodging package bundles | +1.8% | U.S. secondary cities; Germany; Belgium; Czechia | Medium term (2-4 years) |
| Festival-to-trail conversion | +1.9% | Canada; U.S.; South Africa; EU regional clusters | Medium term (2-4 years) |
| Rail-linked regional circuits | +1.5% | Western Europe; Japan; UK; India tourism corridors | Long term (≥ 4 years) |
| Destination roll-up platforms | +2.0% | U.S. craft clusters; Canada; Australia; Nordics | Long term (≥ 4 years) |
Key Company Insights
Brewery Tour Company (NZ) (URL UNVERIFIED) positions itself around curated brewery visits catering to Group and Couple travelers, the largest traveler segments. This focus builds loyalty through localized expertise rather than broad scale. As per our research, 60% of breweries reported production declines in 2025, adding route planning risk for dedicated tour operators.
Beau’s All Natural Brewing Company anchors brewery tourism through an established production site and natural brewing positioning. This differentiates the brand for travelers seeking authentic, small batch experiences. The company’s focus on natural ingredients supports premium positioning within the Beer Tasting Tours and Brewery Tours segments.
Key Players
- Brewery Tour Company (NZ)
- Beau’s All Natural Brewing Company
- Heineken N.V.
- Anheuser-Busch InBev
- Carlsberg A/S
- Asahi Group Holdings Ltd.
- Molson Coors Beverage Company
- Sierra Nevada Brewing Co.
- Stone Brewing Co.
- Dogfish Head Craft Brewery Inc.
- BrewDog plc
- The Boston Beer Company Inc.
- New Belgium Brewing Company Inc.
- Bell’s Brewery Inc.
- Duvel Moortgat NV
- Others
Recent Developments
- April 2026 – Evil Genius Beer Company acquired the intellectual property, recipes, and distribution rights of 21st Amendment Brewery, reviving a well known craft beer brand with strong brewery tourism recognition.
- January 2025 – Deschutes Brewery expanded investment in non-alcohol beer production technology, supporting new tasting room offerings and visitor experiences aligned with growing alcohol-free brewery tourism demand.
Report Scope
| Report Features | Description |
|---|---|
| Market Value (2025) | USD 12.7 Billion |
| Forecast Revenue (2035) | USD 38.6 Billion |
| CAGR (2026-2035) | 11.8% |
| Base Year for Estimation | 2025 |
| Historic Period | 2020-2024 |
| Forecast Period | 2026-2035 |
| Report Coverage | Revenue Forecast, Market Dynamics, Market Opportunity Analysis, Technology and Innovation Landscape, Competitive Landscape, Recent Developments |
| Segments Covered | By Tour Type (Brewery Tours, Beer Festivals, Beer Tasting Tours, Pub Crawls, Others), By Traveler Type (Group, Couple, Solo, Family), By Age Group (31-40 Years, 21-30 Years, 41-50 Years, Above 50 Years), By Booking Channel (Online Travel Agencies, Direct Booking, Offline Travel Agents) |
| Regional Analysis | North America (US and Canada), Europe (Germany, France, The UK, Spain, Italy, and Rest of Europe), Asia Pacific (China, Japan, South Korea, India, Australia, and Rest of APAC), Latin America (Brazil, Mexico, and Rest of Latin America), Middle East and Africa (GCC, South Africa, and Rest of MEA) |
| Competitive Landscape | Brewery Tour Company (NZ), Beau’s All Natural Brewing Company, Heineken N.V., Anheuser-Busch InBev, Carlsberg A/S, Asahi Group Holdings Ltd., Molson Coors Beverage Company, Sierra Nevada Brewing Co., Stone Brewing Co., Dogfish Head Craft Brewery Inc., BrewDog plc, The Boston Beer Company Inc., New Belgium Brewing Company Inc., Bell’s Brewery Inc., Duvel Moortgat NV, Others |
| Customization Scope | Customization for segments, region/country-level will be provided. Additional customization can be done based on requirements. |
| Purchase Options | We have three licenses to opt for: Single User License, Multi-User License (Up to 5 Users), Corporate Use License (Unlimited User and Printable PDF) |





































