
Quick Navigation
Report Overview
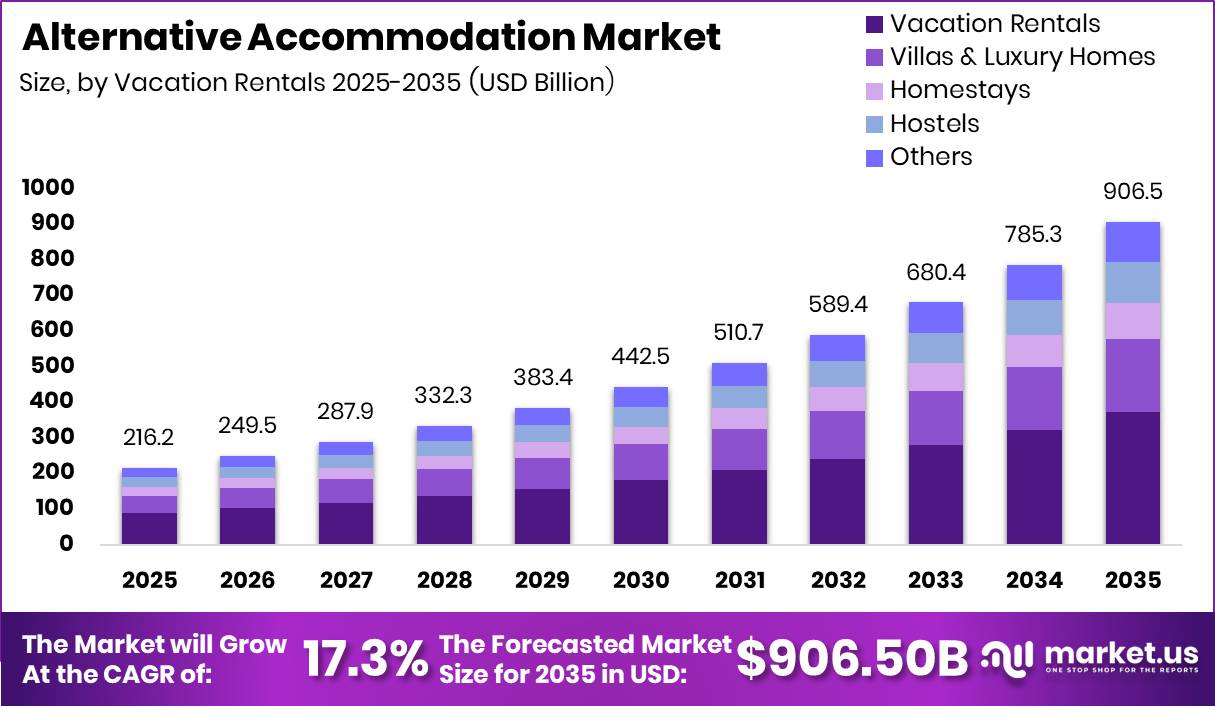
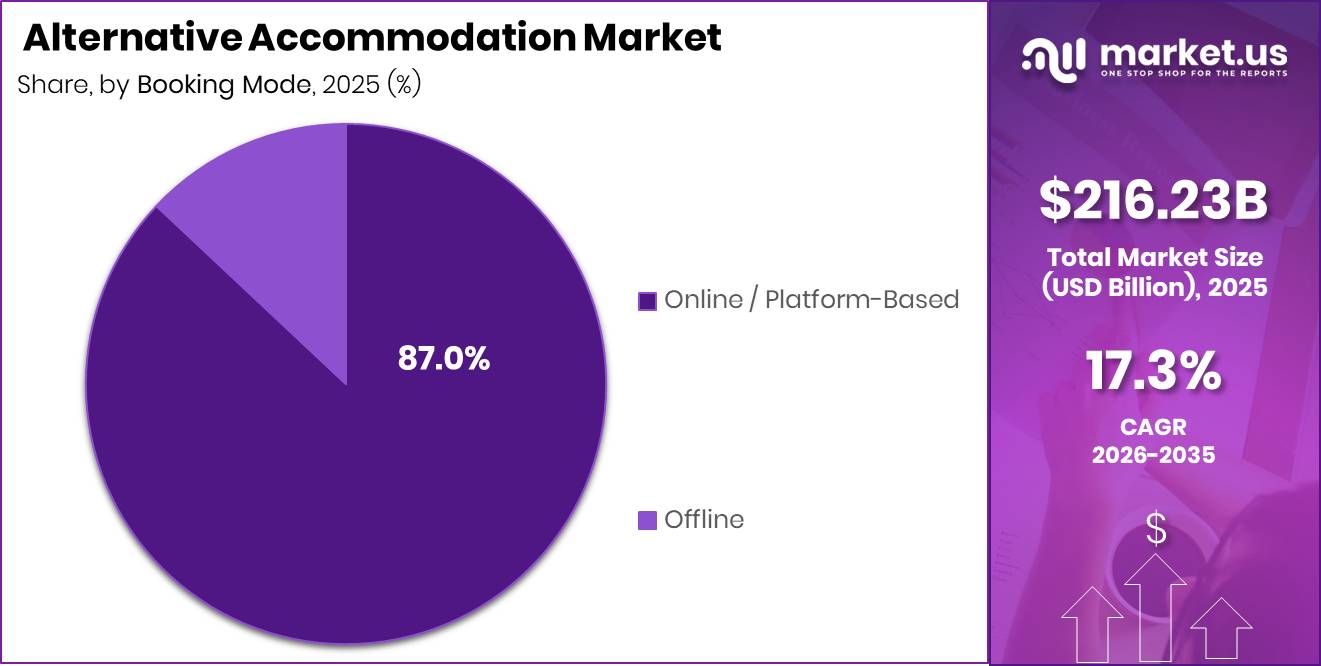
Global Alternative Accommodation Market size is expected to be worth around USD 906.50 Billion by 2035 from USD 216.23 Billion in 2025, growing at a CAGR of 17.3% during the forecast period 2026 to 2035. This scale of expansion signals a structural shift in how travelers worldwide choose to stay, creating a high-stakes competitive arena for platforms, property managers, and investors alike.
The alternative accommodation market covers non-traditional lodging options outside standard hotel chains. This includes vacation rentals, homestays, hostels, and villa or luxury home rentals. Travelers book these properties through online platforms, travel agents, or directly from hosts. The market serves leisure travelers, business travelers, and long-stay guests across all income tiers globally.
Key Takeaways
- Market size reached USD 216.23 Billion in 2025 and is forecast to reach USD 906.50 Billion by 2035.
- The market grows at a CAGR of 17.3% from 2026 to 2035.
- By Accommodation Type, Vacation Rentals dominate with a 41.00% share in 2025.
- By Booking Mode, Online/Platform-Based bookings hold a 87.00% share, reflecting deep digital penetration.
- By End User, Leisure Travelers lead with a 62.00% share in 2025.
- By Price Range, Budget/Economy tier holds the largest share at 48.00% in 2025.
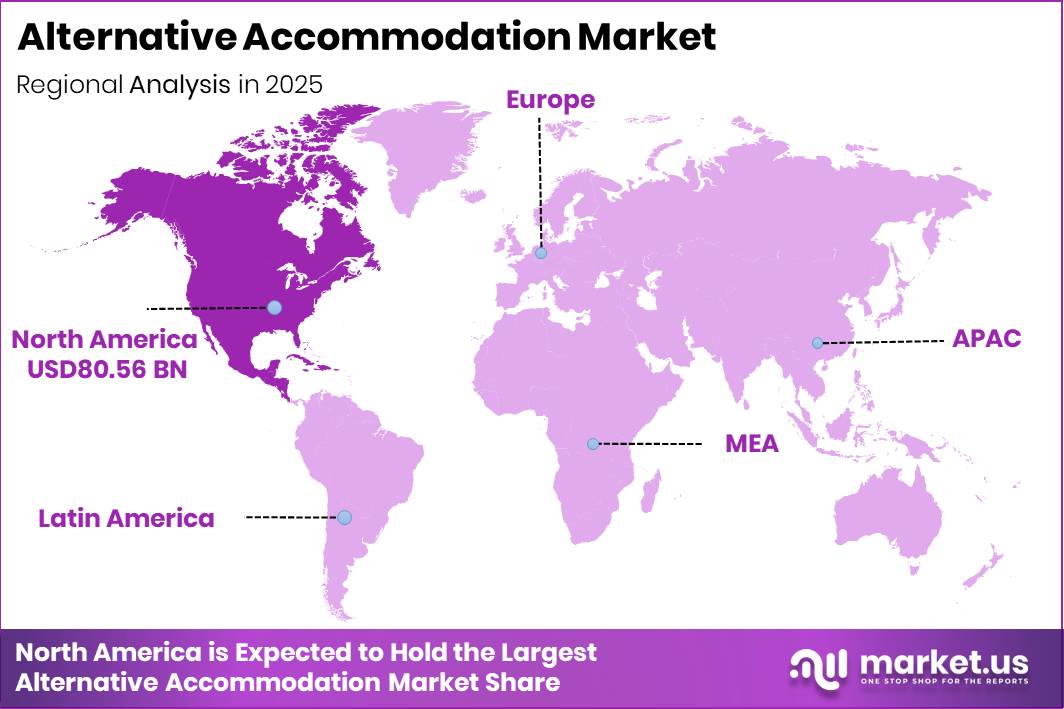
- North America dominates regionally with a 37.26% market share, valued at USD 80.56 Billion in 2025.
According to Booking.com, the platform collected responses from 32,000 travelers across 34 countries and territories for its 2025 sustainability research. This scale of data collection reflects how central traveler values now are to platform strategy. Operators who align their listings with community and environmental priorities will benefit from stronger conversion among this growing segment of value-conscious guests.
Booking.com data shows 53% of travelers are conscious of tourism’s impact on local communities and the environment. This behavioral shift gives alternative accommodation operators a measurable advantage over hotel chains in marketing community-based stays. As per our research, 85% of travelers said sustainable travel is important or very important to them in 2026, signaling that sustainability messaging is no longer optional for competitive operators. In December 2025, PRISM received shareholder approval to raise up to ₹66.5 billion (approximately $742 million) through a fresh equity issue ahead of its planned IPO, underscoring that capital is actively flowing into the accommodation expansion space.
Accommodation Type Analysis
Vacation Rentals dominates with 41.00% due to broad inventory depth and solo and family booking flexibility.
In 2025, Vacation Rentals held a dominant market position in the By Accommodation Type segment of the Alternative Accommodation Market, with a 41.00% share. This category appeals across traveler profiles because it offers full-property access, kitchen facilities, and diverse formats from apartments to cottages. Operators in this sub-segment command pricing power for multi-night stays, reducing reliance on discount-led competition.
Villas and Luxury Homes represent the premium tier within accommodation type. Private pool villas, heritage properties, and managed luxury residences attract high-net-worth guests who prioritize exclusivity over price. This sub-segment yields the highest revenue per booking, making it a priority investment target for platform operators seeking to improve average order value without adding volume.
Homestays serve travelers seeking authentic local experiences at competitive price points. Both hosted and non-hosted formats are present, giving guests flexibility in how much interaction they prefer with property owners. This sub-segment performs strongly in cultural tourism corridors, and hosts who provide local context can command rate premiums that comparable anonymous rentals cannot. In November 2025, Evolve acquired the Guestworks portfolio from Vacasa, expanding its tech-enabled vacation rental management business and homeowner network, which signals growing operator interest in consolidating inventory across these formats.
Hostels continue to serve budget-focused travelers through dormitory rooms, private rooms, and boutique social formats. This sub-segment attracts backpackers and solo travelers in high-density urban and gateway destinations. While average nightly rates are the lowest in the market, high bed occupancy and turnover rates support viable revenue models for operators with efficient housekeeping and booking management systems.
Booking Mode Analysis
Online/Platform-Based dominates with 87.00% due to traveler preference for real-time comparison and instant booking.
In 2025, Online/Platform-Based bookings held a dominant market position in the By Booking Mode segment of the Alternative Accommodation Market, with a 87.00% share. OTA platforms, meta-search tools, direct host websites, mobile apps, and social media channels all contribute to this concentration. This level of digital penetration means that alternative accommodation operators who lack strong platform presence are structurally disadvantaged in reaching bookable demand.
Offline booking channels, including travel agents, direct phone reservations, and corporate travel management companies, account for the remaining share. These channels remain relevant for complex itineraries, group travel, and corporate relocation accounts that require negotiated terms. Operators serving these buyer types must maintain dedicated offline sales capacity to avoid losing high-value, multi-night accounts to hotel competitors with established corporate desks.
End User / Traveler Type Analysis
Leisure Travelers dominates with 62.00% due to preference for flexible self-catered accommodation over hotel stays.
In 2025, Leisure Travelers held a dominant market position in the By End User / Traveler Type segment of the Alternative Accommodation Market, with a 62.00% share. This group spans solo backpackers, couples, families, and multi-generational friend groups. Market.us found that 73% of travelers in 2025 wanted the money they spend while traveling to go back to local communities, a preference that alternative accommodation fulfills more directly than chain hotels.
Business Travelers represent a structurally distinct segment, driven by short-term project stays, extended business assignments, and the fast-expanding digital nomad cohort. As per our research, 74% of travelers consider extreme weather risks when selecting destinations and travel dates, a concern that increasingly affects corporate travel planning and extended-stay decision-making. Operators offering flexible cancellation and reliable digital infrastructure can capture greater share of this risk-sensitive segment.
Long-Stay and Relocation Travelers include corporate relocatees, students, and expatriate workers who require accommodation for weeks or months at a time. This sub-segment generates the highest revenue per booking cycle and the lowest customer acquisition cost relative to booking value. Property managers who develop purpose-designed long-stay inventory with utilities, laundry, and workspace included can command rate premiums and multi-month occupancy guarantees unavailable in short-stay formats.
Price Range / Tier Analysis
Budget/Economy (Below USD 50/night) dominates with 48.00% due to price sensitivity among the majority of global travelers.
In 2025, the Budget/Economy tier held a dominant market position in the By Price Range / Tier segment of the Alternative Accommodation Market, with a 48.00% share. This tier serves the highest volume of individual bookings globally, anchored by backpackers, budget family travelers, and price-driven leisure guests. Operators competing in this tier must prioritize operational efficiency, platform ranking optimization, and review management to protect occupancy at low margin per unit.
The Mid-Range tier, covering USD 50 to USD 150 per night, serves the broadest cross-section of leisure and short-business-trip travelers. Properties in this band offer the most price-elastic booking behavior, meaning operators who improve perceived value through amenities, response speed, and accurate listings can shift bookings from budget tier properties without requiring major capital investment. The Premium and Ultra-Premium tiers, priced above USD 150 per night, collectively serve guests prioritizing quality, exclusivity, and service. These tiers generate disproportionately high revenue per booking and attract lower platform fee sensitivity, giving operators greater pricing control and margin than the budget segment allows.
Key Market Segments
By Accommodation Type
- Vacation Rentals
- Entire homes
- Apartments
- Villas
- Cottages
- Villas and Luxury Homes
- Private pool villas
- Heritage and boutique villas
- Managed luxury residences
- Homestays
- Hosted (host lives on premises)
- Non-hosted (guest has full property access)
- Hostels
- Dormitory rooms
- Private rooms within hostels
- Boutique / social hostels
- Others
By Booking Mode
- Online / Platform-Based
- OTA platforms (Airbnb, Booking.com, VRBO)
- Meta-search platforms (HomeToGo, Trivago)
- Brand / host direct websites (D2C)
- Mobile apps
- Social media booking (Instagram, Facebook)
- Offline
- Travel agents and tour operators
- Direct reservation (phone / walk-in)
- Corporate travel management companies (TMCs)
By End User / Traveler Type
- Leisure Travelers
- Solo travelers and backpackers
- Couples and honeymooners
- Families with children
- Friend groups and multi-generational travel
- Business Travelers
- Short-term project stays
- Extended business stays (1+ weeks)
- Digital nomads and remote workers
- Long-Stay / Relocation Travelers
- Corporate relocation
- Students and academic travelers
- Expatriates and international workers
By Price Range / Tier
- Budget / Economy (Below USD 50/night)
- Mid-Range (USD 50 to 150/night)
- Premium (USD 150 to 400/night)
- Ultra-Premium / Luxury (Above USD 400/night)
Regional Analysis
North America Dominates the Alternative Accommodation Market with a Market Share of 37.26%, Valued at USD 80.56 Billion
North America holds the largest regional position in the alternative accommodation market, driven by high household disposable incomes, deep OTA penetration, and a mature short-term rental regulatory environment. The region’s combination of long domestic travel corridors, remote-work culture, and large urban leisure markets creates consistent year-round demand. Investors targeting this region can access the most liquid and well-documented market for property-level revenue modeling.
Europe represents the second largest regional market, supported by dense cross-border leisure travel, high urban tourism density, and strong platform infrastructure. Eurostat data shows that in the first quarter of 2025, guests spent 129.6 million nights in short-term rental accommodation across the EU booked through online platforms. EU short-stay nights booked through online platforms increased by 16.3% in January 2025 compared with January 2024, confirming a structural demand rebound rather than a seasonal spike.
Data from Eurostat shows guests spent 245.9 million nights in EU short-term rental accommodation through online platforms in Q2 2025. As reported by Eurostat, Q2 2025 online short-term rental guest nights in the EU increased by 17.8% year-over-year. This acceleration in sequential quarters signals that European alternative accommodation demand is strengthening rather than plateauing, making the region a high-priority focus for platform expansion and inventory investment.
Asia Pacific is the fastest-expanding regional market, powered by rising middle-class travel, growing intra-regional tourism, and increasing smartphone-based booking behavior across China, India, South Korea, and Southeast Asia. Platform operators that localize their offering through language, payment method support, and culturally relevant property formats can establish early structural advantages before competition in the region intensifies.
Latin America and the Middle East and Africa represent earlier-stage but high-potential regional markets. Both regions benefit from growing inbound tourism, expanding digital payment infrastructure, and youth-dominant traveler demographics that favor platform-based booking. Operators willing to invest in local host onboarding and regulatory compliance in these regions can capture first-mover advantages at lower customer acquisition cost than in saturated North American or European markets.
Key Regions and Countries
North America
- US
- Canada
Europe
- Germany
- France
- The UK
- Spain
- Italy
- Rest of Europe
Asia Pacific
- China
- Japan
- South Korea
- India
- Australia
- Rest of APAC
Latin America
- Brazil
- Mexico
- Rest of Latin America
Middle East and Africa
- GCC
- South Africa
- Rest of MEA
Drivers
Hotel pricing pressure is pushing travelers toward alternative lodging as the cost gap between hotels and short-term rentals becomes more visible. U.S. consumer spending data show households allocate approximately 10% of disposable personal income to food, illustrating the broader cost-of-living pressure shaping travel budgets. As hotel rates rise in urban and leisure destinations, apartments and vacation rentals become more attractive on a per-night basis, especially for stays longer than two nights where kitchen access reduces total trip cost.
Cost-conscious travelers increasingly compare alternatives based on per-person value, self-catering capacity, and booking flexibility rather than brand loyalty. Operators that emphasize accommodation savings and functional benefits can improve booking conversion without relying solely on discounting. This dynamic expands the addressable customer base for alternative accommodations, creating sustained demand from travelers who historically preferred hotels for predictability alone.
| Driver | (~) % Impact on CAGR Forecast | Geographic Relevance | Impact Timeline |
|---|---|---|---|
| Sustained global travel recovery | +2.5% | EU, North America, Asia-Pacific, Middle East recovery zones | Short term (≤ 2 years) |
| Structural remote-work lodging demand | +2.8% | North America core, EU digital-work hubs, Southeast Asia | Short term (≤ 2 years) |
| Household fragmentation widens traveler base | +1.8% | EU core, North America, Japan | Medium term (2-4 years) |
| Hotel pricing pressure drives alternative adoption | +1.9% | North America, EU city-break corridors, GCC | Short term (≤ 2 years) |
| Platform trust infrastructure matures | +1.7% | North America, EU, advanced APAC | Medium term (2-4 years) |
| Secondary destination overflow demand | +1.6% | Southern Europe, Southeast Asia, Latin America tier-1 | Medium term (2-4 years) |
Restraints
Geopolitical shocks directly reduce alternative accommodation demand in affected regions by cutting off the leisure, city-break, and independent travel segments that the market relies on most. Middle East international arrivals declined 14% year over year in Q1 2026, reflecting how quickly conflict and instability translate into lost room nights and booking cancellations. Global tourism growth slowed to 0.4% in March 2026, confirming that disruption in one region can suppress overall travel volume across connected corridors.
Alternative accommodation operators face greater exposure to geopolitical risk than hotel chains because they depend more heavily on discretionary and independent travel. Travelers cancel or reroute these trips faster than corporate or package travel when uncertainty rises. This produces immediate occupancy declines and booking volume drops in impacted destinations, with secondary effects spreading to neighboring markets and long-haul origin corridors that feed the disrupted region.
| Restraint | (~) % Impact on CAGR Forecast | Geographic Relevance | Impact Timeline |
|---|---|---|---|
| Urban regulatory caps | -2.1% | EU urban cores, North America tier-1 cities, APAC metros | Medium term (2-4 years) |
| Geopolitical travel disruption | -1.8% | Middle East, Europe corridors, long-haul global markets | Short term (≤ 2 years) |
| Housing affordability backlash | -1.7% | EU city centers, U.S. coastal metros, tourism hotspots | Long term (≥ 4 years) |
| High transport-cost spillover | -1.4% | Long-haul leisure markets, islands, remote destinations | Short term (≤ 2 years) |
| Supply withdrawal to long-stay | -1.3% | North America core, EU residential pressure zones | Medium term (2-4 years) |
| Demand sensitivity in family budgets | -1.2% | North America, Western Europe, middle-income source markets | Short term (≤ 2 years) |
Challenges
Quality and consistency dispersion across host-operated properties remains a structural drag on the alternative accommodation market. Unlike hotel chains with standardized operating procedures, individual hosts can differ widely in cleanliness, Wi-Fi reliability, amenity accuracy, and noise management. Even minor quality gaps reduce traveler confidence among mainstream guests who compare these stays directly against established hotel brands offering predictable service standards.
Platforms and property managers must invest in host training, standardized cleaning protocols, property inspections, and review-system calibration to reduce this variability at scale. Inconsistent guest experiences discourage repeat bookings and increase reliance on hotels for portions of multi-trip itineraries. This creates a measurable drag on customer retention and lifetime booking value, limiting the sector’s ability to convert hotel-loyal travelers permanently to alternative accommodation formats.
| Challenge | (~) % CAGR Friction Drag | Geographic Relevance | Mitigation Horizon |
|---|---|---|---|
| Regulatory and zoning uncertainty | -1.6% | EU regulatory hubs, North America cities, APAC metros | Medium term (2-4 years) |
| Seasonality and demand volatility | -1.4% | Europe leisure corridors, coastal & island markets | Short term (≤ 2 years) |
| Quality and consistency dispersion | -1.3% | Global high-tourism destinations | Medium term (2-4 years) |
| Remote-work affordability inequalities | -1.2% | North America core, EU digital hubs, urban APAC | Long term (≥ 4 years) |
| Host and operations capability gaps | -1.1% | Emerging markets, secondary cities worldwide | Medium term (2-4 years) |
| Housing affordability and social pushback | -1.3% | EU urban cores, North America tier-1, tourist hotspots | Long term (≥ 4 years) |
Opportunities
Family-lite flexible lodging represents an underserved but structurally well-defined opportunity. In the EU, only 23.4% of households included children in 2025, while approximately 6.1 million households with children were headed by a single parent. More than 60% of these single-parent households had only one child, which points directly to demand for compact, adaptable accommodation formats rather than traditional large-family vacation home layouts.
Units designed with one bedroom plus convertible sleeping space can serve single-parent families, one-child households, and nontraditional travel groups that neither standard hotel rooms nor large vacation homes address efficiently. Tailored pricing structures for these unit types avoid the cost penalty of oversized accommodation, improving affordability and booking conversion. Operators who align inventory design with actual household composition can improve both occupancy rates and space utilization efficiency across their portfolios.
| Opportunity | (~) % Potential CAGR Upside | Geographic Relevance | Execution Window |
|---|---|---|---|
| Solo-traveler micro-stays | +2.4% | EU core, Japan, South Korea, North America cities | Short term (≤ 2 years) |
| Remote-work mid-stay products | +2.7% | North America core, Portugal, Spain, UK, Southeast Asia | Medium term (2-4 years) |
| Family-lite flexible inventory | +1.8% | EU leisure corridors, North America, Australia | Medium term (2-4 years) |
| Senior extended-stay formats | +1.9% | Western Europe, Japan, North America | Long term (≥ 4 years) |
| Managed secondary-city supply | +2.1% | Southern Europe, tier-2 U.S. metros, Latin America tourism nodes | Medium term (2-4 years) |
| Subscription travel lodging models | +1.6% | North America, EU digital-native segments, advanced APAC | Long term (≥ 4 years) |
Key Company Insights
Airbnb, Inc. operates the world’s largest peer-to-peer accommodation platform and reported more than 5.5 million hosts worldwide as of Q2 2025. This supply-side scale creates a structural network effect that makes competitive displacement by new entrants costly and slow. However, Airbnb’s heavy reliance on individual host quality creates consistency risk that organized property managers can exploit to position professionally managed inventory as more reliable.
Booking Holdings Inc. (Booking.com) has positioned sustainability compliance as a core platform differentiator. Booking.com data indicates 57% of travelers believe tourism has an overall positive impact where they live, and the platform recorded more than 100 million room nights booked at sustainability-certified properties in 2025. In May 2025, Belvilla by OYO acquired Australian short-term rental management platform MadeComfy, strengthening its Asia-Pacific supply footprint and increasing competitive pressure on Booking.com’s position in that region. In August 2025, Sonder Holdings reported approximately 9,400 live units globally as it continued restructuring toward higher-performing properties.
Key Players
- Airbnb, Inc.
- Booking Holdings Inc. (Booking.com)
- Expedia Group Inc. (VRBO / HomeAway)
- Trip.com Group Limited (Ctrip)
- Wyndham Destinations Inc.
- OYO Rooms (Oravel Stays Pvt. Ltd.)
- Vacasa LLC
- Sonder Holdings Inc.
- HomeToGo GmbH
- TripAdvisor Inc. (FlipKey / HouseTrip)
- MakeMyTrip Limited
- Holidu GmbH
- Onefinestay (Accor SA)
- Blueground
- Trivago N.V.
Recent Developments
- March 2025 – Casago increased its acquisition offer for Vacasa to $5.30 per share in cash, amending the previously announced merger agreement and raising the total consideration for shareholders.
- April 2025 – Vacasa shareholders approved the merger with Casago, clearing a major regulatory and ownership step toward consolidation in the vacation rental management sector.
- May 2025 – Vacation rental management company Casago completed its acquisition of Vacasa, creating a combined platform managing more than 40,000 vacation rental properties across North America, Belize, Costa Rica, and the Caribbean.
- October 2025 – OYO Assets announced plans to acquire 12 hotels during the second half of the fiscal year to expand its premium and mid-premium accommodation portfolio.
- September 2025 – A consortium led by InCred and Analah invested ₹50 crore in Sunday PropTech, a PRISM-backed company associated with OYO’s accommodation expansion initiatives.
Report Scope
| Report Features | Description |
|---|---|
| Market Value (2025) | USD 216.23 Billion |
| Forecast Revenue (2035) | USD 906.50 Billion |
| CAGR (2026-2035) | 17.3% |
| Base Year for Estimation | 2025 |
| Historic Period | 2020-2024 |
| Forecast Period | 2026-2035 |
| Report Coverage | Revenue Forecast, Market Dynamics, Market Opportunity Analysis, Technology and Innovation Landscape, Competitive Landscape, Recent Developments |
| Segments Covered | By Accommodation Type (Vacation Rentals, Villas and Luxury Homes, Homestays, Hostels); By Booking Mode (Online/Platform-Based, Offline); By End User / Traveler Type (Leisure Travelers, Business Travelers, Long-Stay / Relocation Travelers); By Price Range / Tier (Budget/Economy, Mid-Range, Premium, Ultra-Premium / Luxury) |
| Regional Analysis | North America (US and Canada), Europe (Germany, France, The UK, Spain, Italy, and Rest of Europe), Asia Pacific (China, Japan, South Korea, India, Australia, and Rest of APAC), Latin America (Brazil, Mexico, and Rest of Latin America), Middle East and Africa (GCC, South Africa, and Rest of MEA) |
| Competitive Landscape | Airbnb, Inc.; Booking Holdings Inc. (Booking.com); Expedia Group Inc. (VRBO / HomeAway); Trip.com Group Limited (Ctrip); Wyndham Destinations Inc.; OYO Rooms (Oravel Stays Pvt. Ltd.); Vacasa LLC; Sonder Holdings Inc.; HomeToGo GmbH; TripAdvisor Inc. (FlipKey / HouseTrip); MakeMyTrip Limited; Holidu GmbH; Onefinestay (Accor SA); Blueground; Trivago N.V. |
| Customization Scope | Customization for segments, region/country-level will be provided. Additional customization can be done based on requirements. |
| Purchase Options | We have three licenses to opt for: Single User License, Multi-User License (Up to 5 Users), Corporate Use License (Unlimited User and Printable PDF) |


