


Report Overview
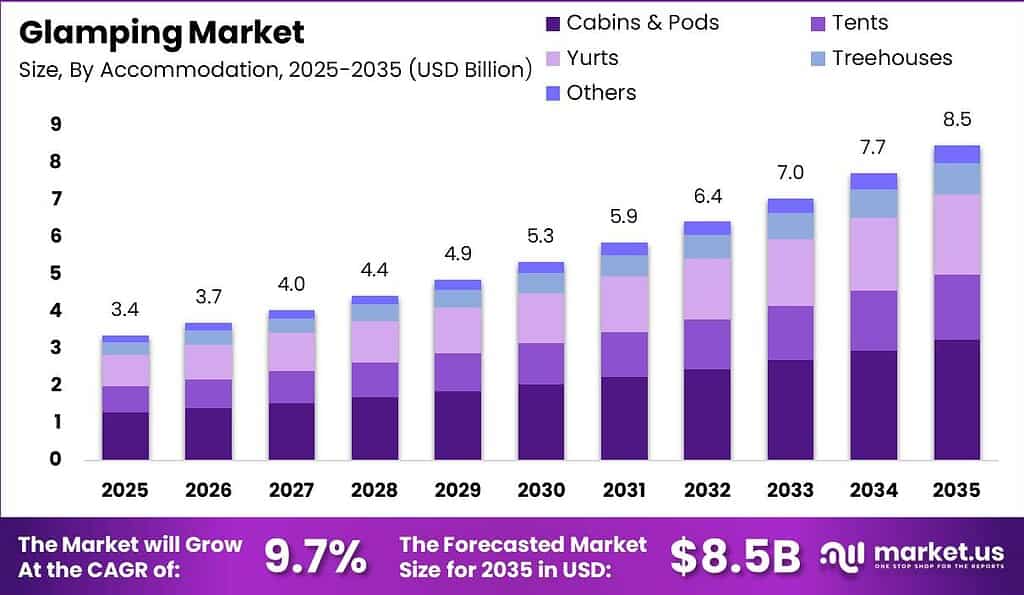
The Global Glamping Market size is expected to be worth around USD 8.5 Billion by 2035, from USD 3.4 Billion in 2025, growing at a CAGR of 9.7% during the forecast period from 2026 to 2035.
The 2025 KOA report found that 72% of campers consider camping a cost-effective travel option. This perception anchors glamping’s competitive advantage against traditional hospitality during periods of consumer spending caution. Operators who price strategically within the value-conscious outdoor travel bracket capture first-mover loyalty before demand stabilizes at higher rate tiers.
According to the 2026 Canopy and Stars Glamping Market Report, women account for approximately 60% of all bookings on the platform. This demographic skew carries direct implications for product design, marketing messaging, and on-site amenity investment. As per our research, 18% of bookings include dogs, confirming that pet-inclusive accommodation is a structural preference rather than a niche feature.
Key Takeaways
- The global glamping market is valued at USD 3.4 Billion in 2025 and is forecast to reach USD 8.5 Billion by 2035.
- The market expands at a CAGR of 9.7% from 2026 to 2035.
- Cabins and Pods hold the largest accommodation share at 38.3%, driven by structural durability and year-round usability.
- The 18–32 age group is the fastest-growing demographic segment, holding a 45.3% share.
- Online Travel Agencies lead the booking mode segment with a 50.3% share.
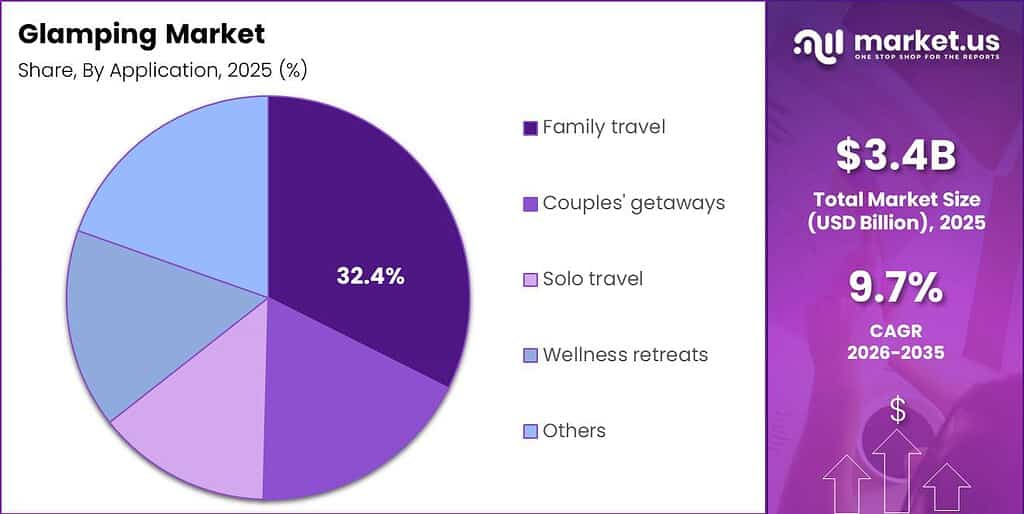
- Family travel represents the largest application segment at 32.4%.
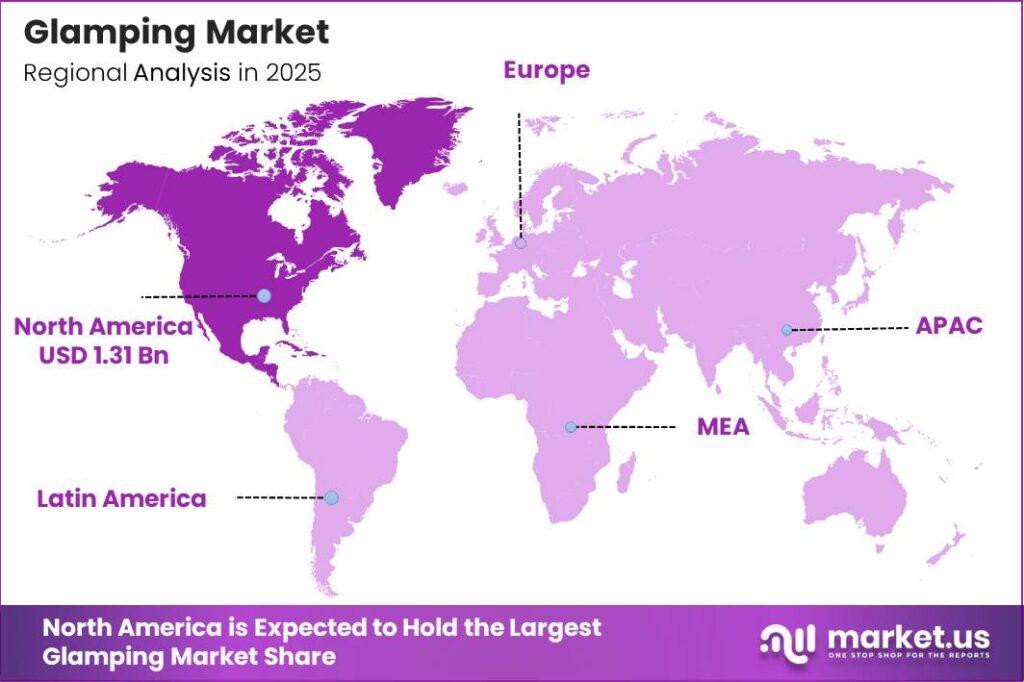
- North America dominates regional demand with a 38.8% market share, valued at USD 1.31 Billion.
Data from the 2025 KOA report shows 31% of first-time campers selected glamping accommodations, positioning glamping as the primary entry point for new outdoor travelers. As reported by Business Insider, 61% of all new campers in 2024 were Gen Z or Millennials. This generational entry pattern ensures a sustained pipeline of repeat customers as these cohorts age into higher spending brackets over the forecast period.
Accommodation Analysis
Cabins and Pods dominate with 38.3% due to all-season structural durability advantage.
In 2025, Cabins and Pods held a dominant market position in the By Accommodation segment of the Glamping Market, with a 38.3% share. The U.S. Census Bureau’s Survey of Construction recorded a sustained rise in prefabricated modular unit shipments through 2024 and 2025, confirming strong production-side supply enabling rapid site development. Cabins and pods offer operators the highest year-round occupancy potential of any glamping format, directly improving revenue per available unit and justifying premium land-lease commitments at remote locations.
Tents represent the fastest-growing sub-segment within the accommodation category, driven by low upfront capital requirements and flexible deployment on diverse terrain types. The International Trade Administration’s trade flow data shows canvas and technical fabric imports for outdoor accommodation purposes rose consistently across 2023 to 2025, reflecting active operator investment in tent-based inventory expansion. Tents allow new market entrants to test site viability before committing to permanent structure costs, which lowers the financial barrier to glamping site launch.
Yurts serve a differentiated buyer seeking an authentic cultural and off-grid aesthetic that cabins and pods cannot replicate. The Outdoor Industry Association reports that circular fabric structure adoption for hospitality applications increased across North America and Europe through 2024. Yurts carry lower installed costs than hard-shell structures, making them a viable scaling tool for operators expanding site capacity without triggering full planning permission reviews in certain jurisdictions.
Treehouses occupy a premium positioning within the glamping accommodation mix, commanding the highest average nightly rates due to architectural complexity and supply scarcity. The American Institute of Architects custom residential construction index noted sustained demand for elevated timber structures through 2025. Treehouses generate outsized social media visibility relative to their unit count, producing organic marketing returns that lower effective customer acquisition costs at established sites. Other formats including domes and converted vehicles hold the remaining inventory share collectively.
Age Group Analysis
18 to 32 Years dominates with 45.3% due to experiential spending prioritization over goods.
In 2025, the 18 to 32 years cohort held a dominant market position in the By Age Group segment of the Glamping Market, with a 45.3% share. ITU digital access data confirms this cohort represents the highest per-capita online booking activity of any age group, translating directly into OTA and direct-booking conversion rates that glamping operators can target with precision digital spend. Their preference for shareable, visually distinctive experiences creates compounding organic reach that reduces paid acquisition dependency for operators who design Instagram-worthy site environments.
The 33 to 50 years segment drives the highest average booking value per trip due to greater disposable income and preference for multi-night stays with premium amenity add-ons. World Bank household income data through 2025 shows this bracket sustaining real income growth in North America and Western Europe, supporting continued spend on experiential travel. Operators who develop family-inclusive cabin packages with guided activities target this cohort directly, as dual-income households in this age band prioritize quality of experience over lowest price.
The 51 to 65 years segment represents a structurally underserved demand pool with high spending capacity and strong preference for wellness and nature-based retreat formats. OECD retirement income adequacy data confirms this cohort holds the highest accumulated savings of any active travel age group across developed markets. Glamping operators who invest in accessibility-compliant cabin designs and curated low-intensity nature programs unlock a high-margin repeat customer base with significantly lower price sensitivity than younger cohorts.
Travelers above 65 years represent a growing share of leisure tourism globally, supported by World Bank data showing expanding life expectancy and post-retirement travel spending across OECD nations. This cohort prioritizes comfort, accessibility, and proximity to medical services, meaning that well-located, fully amenitized glamping sites near established infrastructure can convert a share of traditional resort demand. Operators positioned near national parks with accessible site design gain first-mover advantage in this underexplored age segment.
Booking Mode Analysis
Online Travel Agencies dominate with 50.3% due to aggregated inventory discovery at booking scale.
In 2025, Online Travel Agencies held a dominant market position in the By Booking Mode segment of the Glamping Market, with a 50.3% share. ITU internet user statistics show that global online travel transaction volumes surpassed pre-2020 benchmarks by 2024, with accommodation booking representing the single largest category by transaction count. OTA dominance means glamping operators accept a commission drag of typically 15% to 25% per booking, creating a structural financial incentive to migrate high-frequency guests onto direct booking channels over time.
Direct Booking channels represent the highest-margin revenue stream available to glamping operators, removing intermediary commission costs and enabling first-party guest data capture for repeat booking campaigns. The U.S. Travel Association’s direct-booking trend data through 2025 confirms that independent hospitality operators investing in proprietary reservation technology saw measurable conversion improvements within 12 to 18 months of implementation. Operators with loyalty program integration on direct channels achieve materially lower blended customer acquisition costs than those relying exclusively on OTA traffic.
Travel Agents retain a relevant share of glamping bookings, particularly for premium corporate retreat packages, international group travel, and multi-destination itineraries where coordination complexity favors professional intermediation. The American Society of Travel Advisors reported sustained recovery in agent-managed bookings through 2024 and 2025, with luxury and experiential travel categories outperforming standard leisure booking volumes. Glamping operators who offer commission-structured agent programs gain access to pre-qualified high-value group clients that organic digital marketing channels rarely reach.
Application Analysis
Family Travel dominates with 32.4% due to multi-unit booking volume and repeat annual stays.
In 2025, Family Travel held a dominant market position in the By Application segment of the Glamping Market, with a 32.4% share. U.S. Bureau of Economic Analysis leisure expenditure data confirms that family travel commands the highest total trip spend per party across domestic outdoor accommodation categories, driven by multi-room or multi-unit requirements and extended stay durations. Glamping operators who configure their sites with adjoining cabin clusters and shared outdoor activity zones capture the full family trip budget rather than a single-unit nightly rate.
Couples’ Getaways represent the second-largest demand cluster and generate the highest revenue per person of any application category due to premium-room selection and ancillary spend on romantic add-on packages. National travel survey data from Statistics Canada and the U.S. Travel Association through 2025 shows couples consistently selecting unique and secluded accommodation over standard hotel formats for anniversary and celebratory travel. Operators who develop dedicated couples-only zones with private outdoor bathing and dining infrastructure command a rate premium of 20% to 40% above standard cabin pricing.
Wellness Retreats are the fastest-growing application sub-segment, as operators integrate spa services, forest bathing programs, and digital-detox packages into multi-night itineraries. The Global Wellness Institute’s industry sizing data confirms the wellness tourism segment outpaced total tourism spending growth through 2024. This growth signals that glamping sites with credentialed wellness programming transition from seasonal leisure assets into year-round destination products, which structurally improves revenue stability and reduces dependence on peak-season occupancy.
Solo Travel and Corporate Retreats hold the remaining application share collectively. Solo travelers seek safety, community, and structured activity programming, while corporate clients prioritize private site buyouts, team facilitation services, and branded experiential outcomes. Both sub-segments offer operators meaningful incremental revenue without requiring additional physical infrastructure investment beyond programming and staffing.
Key Market Segments
By Accommodation
- Cabins and Pods
- Tents
- Yurts
- Treehouses
- Others
By Age Group
- 18 to 32 Years
- 33 to 50 Years
- 51 to 65 Years
- Above 65 Years
By Booking Mode
- Direct Booking
- Travel Agents
- Online Travel Agencies
By Application
- Family Travel
- Couples’ Getaways
- Solo Travel
- Wellness Retreats
- Others
Regional Analysis
North America Dominates the Glamping Market with a Market Share of 38.8%, Valued at USD 1.31 Billion
North America leads global glamping demand, supported by an established outdoor recreation culture, high per-capita leisure travel spend, and a dense network of national parks and protected wilderness areas that generate natural foot traffic. As per our research, the region holds 38.8% of global market value at USD 1.31 Billion in 2025. Institutional capital entering through REIT-style structures and branded operator consolidation is accelerating site development and raising the quality floor for regional inventory.
The United Kingdom represents the fastest-growing glamping market within Europe, where a strong domestic short-break culture and limited affordable international travel options direct consumer spend toward premium local outdoor accommodation. Figures from the 2026 Canopy and Stars Glamping Market Report show that bookings across the Midlands increased by 8.9% in 2025, while listed glamping property count grew by only 2.8%. This supply-demand imbalance signals rising utilization rates and meaningful average daily rate expansion opportunity for existing operators in undersupplied UK sub-regions.
Asia Pacific, Latin America, and the Middle East and Africa represent collectively underserved regions where domestic tourism infrastructure investment and rising middle-class travel budgets are creating conditions for structured glamping market entry. India and Southeast Asia in particular show emerging domestic leisure travel patterns that align with glamping’s core value proposition of accessible nature-based premium accommodation. Early platform operators establishing branded presence in these markets gain distribution advantages before fragmented independent supply scales to meet latent demand.
Key Regions and Countries
North America
- US
- Canada
Europe
- Germany
- France
- The UK
- Spain
- Italy
- Rest of Europe
Asia Pacific
- China
- Japan
- South Korea
- India
- Australia
- Rest of APAC
Latin America
- Brazil
- Mexico
- Rest of Latin America
Middle East and Africa
- GCC
- South Africa
- Rest of MEA
Market Dynamics
Market Opportunity Analysis - Underserved segments, age cohorts, and regions offer high-margin entry points for disciplined operators.
The 51 to 65 years age cohort remains structurally underserved relative to its spending capacity in the glamping market. As established in the Age Group Analysis, this group holds the highest accumulated savings of any active travel bracket across developed markets, yet site design and programming investment directed at this cohort remains minimal compared to younger segments. Operators who develop accessibility-compliant cabin infrastructure and curated low-intensity nature experiences capture a high-margin, low-churn customer base that existing sites are not serving.
Wellness Retreats are the fastest-growing application sub-segment but remain a small share of total operator programming investment. As the Application Analysis confirms, glamping sites with credentialed wellness programming convert from seasonal assets into year-round destination products. This structural shift stabilizes revenue across shoulder seasons without requiring additional physical inventory. Operators who invest early in wellness certifications, trained practitioners, and dedicated retreat infrastructure gain a defensible positioning before the segment attracts commoditized competition.
The above-65 traveler represents an almost entirely untapped demand pool within the glamping category. As identified in the Age Group Analysis, this cohort prioritizes comfort, accessibility, and proximity to medical infrastructure, criteria that well-located and fully amenitized glamping sites near established towns can already meet. This means the barrier to capturing this segment is not product development but targeted marketing and accessibility retrofit, making it one of the lowest-capital entry points available to existing operators.
Emerging markets including India, Southeast Asia, and the Middle East represent the largest geographic white space by potential volume. As established in the Regional Analysis, rising middle-class travel budgets and domestic tourism infrastructure investment are creating conditions for structured glamping market entry in these regions. Consequently, platform operators who establish branded presence before fragmented independent supply scales gain distribution and brand recognition advantages that will be difficult for later entrants to displace at comparable cost.
Technology and Innovation Landscape - AI pricing tools, off-grid energy systems, and digital guest platforms are redefining glamping site economics.
AI-powered revenue management and dynamic pricing solutions are changing how glamping operators manage occupancy and yield. As per our research, adoption of these tools is enabling operators to optimize pricing strategies in real time against demand signals, booking pace data, and competitive rate benchmarks. This shift moves glamping site management closer to hotel-grade revenue science, improving occupancy per available unit and reducing the revenue volatility that compressed margins during shoulder seasons under static pricing models.
Solar-powered and off-grid accommodation models are gaining active adoption as developers prioritize sustainability and energy independence at remote sites. Off-grid infrastructure removes dependency on grid connection costs, which represent a material component of upfront site development expenditure for remote glamping locations. Operators who adopt solar and battery storage systems reduce long-term utility operating costs while delivering the sustainability credentials that environmentally conscious guests in the 18 to 50 age bracket increasingly require as a booking criterion.
Digital concierge platforms and mobile self-service applications are improving operational efficiency at a measurable level. These tools allow guests to manage check-in, activity booking, and service requests without staff intervention, which directly reduces labor demand per occupied unit. As the Challenges section establishes, payroll absorbs 30% to 40% of operating expense at many sites. Technology-enabled task reduction in guest services offers operators a practical path to EBITDA margin recovery without requiring headcount reductions that would damage guest experience quality.
Modular cabins and prefabricated accommodation units are enabling faster site deployment in remote and nature-based locations. Prefabrication reduces on-site construction time and weather-related build delays, which lowers the interest-carry cost incurred during the pre-revenue development window. This is a direct counter to the capital cost restraint identified in the Restraints section, where extended payback periods squeeze developer net margins. Operators who adopt prefabricated formats compress their time-to-first-booking and improve early-stage project return profiles.
Drivers
Younger travelers are reallocating discretionary budgets from goods to experiences at a measurable pace, and glamping sits at the center of this shift. UNWTO tourism barometer data through 2025 shows nature-adjacent and unique-stay categories growing faster than any other leisure accommodation format. This behavioral reweighting pushes operators to move beyond flat nightly rates toward bundled experience monetization, where guided activities, wellness services, and food and beverage add-ons lift revenue per available unit and widen contribution margins on incremental bookings.
Digital booking infrastructure is compounding this demand signal by reducing friction between consumer intent and confirmed reservation. Expansion of operator-owned reservation systems and OTA channel penetration improves site visibility at a national and global scale. As per our research, average daily rates climbed to approximately $251 per night in 2025 from around $207 in 2023, a 21% uplift, improving contribution margins by 8 to 12 percentage points on incremental bookings. Operators who combine direct booking channels with yield management tools capture this margin expansion most efficiently.
| Driver | (~) % Impact on CAGR Forecast | Geographic Relevance | Impact Timeline |
|---|---|---|---|
| Experiential travel demand shift among millennials and Gen Z | +2.8% | North America, Western Europe, Asia Pacific | Short term (2 years or less) |
| Premium average daily rate expansion and yield management adoption | +2.1% | North America, United Kingdom | Short term (2 years or less) |
| Institutional capital and REIT-style consolidation entering the vertical | +1.6% | North America, Western Europe | Medium term (2 to 4 years) |
| Eco-tourism and low-footprint accommodation preference | +1.3% | Global | Medium term (2 to 4 years) |
| Digital direct-booking and OTA channel maturation | +0.9% | Global | Short term (2 years or less) |
| Domestic and drive-to leisure tourism resilience | +0.7% | North America, India, Europe | Short term (2 years or less) |
Restraints
Capital costs are the primary structural brake on glamping site expansion. U.S. Federal Reserve and European Central Bank policy-rate records confirm benchmark rates remained near multi-decade highs through much of 2024 and 2025. A single safari-tent or pod unit carries an installed cost of $30,000 to $80,000 before platforms, utilities, and sanitation infrastructure. At these figures, a debt-service squeeze of 200 to 300 basis points converts viable expansion pipelines into deferred or cancelled projects, pushing planned site openings out by 12 to 24 months.
Land-use regulations impose a parallel constraint on new site development timelines. Zoning restrictions and environmental permitting requirements delay project approvals across the UK, US, and France, where planning denial rates remain meaningful friction for independent operators. Statutory 28-day operating caps on unpermitted land in the UK further compress revenue windows for sites that cannot navigate full planning permission. This regulatory patchwork raises entry cost and extends the time-to-revenue curve, which deters smaller capital allocators from entering the market.
| Restraint | (~) % Impact on CAGR Forecast | Geographic Relevance | Impact Timeline |
|---|---|---|---|
| Elevated interest rates freezing new site CapEx | -2.4% | North America, Europe | Short term (2 years or less) |
| Restrictive zoning and planning permission denials | -1.9% | United Kingdom, United States, France | Medium term (2 to 4 years) |
| High land acquisition and construction cost inflation | -1.4% | North America, Western Europe | Short term (2 years or less) |
| Statutory 28-day operating caps on unpermitted land | -1.0% | United Kingdom | Short term (2 years or less) |
| Insurance and public liability premium escalation | -0.7% | Global | Short term (2 years or less) |
Challenges
Seasonal labor scarcity in remote hospitality settings drags an estimated -1.5% from the baseline growth rate. U.S. Bureau of Labor Statistics leisure-and-hospitality data showed persistently elevated quit rates and unfilled openings through 2024 and 2025, with frontline pay rising at 5% to 9% annually. Payroll absorbs 30% to 40% of operating expense at many sites and erodes EBITDA margins by 3 to 6 points during shoulder seasons when occupancy thins against a fixed labor base.
Operators who invest in cross-trained multi-role staffing, seasonal housing provision, and digital check-in automation partially offset this challenge. IoT-monitored maintenance and mobile self-service applications reduce manual task load without requiring full headcount increases. However, U.S. Small Business Administration operating-cost benchmarks confirm that these technology investments raise upfront overhead even as they stabilize the labor structure. This creates a short-term margin compression trade-off that smaller independent operators struggle to absorb without external capital support.
| Challenge | (~) % CAGR Friction Drag | Geographic Relevance | Mitigation Horizon |
|---|---|---|---|
| Seasonal labor shortage and retention | -1.5% | North America, Western Europe | Medium term (2 to 4 years) |
| Extreme weather and climate exposure | -1.2% | Global | Long term (4 years or more) |
| Fragmented supply chain for structures | -0.9% | North America, Asia Pacific | Medium term (2 to 4 years) |
| Off-grid utility and connectivity gaps | -0.7% | Emerging markets, rural regions | Medium term (2 to 4 years) |
| Inconsistent quality and brand standards | -0.5% | Global | Long term (4 years or more) |
Opportunities
Consolidation of the fragmented independent-operator base represents the single largest untapped upside, estimated at +2.2% above the baseline growth rate. U.S. Census Bureau County Business Patterns data through 2025 confirms the accommodation category remains dominated by micro-enterprises with fewer than 10 employees. Rolling these independents into centrally managed branded portfolios unlocks shared reservation infrastructure, procurement leverage, and unified yield management, lifting stabilized net operating margins by an estimated 6 to 10 percentage points per acquired site.
Corporate retreat and wellness programming represent two further high-value vectors for near-term revenue diversification. The corporate retreat vertical offers an estimated +1.7% CAGR upside by converting glamping sites from leisure-only assets into year-round MICE destinations. Wellness and workation programming adds an estimated +0.8% by extending off-season occupancy through structured programming rather than price discounting. Both vectors reduce revenue volatility and strengthen the investment case for new site development capital.
| Opportunity | (~) % Potential CAGR Upside | Geographic Relevance | Execution Window |
|---|---|---|---|
| Fragmented independent-operator M&A roll-up | +2.2% | North America, Western Europe | Medium term (2 to 4 years) |
| Corporate retreat and MICE vertical expansion | +1.7% | North America, Europe, India | Medium term (2 to 4 years) |
| Emerging-market untapped domestic tourism white space | +1.5% | India, Southeast Asia, Middle East | Long term (4 years or more) |
| Loyalty and subscription membership monetization | +1.1% | Global | Medium term (2 to 4 years) |
| Off-season wellness and workation programming | +0.8% | North America, Europe | Long term (4 years or more) |
Key Company Insights
AutoCamp has built its competitive position around the Airstream-branded glamping format, targeting design-conscious urban travelers who prioritize aesthetic differentiation over traditional camping. The 2026 Canopy and Stars Glamping Market Report confirms that travelers aged 25 to 34 represent the largest glamping customer demographic, a cohort that AutoCamp’s branding directly addresses. This focus creates strong repeat booking rates but limits addressable market scale compared to operators with multi-format accommodation portfolios.
In April 2026, Hyatt Hotels Corporation partnered with Under Canvas to allow guests to book Under Canvas glamping stays through Hyatt’s loyalty ecosystem. This integration gives Under Canvas access to Hyatt’s premium loyalty member base without requiring a proportional increase in direct marketing spend. The partnership validates the broader institutional hospitality sector’s view of luxury outdoor accommodation as a credible extension of premium hotel brand equity.
Key Players
- AutoCamp
- Wigwam Holidays
- Westgate River Ranch
- Under Canvas
- Terramor Outdoor Resort
- Tanja Lagoon Camp
- Postcard Cabins
- Paws Up
- Paperbark Camp
- Huttopia
- Firelight Camps
- Conestoga Ranch
- Collective Retreats
- Camp Denali
- Beckons Collection
Recent Developments
- August 2025: Under Canvas opened new glamping locations near Yosemite National Park and the Columbia River Gorge as part of its U.S. national park proximity expansion strategy.
- May 2025: Hipcamp expanded its marketplace by adding thousands of RV parks, camping resorts, and glamping properties, increasing its total worldwide campsite inventory to 565,000 listings.
- 2025: Under Canvas received a USD 50 Million expansion investment to accelerate the development of new luxury glamping destinations and enhance existing property infrastructure.
Geopolitical Impact Analysis
Global trade tensions and persistent supply chain disruptions are raising the procurement cost of prefabricated glamping structures and off-grid energy components. According to WTO trade monitoring data, tariffs on steel, timber, and manufactured goods between major trading blocs increased by an average of 8% to 14% between 2023 and 2025, directly inflating the installed cost of cabin pods and modular accommodation units that rely on cross-border component sourcing. This means developers face a higher per-unit break-even rate, extending payback periods and increasing the minimum average daily rate required for project viability.
Based on World Bank commodity price indices, solar panel and battery storage costs, which underpin the off-grid energy systems glamping operators rely on for remote site development, experienced price volatility of 15% to 22% across 2024 driven by rare-earth material supply disruptions and shifting export controls from key producing nations. As reported by UNCTAD, shipping container freight rates on routes linking manufacturing hubs to North American and European destination markets fluctuated by over 30% in 2024. This logistics volatility extends procurement lead times for structure and equipment orders, adding schedule risk to site development timelines and raising the capital exposure window for operators planning new locations.
Report Scope
| Report Features | Description |
|---|---|
| Market Value (2025) | USD 3.4 Billion |
| Forecast Revenue (2035) | USD 8.5 Billion |
| CAGR (2026-2035) | 9.7% |
| Base Year for Estimation | 2025 |
| Historic Period | 2020-2024 |
| Forecast Period | 2026-2035 |
| Report Coverage | Revenue Forecast, Market Dynamics, Market Opportunity Analysis, Technology and Innovation Landscape, Competitive Landscape, Recent Developments |
| Segments Covered | By Accommodation (Cabins and Pods, Tents, Yurts, Treehouses, Others), By Age Group (18 to 32 Years, 33 to 50 Years, 51 to 65 Years, Above 65 Years), By Booking Mode (Direct Booking, Travel Agents, Online Travel Agencies), By Application (Family Travel, Couples’ Getaways, Solo Travel, Wellness Retreats, Others) |
| Regional Analysis | North America (US and Canada), Europe (Germany, France, The UK, Spain, Italy, and Rest of Europe), Asia Pacific (China, Japan, South Korea, India, Australia, and Rest of APAC), Latin America (Brazil, Mexico, and Rest of Latin America), Middle East and Africa (GCC, South Africa, and Rest of MEA) |
| Competitive Landscape | AutoCamp, Wigwam Holidays, Westgate River Ranch, Under Canvas, Terramor Outdoor Resort, Tanja Lagoon Camp, Postcard Cabins, Paws Up, Paperbark Camp, Huttopia, Firelight Camps, Conestoga Ranch, Collective Retreats, Camp Denali, Beckons Collection |
| Customization Scope | Customization for segments, region / country-level will be provided. Additional customization can be done based on requirements. |
| Purchase Options | We have three licenses to opt for: Single User License | Multi-User License (Up to 5 Users) | Corporate Use License (Unlimited User and Printable PDF) |





































