


Report Overview
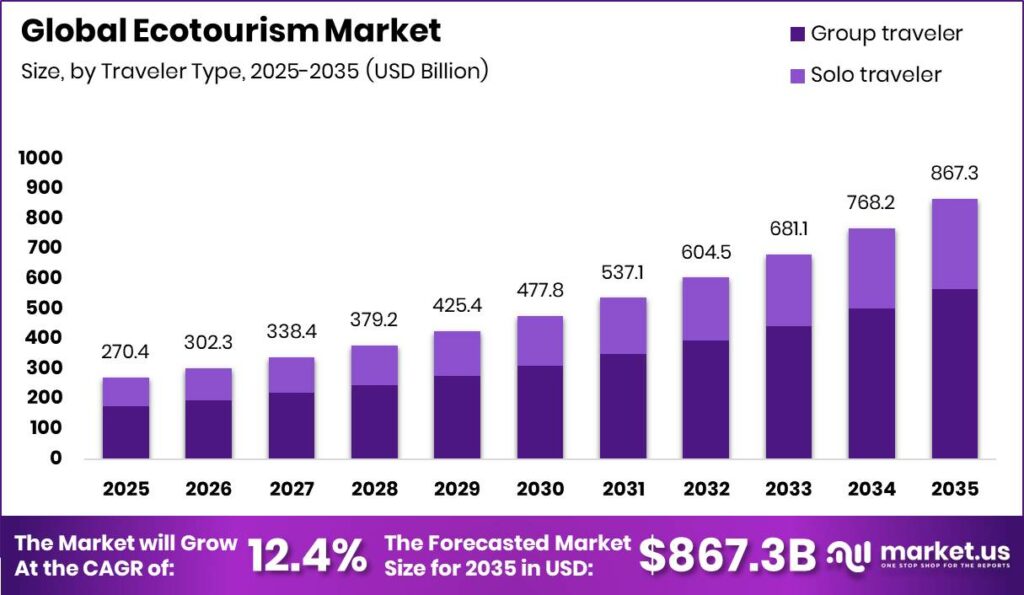
Global Ecotourism Market size is expected to be worth around USD 867.3 Billion by 2035 from USD 270.4 Billion in 2025, growing at a CAGR of 12.4% during the forecast period 2026 to 2035. This trajectory more than triples market value across ten years. Investors gain a clear runway to fund eco-lodge capacity, guided nature programs, and conservation-linked travel products before mainstream operators fully enter the space.
Sustainable Tourism anchors the ecotourism market, which packages responsible travel to natural areas with conservation funding and local benefit sharing. The market spans traveler type, age group, booking application, tourism format, and region. This means operators must design products around distinct buyer cohorts. Firms that segment offers by traveler intent and destination type will capture demand faster than generalist travel brands.
Key Takeaways
- Global Ecotourism Market will reach USD 867.3 Billion by 2035 from USD 270.4 Billion in 2025 at a CAGR of 12.4%.
- Group travelers dominate the By Traveler Type segment with a 65.2% share.
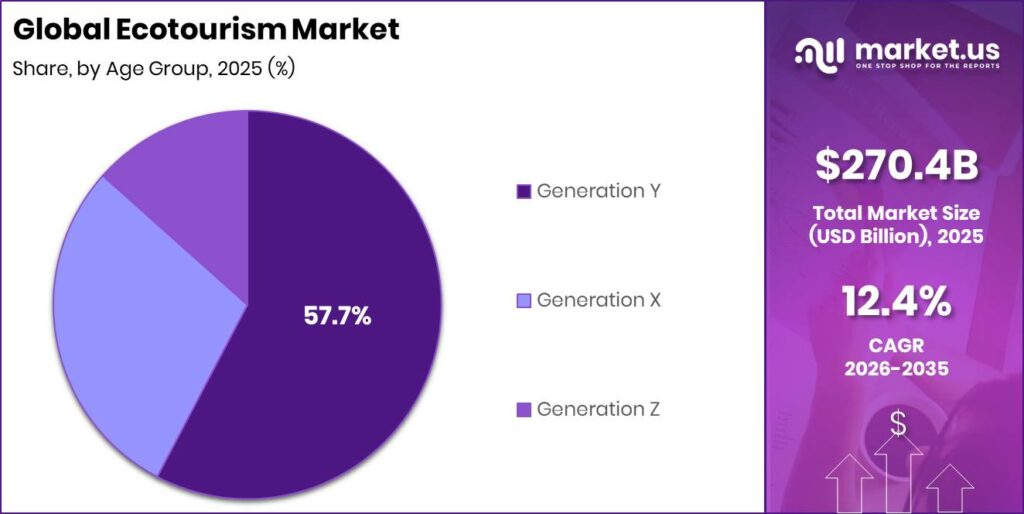
- Generation Y leads the By Age Group segment with a 57.7% share.
- Travel agents lead the By Application segment with a 55.4% share.
- Nature-based ecotourism leads the By Tourism segment with a 47.7% share.
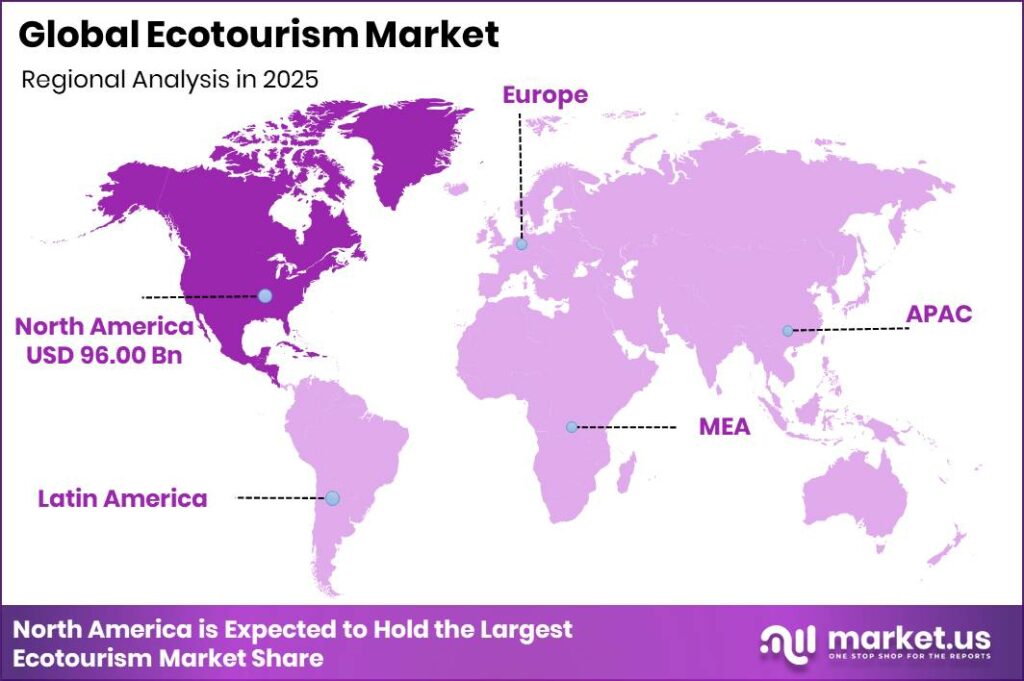
- North America dominates all regions with a 35.5% share, valued at USD 96.00 Billion.
Government conservation policy is expanding the destination base for ecotourism operators. The Protected Planet Report 2024 states that countries have committed to conserving 30% of Earth’s land and sea by 2030 under the Kunming Montreal Global Biodiversity Framework. This commitment creates new protected zones that anchor future ecotourism sites. Operators that secure early concession access in newly protected areas will lock in scarce, high-value locations.
Traveler intent now aligns tightly with conservation spending, which strengthens revenue reliability for operators. Booking.com’s 2025 research found that 69% of travelers want to leave places in better condition than they found them, while 73% want their spending to benefit local communities. This signals durable demand for benefit-sharing products. Operators that route visitor spend to local partners will win repeat bookings and referrals.
Willingness to pay confirms pricing power across the market. As reported by Gnedenko research, around 70% of ecotourism consumers will pay 10 to 15% more for accommodation that follows sustainable principles in 2025. This premium supports higher lodge margins. Volume recovery reinforces this. Data from UNWTO shows arrivals rose 11% in 2024, adding roughly 140 Million travelers, which widens the addressable base for eco-focused operators.
Traveler Type Analysis
Group traveler dominates with 65.2% due to shared guiding and safety cost efficiency.
In 2025, Group traveler held a dominant market position in the By Traveler Type segment of Ecotourism Market, with a 65.2% share. UNWTO recorded 1.4 Billion international arrivals in 2024, and organized tours capture a large share of nature travel volume. Group formats spread fixed guiding and permit costs across many travelers. This means operators protect margins while keeping per-person prices competitive against solo alternatives.
Solo travelers select ecotourism for flexible itineraries and personal connection with nature. This cohort ranks as the fastest-growing traveler type in the segment. World Bank research shows nature-based tourism drives about 8 Billion visits yearly to protected areas covering 17% of the world’s land. Solo demand rises as remote destinations open. Operators that build flexible single-traveler packages will capture this expanding, higher-margin niche.
Family and small mixed parties fill the remaining share within group formats. These buyers prioritize safety, structured activities, and educational value at natural sites. World Bank data indicates protected areas span 8% of the world’s ocean, widening marine ecotourism options. This creates room for coastal family programs. Operators bundling guided marine experiences with lodging will convert this steady, planning-heavy audience.
Age Group Analysis
Generation Y dominates with 57.7% due to peak earning and purpose-driven spending.
In 2025, Generation Y held a dominant market position in the By Age Group segment of Ecotourism Market, with a 57.7% share. This cohort now sits in peak earning years and directs discretionary income toward experiences. Nature-based tourism generates about USD 600 Billion in yearly revenue, roughly 7% of global tourism. Millennials drive much of this spend. Operators that market conservation impact will convert this high-value, purpose-led audience.
Generation X buyers bring higher household budgets and preference for premium comfort in natural settings. This cohort supports the upper end of eco-lodge pricing. World Bank figures show nature-based tourism draws about 8 Billion visits to protected areas annually. Older affluent travelers favor curated, low-effort itineraries. Operators offering premium guided programs will capture this margin-rich, comfort-seeking group.
Generation Z ranks as the fastest-growing cohort in the segment. These younger travelers prioritize authenticity, low-impact travel, and social proof. Nature-based tourism accounts for roughly 7% of global tourism activity, and this share climbs with younger entrants. Demand skews toward affordable, shareable experiences. Operators building entry-level eco-trips and digital-first booking will secure long-term loyalty from this rising base.
Application Analysis
Travel agent dominates with 55.4% due to complex permits and remote logistics coordination.
In 2025, Travel agent held a dominant market position in the By Application segment of Ecotourism Market, with a 55.4% share. Travel agents also rank as the fastest-growing application in the segment. Remote destinations require permits, transfers, and guiding that agents coordinate at scale. UNWTO recorded 1.4 Billion arrivals in 2024, sustaining strong agent booking volume. Agents that specialize in protected-area logistics will hold this dominant channel.
Direct booking channels serve travelers who research and reserve without intermediaries. This channel appeals to independent, digitally confident buyers. Nature-based tourism drives about 8 Billion annual visits to protected areas, and many are booked online. Direct channels reduce operator commission costs. Operators that invest in owned booking platforms will capture more margin per traveler and build direct customer relationships.
Tourism Analysis
Nature-based ecotourism dominates with 47.7% due to broad appeal and accessible destinations.
In 2025, Nature-based ecotourism held a dominant market position in the By Tourism segment of Ecotourism Market, with a 47.7% share. World Bank research shows nature-based tourism drives about 8 Billion visits yearly to protected areas. Broad appeal and widespread parks lower entry barriers for travelers. Operators near accessible protected zones will capture the largest, most reliable demand pool.
Adventure ecotourism ranks as the fastest-growing format in the segment. This category blends physical activity with natural immersion for active travelers. Nature-based tourism generates about USD 600 Billion in yearly revenue globally. Adventure buyers accept premium prices for guided, high-effort trips. Operators adding certified adventure programs will capture rising demand from experience-seeking cohorts.
Cultural and community-based ecotourism links travelers directly with local communities and traditions. This format channels spending toward host populations. World Bank data shows protected areas span 17% of the world’s land, supporting community-adjacent tourism. Voluntourism and conservation-focused travel hold the remaining share collectively, serving mission-driven travelers who fund direct restoration work. Operators building authentic community partnerships will differentiate against generic nature tours.
Key Market Segments
By Traveler Type
- Group traveler
- Solo traveler
By Age Group
- Generation Y
- Generation X
- Generation Z
By Application
- Travel agent
- Direct
By Tourism
- Nature-based ecotourism
- Adventure ecotourism
- Cultural & community-based ecotourism
- Voluntourism & conservation-focused travel
Regional Analysis
North America Dominates the Ecotourism Market with a Market Share of 35.5%, Valued at USD 96.00 Billion
North America leads the Ecotourism Market with a 35.5% share worth USD 96.00 Billion in 2025. High-income travelers, extensive national parks, and mature operators anchor this lead. Responsible Tourism gains traction across the region as consumers demand certified, low-impact travel. This means demand stays concentrated among affluent, informed buyers. Operators that hold certified inventory here will defend premium pricing and margin.
Asia Pacific ranks as the fastest-growing region in the market. Rising middle-class incomes and expanding protected areas widen the regional base. In June 2026, Intrepid Travel launched its Premium Family range with eight premium adventure trips across destinations including India, Sri Lanka, Vietnam, Thailand, and Borneo. This signals operator confidence in regional demand. Firms entering now will capture share before competition intensifies.
Europe, Latin America, and the Middle East and Africa hold the remaining regional share collectively. Europe brings strong sustainability regulation and eco-certified supply. Latin America offers biodiversity-rich destinations such as Costa Rica and Ecuador. This creates varied entry points across price tiers. Operators matching regional strengths to buyer intent will build balanced, diversified portfolios across these markets.
Key Regions and Countries
North America
- US
- Canada
Europe
- Germany
- France
- The UK
- Spain
- Italy
- Rest of Europe
Asia Pacific
- China
- Japan
- South Korea
- India
- Australia
- Rest of APAC
Latin America
- Brazil
- Mexico
- Rest of Latin America
Middle East and Africa
- GCC
- South Africa
- Rest of MEA
Market Dynamics
Market Opportunity Analysis - Fast-growing cohorts and emerging regions open early entry points for new players
Asia Pacific stands as the most underexploited region relative to its growth rate. The region ranks fastest-growing yet trails North America’s 35.5% share worth USD 96.00 Billion. This gap signals unmet supply against rising demand. New entrants that build certified inventory across Asia Pacific will capture share before established operators fully commit capacity there.
Generation Z remains underserved despite its fastest-growing status in the By Age Group segment. Current supply skews toward Generation Y, which holds 57.7% of the segment. This creates a product gap for affordable, digital-first eco-trips. Operators that design entry-level itineraries for younger travelers will lock in loyalty as this cohort’s spending power rises.
Adventure ecotourism is the underexploited format within the By Tourism segment. Nature-based ecotourism dominates at 47.7%, while adventure grows fastest. This means demand outpaces available guided adventure supply. New entrants that certify adventure programs and secure trained guides will fill this gap ahead of slower generalist operators.
Solo travel presents a further opening within the By Traveler Type segment. Group travel dominates at 65.2%, yet solo demand grows fastest. This reflects a supply bias toward group formats. Operators that build flexible single-traveler products will serve an expanding, higher-margin cohort that current inventory largely overlooks.
Technology and Innovation Landscape - Verified credits and digital booking reshape how operators earn and sell
Carbon and biodiversity credit verification is the defining innovation for operators. Measurement and reporting systems under Verra or Gold Standard protocols cost USD 50,000 to 300,000 per project. This technology turns protected land into a second revenue stream. Operators that adopt verified monitoring will unlock credit sales worth 15 to 35% of revenue on large concessions.
Digital platform integration with verified carbon offsets reshapes booking flows. This innovation carries a short-term execution window of two years or less. Platforms that embed offset purchase at checkout capture eco-conscious buyers directly. Operators partnering with these platforms will convert sustainability intent into completed bookings and stronger direct margins.
Social media discovery expands the addressable route map for operators. Instagram, TikTok, and YouTube drive destination discovery across all markets. This digital amplification lowers marketing costs for remote sites. Operators that build strong visual content pipelines will reach new travelers and open previously overlooked destinations to demand.
Drivers
The primary growth driver is a structural shift among high-income travelers, who now treat sustainability credentials and conservation contribution as core trip criteria rather than optional extras. IPCC reporting through 2021 and 2022 and national net-zero discourse through 2025 raised carbon awareness among affluent buyers. Market.us consumer research indicates about 69% of travelers want more sustainable options. This creates a durable premium demand base operators can monetize.
Willingness to pay converts this awareness into pricing power for certified operators. Roughly 34 to 38% of travelers earning above USD 100,000 accept premiums of 15 to 30% for certified experiences. Certified eco-lodges command USD 350 to 1,200 per night versus USD 80 to 250 for non-certified stays. This means certification acts as a revenue lever. Operators that certify early will capture higher margins and stronger booking conversion.
| Driver | (~) % Impact on CAGR Forecast | Geographic Relevance | Impact Timeline |
|---|---|---|---|
| Rising Climate Consciousness & Sustainable Travel Preference Among High-Income Traveller Segments | +3.80% | North America, Europe, Australia, Japan, South Korea | Short term (≤ 2 years) |
| Post-Pandemic Travel Recovery & Revenge Tourism Redirecting Demand Toward Experiential Nature-Based Formats | +2.90% | Global — led by North America, Europe, Asia Pacific | Short term (≤ 2 years) |
| Government Conservation & Biodiversity Policy Expanding Protected Area Tourism Infrastructure | +2.10% | Costa Rica, Kenya, Botswana, Bhutan, New Zealand, Ecuador | Medium term (2–4 years) |
| Millennial & Gen-Z Traveller Cohort Growth Prioritising Purpose-Driven & Low-Impact Travel | +1.85% | Global — most commercially active in North America, Europe, ANZ | Short term (≤ 2 years) |
| Corporate Sustainability Travel Policies Driving Business & MICE Segment Toward Eco-Certified Destinations | +1.10% | North America, Europe, GCC, Australia | Medium term (2–4 years) |
| Digital & Social Media Amplification of Remote & Untouched Destination Discovery Expanding Addressable Routes | +0.65% | Global — Instagram, TikTok, YouTube-driven discovery in all markets | Short term (≤ 2 years) |
Restraints
The root restraint is the tension between the ecotourism promise and the visitor volume its own success creates. Popular sites approach ecological carrying capacity, forcing hard visitor caps. The Galápagos National Park holds annual visitors near 270,000 to 330,000 despite far higher demand. This means top destinations sacrifice volume to protect ecosystems. Operators at capped sites face fixed revenue ceilings regardless of marketing spend.
Permit systems convert this constraint into a structural growth limit for operators. Bhutan charges a Sustainable Development Fee of USD 200 per person per day, raised from USD 65 in September 2022. A licensed eco-lodge with 20 to 40 rooms and an occupancy cap can only grow through price increases of 8 to 15% yearly. This sits below the 12.4% market CAGR. Operators must pursue new sites to grow beyond fixed capacity.
| Restraint | (~) % Impact on CAGR Forecast | Geographic Relevance | Impact Timeline |
|---|---|---|---|
| Overtourism & Carrying Capacity Enforcement Capping Visitor Numbers at Key Ecotourism Sites | -2.20% | Galapagos, Machu Picchu, Bali, Bhutan, Iceland, Palau, Costa Rica | Short term (≤ 2 years) |
| Long-Haul Air Travel Carbon Guilt & Flight-Shaming Suppressing Distant Destination Bookings | -1.50% | Northern Europe — most acute in Germany, Sweden, Netherlands | Short term (≤ 2 years) |
| Geopolitical Instability & Travel Advisories Restricting Access to Biodiverse Destination Countries | -1.00% | Sub-Saharan Africa, South & Southeast Asia, Latin America | Short term (≤ 2 years) |
| High Premium Pricing Limiting Ecotourism Accessibility to Affluent Traveller Segments Only | -0.65% | Global — demand-side constraint most acute in cost-sensitive source markets | Medium term (2–4 years) |
| Climate-Driven Ecosystem Degradation Reducing the Viability of Key Natural Attraction Assets | -0.42% | Coral reefs (GBR, Maldives), Amazon, Arctic, Alpine destinations | Medium term (2–4 years) |
Challenges
The core challenge is greenwashing, where operators use eco labels without verified certification. Most origin-market consumers cannot separate rigorous certified operators from marketing-only claims. The European Commission’s Green Claims Directive, proposed March 2023 and advancing through 2025 and 2026, will require third-party verification for sustainability claims. This creates a compliance opportunity. Certification bodies and audit firms can build new recurring revenue serving operators seeking verified status.
Credibility dilution compresses margins for legitimate operators today. When booking platforms list certified and non-certified stays together, premium capture drops from 25 to 45% to about 12 to 22% among non-specialist travelers. Annual audits cost USD 1,500 to 8,000 per property, adding 3 to 7% of revenue in ongoing burden. This opens a revenue stream for platforms offering verified badge tiers and consumer education tools.
| Challenge | (~) % CAGR Friction Drag | Geographic Relevance | Mitigation Horizon |
|---|---|---|---|
| Greenwashing & Certification Credibility Erosion | -1.80% | Global — most acute in OTA booking platforms | Long term (≥ 4 years) |
| Local Community Benefit Distribution Inequity | -1.40% | Sub-Saharan Africa, Latin America, Southeast Asia, Pacific Islands | Long term (≥ 4 years) |
| Skilled Naturalist & Eco-Guide Workforce Deficit | -0.90% | Sub-Saharan Africa, Latin America, South Asia, Pacific | Long term (≥ 4 years) |
| Infrastructure & Connectivity Gaps at Remote Destinations | -0.70% | Sub-Saharan Africa, Pacific Islands, Amazon Basin, Central Asia | Long term (≥ 4 years) |
| Extreme Weather Event Frequency Disrupting Seasonal Operations | -0.52% | Caribbean, Pacific Islands, Southeast Asia, East Africa | Medium term (2–4 years) |
Opportunities
The clearest opportunity is regenerative tourism, which monetizes conservation outcomes as a second revenue stream. Today’s dominant model only minimizes harm rather than generating verified credits. Operators can sell carbon credits at USD 5 to 50 per tonne for forestry and USD 80 to 200 per tonne for high-integrity REDD+ credits. This means lodges with large concessions can add income equal to 15 to 35% of revenue. Early movers will build durable dual-revenue models.
Verification infrastructure remains the barrier that keeps this white space open. Building measurement and reporting systems costs USD 50,000 to 300,000 per project under Verra or Gold Standard protocols. A deliberate 2 to 4 year build precedes commercial scale. This creates first-mover advantage. Operators that invest now can lift EBITDA margins from 20 to 32% toward 34 to 48% on qualifying conservation footprints.
| Opportunity | (~) % Potential CAGR Upside | Geographic Relevance | Execution Window |
|---|---|---|---|
| Regenerative Tourism Model Monetising Conservation Outcomes & Carbon Credit Co-Revenue | +2.60% | Africa, Latin America, Pacific Islands, Southeast Asia | Medium term (2–4 years) |
| Emerging Destination Development in Central Asia, South Asia & West Africa | +1.80% | Kazakhstan, Kyrgyzstan, Bhutan, Rwanda, Senegal, Ethiopia | Long term (≥ 4 years) |
| Wellness-Ecotourism Hybrid Experience Commanding Ultra-Premium Pricing | +1.35% | North America, Europe, GCC, Japan, Australia | Medium term (2–4 years) |
| Digital Platform & Verified Carbon Offset Integration for Eco-Conscious Booking | +0.90% | North America, Europe, Australia, Japan | Short term (≤ 2 years) |
| Science & Citizen Research Tourism Tapping Academic & Foundation Funding Streams | +0.58% | Galapagos, Amazon, Antarctic adjacent, Sub-Saharan Africa, Coral Triangle | Long term (≥ 4 years) |
Key Company Insights
Intrepid Travel positions itself around small-group, low-impact adventure travel that matches rising eco-intent. Booking research shows 84% of travelers said sustainability stayed important in 2025, supporting this focus. UNWTO recorded 1.4 Billion arrivals in 2024, a 99% recovery to 2019 levels, widening its base. This scale advantage lets Intrepid expand premium ranges. However, capped destinations limit how fast it can grow volume.
G Adventures Ltd. builds advantage through portfolio scale and route diversity. In January 2025, the firm launched over 300 new tours, lifting its portfolio above 1,000 trips across destinations including Pakistan and Panama. Gnedenko research shows 78% of tourists chose environmental destinations, reinforcing demand for this breadth. This wide network captures varied buyer intent. However, rapid expansion raises the risk of diluting certification and guiding quality.
Key Players
- Intrepid Travel
- G Adventures Ltd.
- Natural Habitat Adventures
- Lindblad Expeditions
- Wilderness Safaris
- Ecoventura (Galápagos small-ship ecotourism)
- TUI Group
- Marriott International Inc.
- Airbnb Inc.
- Responsible Travel Ltd.
- Rickshaw Travel Group
- Adventure Alternative Ltd.
- Aracari Travel
- Travel Leaders Group LLC
- Small World Journeys Pty Ltd.
- Others
Recent Developments
- September 2025: G Adventures and National Geographic Expeditions expanded their partnership by launching 14 new immersive small-group trips, including new destinations with departures beginning in 2026.
Geopolitical Impact Analysis
Global trade tensions are raising the cost of imported lodge equipment and vehicles that remote eco-operators depend on. According to WTO, merchandise trade growth slowed sharply as tariff measures spread, with new duties reaching 25% on many goods across major economies. UNCTAD reports container freight rates rose more than 30% on key long-haul routes during recent disruption. This means operators face higher fit-out and resupply costs, squeezing margins at isolated destinations.
Energy volatility and shipping reroutes directly affect fuel and logistics for nature-based tourism. As reported by IEA, oil price swings exceeded 20% during recent supply shocks, lifting charter and transfer costs. World Bank data shows freight rerouting around conflict zones added 10 to 14 days to some sailings. Therefore operators serving remote biodiverse regions face longer supply lead times and higher transport bills that they must absorb or pass to travelers.
Report Scope
| Report Features | Description |
|---|---|
| Market Value (2025) | USD 270.4 Billion |
| Forecast Revenue (2035) | USD 867.3 Billion |
| CAGR (2026-2035) | 12.4% |
| Base Year for Estimation | 2025 |
| Historic Period | 2020-2024 |
| Forecast Period | 2026-2035 |
| Report Coverage | Revenue Forecast, Market Dynamics, Market Opportunity Analysis, Technology and Innovation Landscape, Competitive Landscape, Recent Developments |
| Segments Covered | By Traveler Type (Group traveler, Solo traveler), By Age Group (Generation Y, Generation X, Generation Z), By Application (Travel agent, Direct), By Tourism (Nature-based ecotourism, Adventure ecotourism, Cultural & community-based ecotourism, Voluntourism & conservation-focused travel) |
| Regional Analysis | North America (US and Canada), Europe (Germany, France, The UK, Spain, Italy, and Rest of Europe), Asia Pacific (China, Japan, South Korea, India, Australia, and Rest of APAC), Latin America (Brazil, Mexico, and Rest of Latin America), Middle East and Africa (GCC, South Africa, and Rest of MEA) |
| Competitive Landscape | Intrepid Travel, G Adventures Ltd., Natural Habitat Adventures, Lindblad Expeditions, Wilderness Safaris, Ecoventura, TUI Group, Marriott International Inc., Airbnb Inc., Responsible Travel Ltd., Rickshaw Travel Group, Adventure Alternative Ltd., Aracari Travel, Travel Leaders Group LLC, Small World Journeys Pty Ltd., Others |
| Customization Scope | Customization for segments, region / country-level will be provided. Additional customization can be done based on requirements. |
| Purchase Options | We have three licenses to opt for: Single User License | Multi-User License (Up to 5 Users) | Corporate Use License (Unlimited User and Printable PDF) |





































