
Quick Navigation
Report Overview
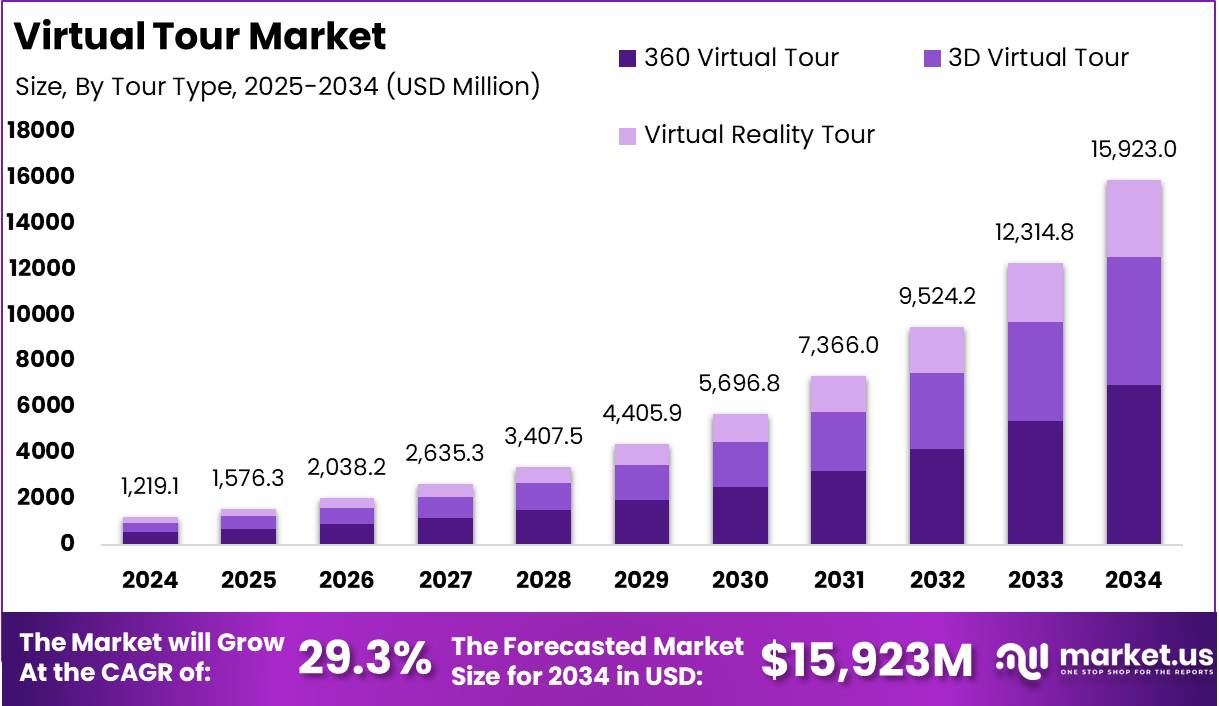
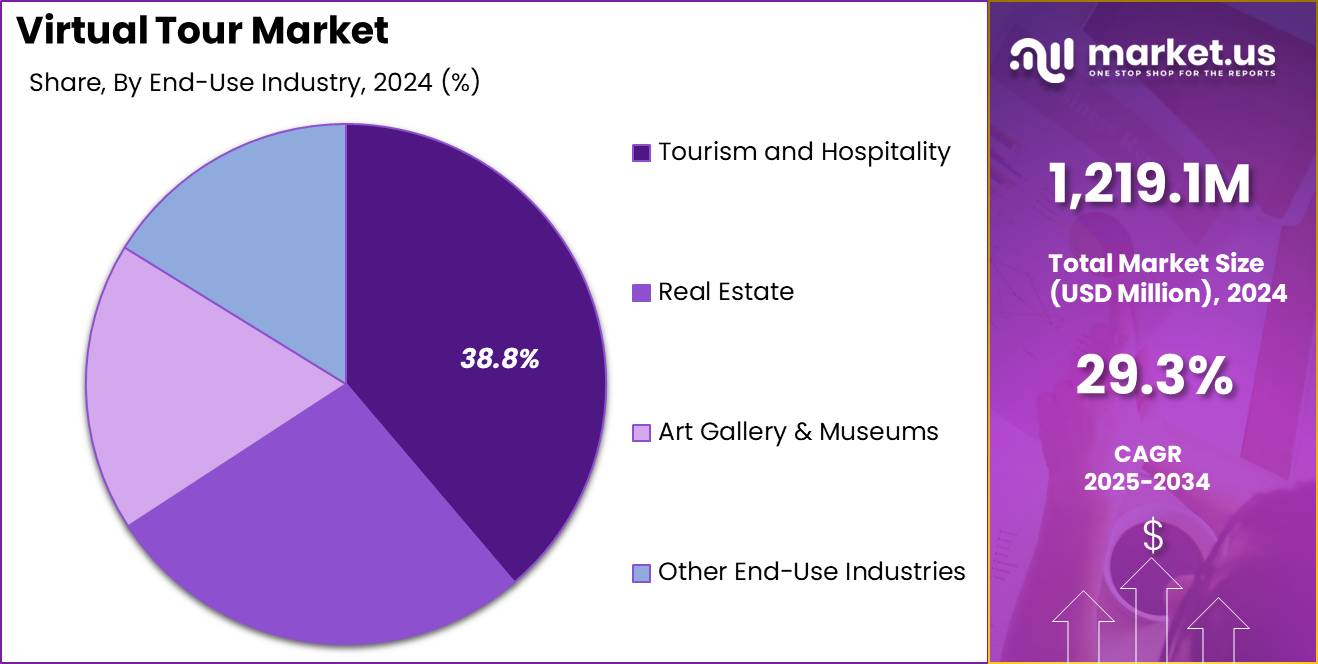
The Global Virtual Tour Market size is expected to be worth around USD 15,923.0 Million by 2034 from USD 1,219.1 Million in 2023, growing at a CAGR of 29.3% during the forecast period from 2025 to 2034. In 2024, North America held a dominant market position, capturing more than a 35.7% share, holding USD 435.2 Million revenue.
A virtual tour is a simulation of an existing location, usually composed of a sequence of videos or still images. It may also use other multimedia elements such as sound effects, music, narration, and text. The purpose of a virtual tour is to recreate the experience of visiting and navigating through a space remotely. These tours are often used for showcasing real estate properties, museums, historical sites, and other environments that might be of interest to remote viewers.
The virtual tour market encompasses the technologies and services involved in creating and distributing virtual tours across various industries. This market has expanded significantly with advancements in VR (Virtual Reality) and AR (Augmented Reality) technologies, making virtual tours more immersive and accessible. The sector includes a range of businesses, from software developers and camera manufacturers to content providers and digital marketing firms.
The growth of the virtual tour market is primarily driven by the increasing adoption of virtual reality and augmented reality technologies, which enhance the interactivity and realism of virtual tours. This trend is bolstered by the growing demand in sectors such as real estate, where virtual tours enable potential buyers to explore properties remotely, saving time and resources.
According to a global study by Kaltura, approximately 73% of participants expressed satisfaction with their virtual event experiences, indicating a strong consumer approval for this digital format. Additionally, the educational sector has seen a remarkable uptake in this technology, with virtual college tours increasing by 258%. This shift suggests that prospective students are now favoring online platforms for campus exploration over traditional visits.
The realm of online exhibits has witnessed an unprecedented surge in interest. Google reports a 4,106% increase in viewership for these digital showcases, demonstrating a robust appetite for virtual exploration of cultural and historical content. Furthermore, the USA Travel Association highlights that 68% of trip planners utilize online resources to discover activities, underscoring the pivotal role of virtual tours in modern travel planning.
Looking to the future, the trend towards digital engagement is expected to continue. Event organizers are increasingly incorporating virtual components into their offerings, with anticipated growth in virtual workshops, walking tours, and online exhibits. This ongoing integration points to a durable trend rather than a temporary shift, propelled initially by a 1,000% increase in virtual events in 2020 as noted by Forbes.
The demand for virtual engagement options remains high, with 84% of consumers desiring virtual alternatives for various events. This strong preference highlights the vast potential of virtual tours not only as a tool for exploration but also as a mainstream method for experiencing cities, museums, and exhibitions. As such, virtual tours are poised to remain a significant component of the event and tourism industries, offering expansive growth opportunities for providers in this market.
Key Takeaways
- The Virtual Tour Market is expected to reach approximately USD 15,923.0 million by 2034, with a remarkable Compound Annual Growth Rate (CAGR) of 29.3%. This signifies substantial growth opportunities within the industry.
- In 2024, 360 Virtual Tour Dominates the market offering immersive experiences with 43.9% market share.
- In 2024, the Tourism and Hospitality segment held a dominant market position in the Virtual Tour market, capturing more than a 38.8% share.
- North America is the most lucrative market, with a 35.7% market share, driven by advanced technology and a strong tourism industry.
- Europe holds a 30.5% share, followed by Latin America with 4.7%, Asia-Pacific with 26.8%, and the Middle East & Africa with 2.2%.
- Over 50% of adults have participated in a virtual tour, highlighting the widespread adoption of this technology in the real estate market.
- A substantial 67% of home buyers prefer listings that include a virtual tour, indicating a strong demand for this feature in real estate marketing.
- Businesses that incorporate virtual tours report an increase in bookings and conversion ratios by 16% to 67%, underscoring the significant impact of virtual tours on sales and customer engagement.
- Young adults aged 18 to 34 are 130% more likely to book a property if the listing includes a virtual tour, demonstrating the appeal of this technology to the millennial and Gen Z demographics.
- 50% of internet users utilize virtual tours in their decision-making process, showing the technology’s role in influencing consumer choices.
- Engagement with websites featuring virtual tours is 5 to 10 times higher compared to those without, indicating enhanced user interaction and longer engagement periods.
- 67% of consumers express a desire for more businesses to offer virtual tours, suggesting a market opportunity for increased adoption across various sectors.
- Daily global visits to virtual tours exceed 5 million, highlighting the extensive reach and popularity of this interactive tool.
- Virtual tours can double the interest in a business listing, effectively enhancing visibility and attracting more potential customers.
- The introduction of virtual tours has been shown to reduce wasted property viewings by 40%, improving efficiency in the real estate sector.
- 67% of customers are calling for a broader adoption of virtual tours across various industries, emphasizing the growing consumer demand.
- Listings on Google Maps that feature virtual tours witness 12% more engagement than those without, showcasing the benefits of virtual tours in enhancing online visibility and interaction.
North America Market Size
In 2024, North America held a dominant market position in the Virtual Tour Market, capturing more than a 33.7% share with revenues amounting to USD 435.2 million. This prominence is largely driven by a robust technological infrastructure and a high degree of digital literacy among its population. The region’s market leadership is further bolstered by the presence of key players in the virtual tour technology sphere, which continuously innovate and invest in new features and capabilities.
The market dominance in North America is also supported by substantial investments in virtual and augmented reality sectors, particularly in the United States and Canada, where there is a significant presence of tech giants and startups specializing in VR and AR solutions. These companies are constantly innovating and expanding the applications of virtual tours beyond traditional realms like real estate and tourism, into areas such as education, retail, and public services.
The region’s robust economic environment and the consumers’ willingness to engage with interactive and immersive digital experiences further fuel the growth of the virtual tour market. Moreover, the ongoing expansion of 5G networks across North America enhances the quality and accessibility of virtual tours, promising even greater market growth and consumer adoption in the coming years.
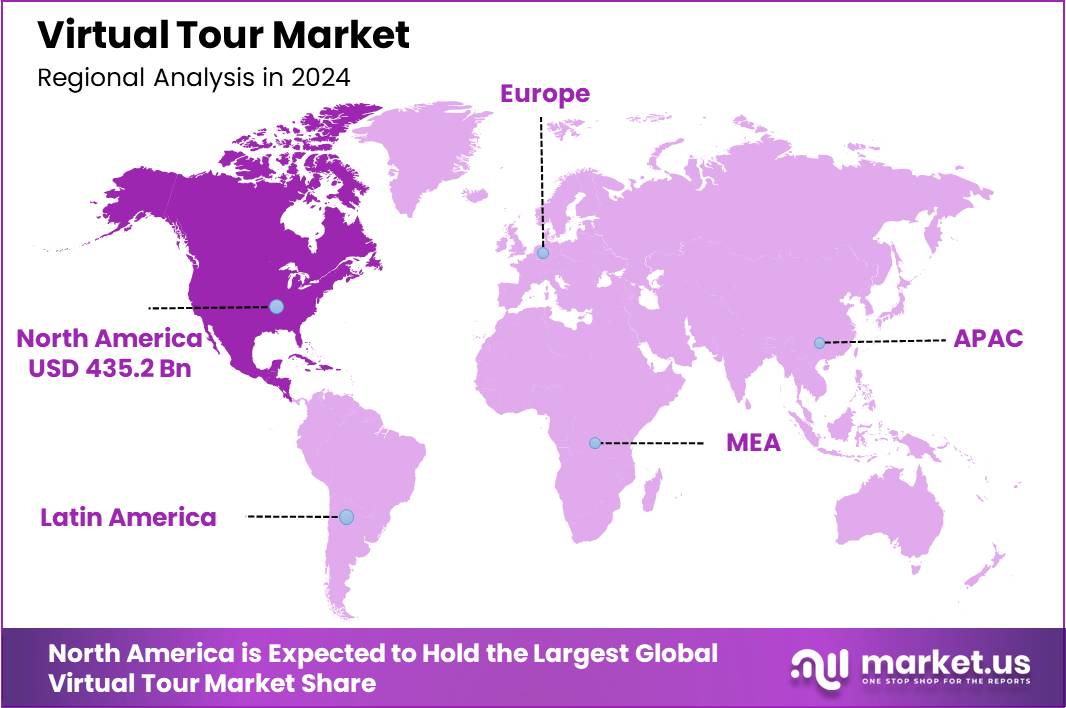
In Europe, the Virtual Tour Market claimed a significant 30.5% share in 2024. Europe’s robust performance is underpinned by its thriving tourism sector, which extensively employs virtual tours to enhance visitor experiences and accessibility to historic and cultural sites.
The Asia-Pacific region, although holding a smaller share of 26.8% in 2024, is poised for rapid expansion. This region benefits from the dynamic growth of technological adoption and an increasing appetite for innovative marketing strategies in countries like China, Japan, and South Korea.
Latin America captured a substantial 4.7% share of the Virtual Tour Market in 2024. This growth is driven by increasing digitalization across various sectors, including tourism and real estate, where virtual tours are becoming a valuable marketing tool.
The Middle East and Africa region, holding a 2.2% share, shows promise with its gradual yet steady adoption of virtual tour technologies. The growth in this market is primarily fueled by the tourism sector, particularly in countries like the UAE and South Africa, which are leveraging virtual reality to offer immersive experiences of historic and luxury destinations.
Virtual Tour Market Revenue, By Regional Analysis 2019-2024 (USD Million)
| Region | 2019 | 2020 | 2021 | 2022 | 2023 | 2024 |
|---|---|---|---|---|---|---|
| North America | 128.5 | 161.4 | 204.3 | 261.1 | 336.8 | 435.5 |
| Europe | 113.7 | 141.6 | 177.8 | 225.5 | 286.6 | 371.5 |
| Asia-Pacific | 92.7 | 117.4 | 149.9 | 193.2 | 253.0 | 327.3 |
| Latin America | 18.3 | 22.7 | 28.3 | 35.7 | 46.7 | 57.5 |
| Middle East & Africa | 9.2 | 11.3 | 14.0 | 17.4 | 22.1 | 27.4 |
Type Analysis
In 2024, the 360 Virtual Tour segment held a dominant market position, capturing more than a 43.9% share. This leadership can be attributed to several key factors.
Firstly, 360 Virtual Tours provide an immersive and interactive experience that closely replicates real-world environments. Users can navigate through spaces seamlessly, offering a comprehensive understanding of a location without the need for physical presence. This feature has proven particularly beneficial in industries such as real estate and tourism, where showcasing properties or destinations remotely has become essential.
Secondly, the technological accessibility of 360 Virtual Tours has contributed to their widespread adoption. These tours are compatible with various devices, including computers, tablets, and smartphones, without requiring specialized equipment. This ease of access ensures that a broad audience can engage with the content, enhancing user experience and engagement.
Virtual Tour Market Revenue, By Type Analysis, 2019-2024 (USD Million)
| Tour Type | 2019 | 2020 | 2021 | 2022 | 2023 | 2024 |
|---|---|---|---|---|---|---|
| 360 Virtual Tour | 159.0 | 199.4 | 252.0 | 321.8 | 414.5 | 535.6 |
| 3D Virtual Tour | 126.8 | 158.3 | 199.1 | 253.1 | 323.9 | 417.5 |
| Virtual Reality Tour | 76.6 | 96.7 | 123.1 | 158.2 | 206.7 | 266.0 |
Furthermore, the cost-effectiveness of 360 Virtual Tours has made them an attractive option for businesses. Developing these tours typically involves lower production costs compared to fully immersive virtual reality experiences, making them a practical choice for companies seeking to provide engaging content without significant financial investment.
End-Use Industry
In 2024, the Tourism and Hospitality segment held a dominant market position in the Virtual Tour Market, capturing more than a 38.8% share. This segment’s leading status can be attributed to several key factors.
First, the increasing demand for immersive travel experiences has significantly driven the adoption of virtual tours in this industry. Tourists and travelers are increasingly seeking virtual previews of destinations, accommodations, and attractions to aid in their travel planning.
Virtual tours provide a realistic sense of what they can expect, enhancing decision-making and boosting consumer confidence. Moreover, the growth of this segment is bolstered by technological advancements that have made virtual tours more interactive and user-friendly. With features such as 360-degree views, virtual reality (VR), and augmented reality (AR), these tours offer an engaging experience that effectively simulates physical presence in the location.
Virtual Tour Market Revenue, By End-Use Industry Analysis, 2019-2024 (USD Million)
| End-Use Industry | 2019 | 2020 | 2021 | 2022 | 2023 | 2024 |
|---|---|---|---|---|---|---|
| Real Estate | 96.4 | 121.0 | 153.1 | 195.7 | 251.9 | 326.4 |
| Art Gallery & Museums | 55.3 | 68.8 | 86.4 | 109.6 | 140.6 | 179.8 |
| Tourism and Hospitality | 136.0 | 171.7 | 218.4 | 280.7 | 365.4 | 472.7 |
| Other End-Use Industries | 74.7 | 92.8 | 116.2 | 147.1 | 187.3 | 240.3 |
The integration of these technologies helps businesses in tourism and hospitality not only to attract more customers but also to provide accessible previews from anywhere in the world, making it easier to reach a global audience. Furthermore, the COVID-19 pandemic has played a crucial role in accelerating the use of virtual tours within the tourism and hospitality industry.
Restrictions on travel and ongoing concerns about health and safety have made virtual tours an attractive alternative for exploring new locations. Establishments that offer comprehensive and engaging virtual tours are able to maintain customer interest and engagement even when physical visits are not possible, thus supporting continuity in marketing and customer interaction during challenging times.
Key Market Segments
Type
- 360 Virtual Tour
- 3D Virtual Tour
- Virtual Reality Tour
End-Use Industry
- Tourism and Hospitality
- Real Estate
- Art Gallery & Museums
- Other End-Use Industries
Key Regions and Countries
- North America
- US
- Canada
- Europe
- Germany
- France
- The UK
- Spain
- Italy
- Russia
- Netherlands
- Rest of Europe
- Asia Pacific
- China
- Japan
- South Korea
- India
- Australia
- Singapore
- Thailand
- Vietnam
- Rest of APAC
- Latin America
- Brazil
- Mexico
- Rest of Latin America
- Middle East & Africa
- South Africa
- Saudi Arabia
- UAE
- Rest of MEA
Driver
Sponsorship and Advertising Opportunities
The virtual tour market benefits significantly from the opportunities in sponsorships and advertising. Businesses can effectively promote their products and engage with a broader consumer base through virtual tours. This is particularly impactful in sectors like sports, real estate, and entertainment, where virtual tours offer immersive experiences that can lead to increased brand loyalty and consumer engagement. This adoption is driving the market forward by enhancing the visibility and reach of various brands.
Restraint
Limited Access to VR and AR Equipment
A major restraint for the virtual tour market is the limited access to necessary virtual reality (VR) and augmented reality (AR) technologies. High costs and limited availability of these technologies prevent widespread adoption, particularly in developing regions or among consumers with lower income. This lack of accessibility restricts the market’s potential reach, as not all potential users can afford or easily use VR/AR equipment, thus impacting the effectiveness of virtual tours as marketing tools.
Opportunity
Healthcare Sector Engagement
The healthcare sector presents a notable opportunity for the expansion of the virtual tour market. Virtual tours are increasingly being utilized for patient education and remote tours of medical facilities. These applications allow patients and their families to familiarize themselves with healthcare environments from the comfort of their homes, potentially reducing pre-visit anxiety and improving overall patient experience. Moreover, virtual tours serve as effective marketing tools for healthcare facilities, helping them to stand out in a competitive market by showcasing their facilities and services remotely
Challenge
Technological Complexity and User Experience
The complexity of VR/AR technologies poses a significant challenge. Users not only need to afford these technologies but also require technical knowledge to operate them effectively. The learning curve associated with these technologies can deter potential users, hampering market growth. Overcoming these usability challenges is crucial for expanding the market reach and ensuring that virtual tours can be a viable option for a broader audience.
Growth Factors
The virtual tour market is primarily driven by advancements in virtual reality (VR) and augmented reality (AR) technologies, which have significantly improved the quality and accessibility of virtual tours. These technological enhancements make virtual experiences more immersive and engaging, contributing to the market’s growth. Additionally, the integration of artificial intelligence (AI) and machine learning into virtual tour platforms is enhancing personalization and interactivity, further boosting user engagement and market expansion.
Emerging Trends
One of the key emerging trends in the virtual tour market is the increasing integration of VR, AR, and mixed reality (MR) technologies, which are enhancing the user experience by making virtual tours more lifelike and interactive. The use of these technologies is expanding beyond traditional sectors like real estate and tourism to include education, healthcare, and even cultural sectors. There is also a notable trend towards cloud-based virtual tour solutions, which offer scalability and accessibility, allowing users to access virtual tours from any device and location.
Top Use Cases
- Real Estate: Virtual tours allow potential buyers to explore properties remotely, providing a realistic and immersive viewing experience without the need to physically visit the sites. This application has become particularly valuable in the real estate market, especially in the wake of the COVID-19 pandemic.
- Tourism: Virtual tourism has gained significant traction, with users being able to virtually visit and explore tourist destinations around the world. This includes virtual walks through historical sites, museums, and even entire cities, making tourism accessible to those who cannot travel physically.
- Education: In the educational sector, virtual tours are used to simulate historical events, scientific concepts, and more, providing students with an interactive and engaging learning environment. They are also used for virtual campus tours, helping prospective students and their families explore university facilities from afar.
Key Players Analysis
To expand the various businesses in foreign markets, emerging key players are concentrating on a range of strategic policies. The strategic policies help provide a competitive advantage. The virtual tour market is a highly competitive and rapidly evolving area, with several players offering a range of solutions to meet the needs of businesses and individuals alike. Though demand for virtual tours continues to grow, new players will likely enter the market and existing players will continue to innovate and improve their offerings.
Listed below are some of the most prominent virtual tour industry players.
- The Ricoh Company
- Matterport
- Pan 3Sixty Ltd.
- Klapty
- Kuula
- 3DVista
- Invision Studio
- TourWizard
- Exsight 360
- Blue Raven Studios
Recent Developments
- Exsight 360 (Philippines) has continued to expand its portfolio of virtual tours, with significant launches catering to the real estate and hospitality sectors. In early 2023, they launched new virtual tours for prominent properties such as the Filinvest Cyberzone Cebu and SM North Towers.
- 360 Imagery has seen growth through partnerships and product enhancements. In late 2023, they partnered with various real estate agencies in Europe to deliver customized virtual tour solutions that integrate with existing property management systems. This move is aligned with the growing trend of integrating virtual tours with booking and reservation systems to streamline customer experiences
- RealTourVision launched a new subscription-based pricing model in July 2023. This flexible pricing structure is particularly beneficial for real estate agents and brokers, allowing them to choose plans that align with their specific needs and budget, thereby making virtual tours more accessible and cost-effective for professionals in the industry.
Report Scope
| Report Features | Description |
|---|---|
| Market Value (2024) | USD 1,219.1 Mn |
| Forecast Revenue (2034) | USD 15,923 Mn |
| CAGR (2025-2034) | 29.3% |
| Base Year for Estimation | 2024 |
| Historic Period | 2020-2023 |
| Forecast Period | 2025-2034 |
| Report Coverage | Revenue forecast, AI impact on market trends, Share Insights, Company ranking, competitive landscape, Recent Developments, Market Dynamics and Emerging Trends |
| Segments Covered | By Type (360 Virtual Tour, 3D Virtual Tour, and Virtual Reality Tour), By Industry Vertical (Real Estate, Art Gallery & Museums, Tourism and Hospitality, Other End-Use Industries) |
| Regional Analysis | North America – US, Canada; Europe – Germany, France, The UK, Spain, Italy, Russia, Netherlands, Rest of Europe; Asia Pacific – China, Japan, South Korea, India, New Zealand, Singapore, Thailand, Vietnam, Rest of APAC; Latin America – Brazil, Mexico, Rest of Latin America; Middle East & Africa – South Africa, Saudi Arabia, UAE, Rest of MEA |
| Competitive Landscape | SeekBeak, 360 Imagery, Exsight 360, Invision Studio Inc., Blue Raven Studios, Starts360, Eye Revolution Ltd, RealTourVision, Other Key Players |
| Customization Scope | Customization for segments, region/country-level will be provided. Moreover, additional customization can be done based on the requirements. |
| Purchase Options | We have three licenses to opt for Single User License, Multi-User License (Up to 5 Users), Corporate Use License (Unlimited User and Printable PDF) |
Frequently Asked Questions (FAQ)
The Virtual Tour market involves the creation and distribution of digital experiences that allow users to explore locations, properties, or environments virtually. These tours are often interactive and provide 360-degree views, enabling users to navigate through spaces as if they were physically present.
The Global Virtual Tour Market size is expected to be worth around USD 12,345.5 Million by 2033 from USD 945.2 Million in 2023, growing at a CAGR of 29.3% during the forecast period from 2023 to 2032.
Key factors include the growing demand for immersive experiences, advancements in VR and AR technologies, the increasing use of virtual tours in real estate, tourism, and education, and the need for remote engagement solutions due to global travel restrictions.
Current trends include the integration of AI to personalize virtual tours, the use of 360-degree video content, the rise of interactive and live-guided virtual tours, and the adoption of virtual tours by museums, hotels, and educational institutions.
Technologies used include 360-degree photography, 3D modeling, virtual reality (VR), augmented reality (AR), and artificial intelligence (AI) for enhancing user interaction and experience. Many virtual tours are also optimized for mobile devices and web browsers.
Challenges include high development costs, the need for specialized equipment and skills, and potential limitations in user accessibility due to technology requirements. Additionally, creating high-quality, realistic virtual tours can be time-consuming.


