
Quick Navigation
Report Overview
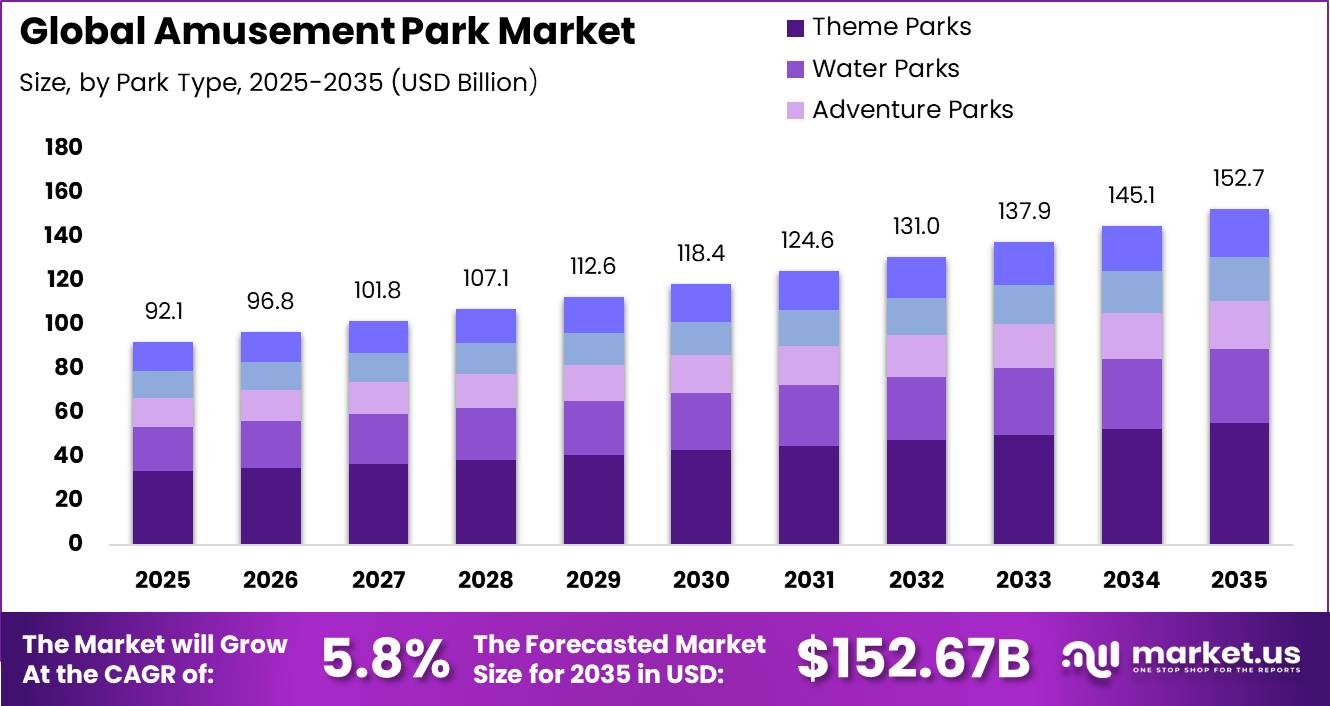
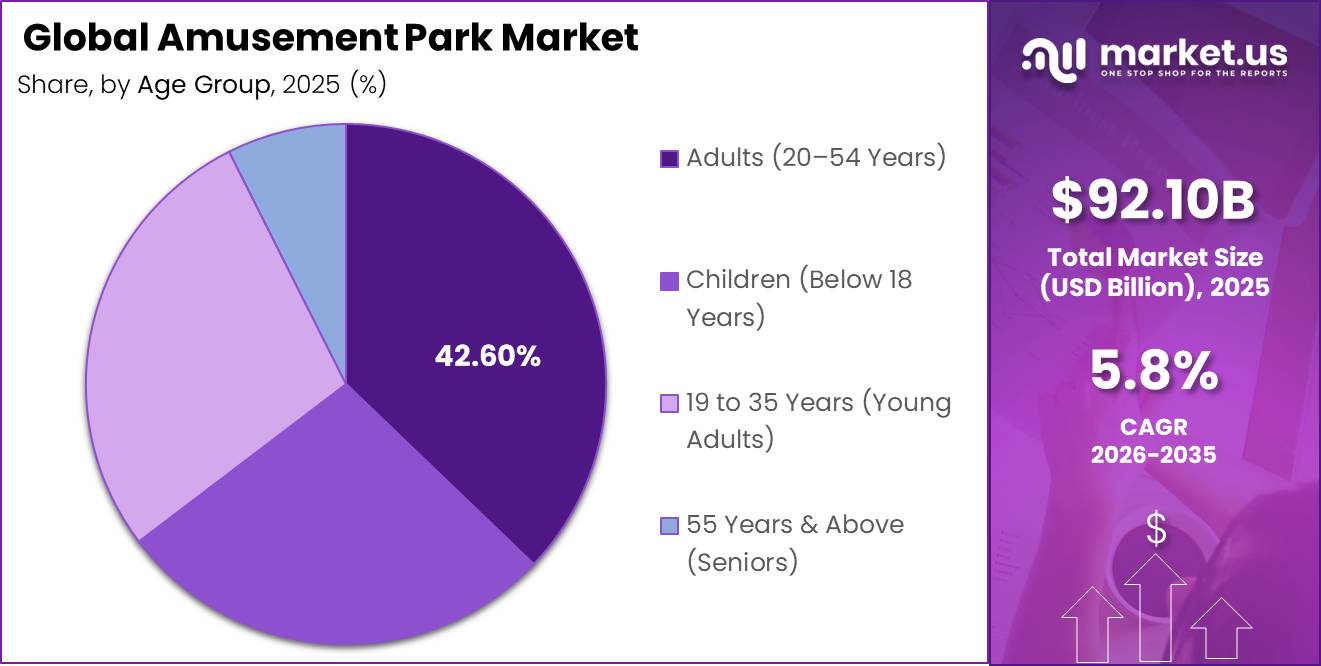
Global Amusement Park Market size is expected to be worth around USD 152.67 Billion by 2035 from USD 92.10 Billion in 2025, growing at a CAGR of 5.8% during the forecast period 2026 to 2035. This trajectory places the market among the largest segments in global experiential leisure, attracting sustained capital from operators, developers, and institutional investors worldwide.
The amusement park market spans theme parks, water parks, adventure parks, and zoo-based attractions. Operators generate revenue through gate tickets, in-park food and merchandise, lodging, and annual pass programs. The market serves a broad visitor base including families, tourists, corporate groups, and school trips, with park formats ranging from large destination resorts to regional and urban entertainment venues.
Key Takeaways
- Global Amusement Park Market was valued at USD 92.10 Billion in 2025 and is forecast to reach USD 152.67 Billion by 2035.
- The market grows at a CAGR of 5.8% from 2026 to 2035.
- Theme Parks dominate the By Park Type segment with a 36.20% share.
- Mechanical / Thrill Rides dominate the By Ride Type segment with a 45.30% share.
- Adults (20–54 Years) dominate the By Age Group segment with a 42.60% share.
- Tourists dominate the By Target Audience / Visitor Type segment with a 52.00% share.
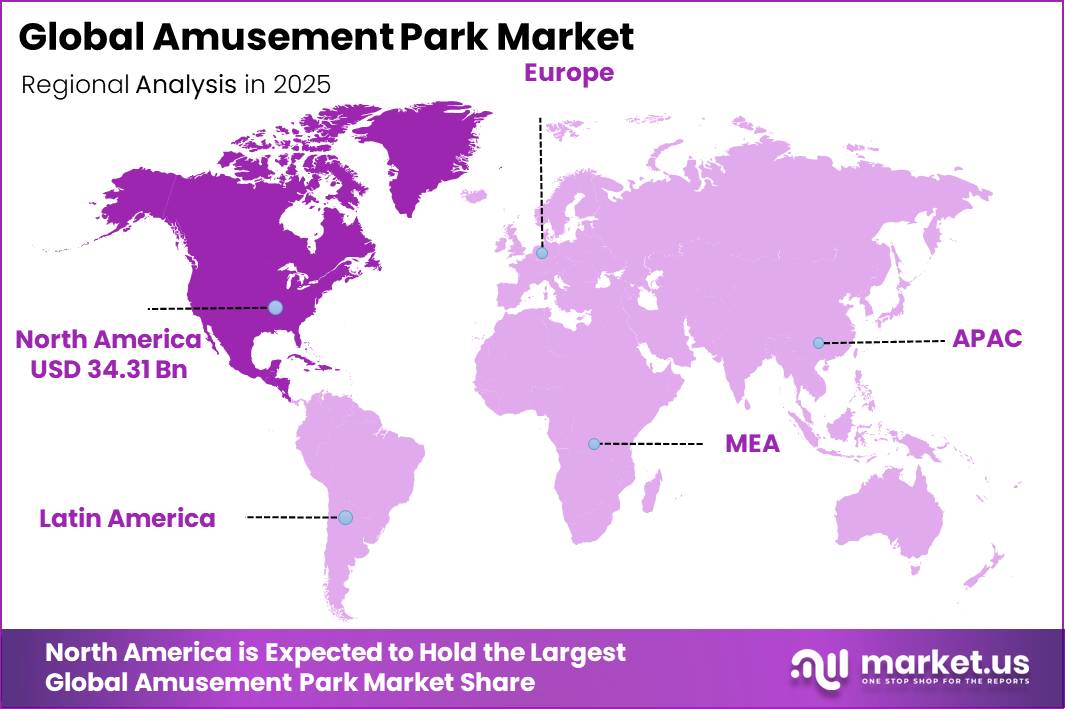
- North America dominates the regional landscape with a 37.26% share, valued at USD 34.31 Billion.
Government-backed tourism infrastructure and integrated entertainment zone approvals are active pipeline accelerators across Asia-Pacific and the Middle East. These policy frameworks reduce permitting risk for large-scale park projects. Investors tracking greenfield development timelines should monitor regulatory calendars in Southeast Asia and the GCC, where approvals directly trigger capital deployment decisions.
As per our research, attendance density reached 21.0 million guests in a single quarterly reporting period during the post-merger peak quarter of 2025. This figure signals that consolidated multi-park operators can generate institutional-scale visitation volume within a single earnings window. Operators with diversified park portfolios are better positioned to smooth seasonal attendance variability across the calendar year.
IAAPA Expo 2025 drew 28,598 qualified buyers across 20,316 buying companies, reflecting a large and active procurement ecosystem surrounding amusement park operations. This scale of buyer participation signals strong commercial activity across ride manufacturing, technology, food service, and safety compliance supply chains. Vendors entering this market can access a concentrated buyer base through a single annual trade event.
Type Analysis
Theme Parks dominate with 36.20% due to large-scale IP-driven destination appeal.
In 2025, Theme Parks held a dominant market position in the By Park Type segment of the Amusement Park Market, with a 36.20% share. Franchise intellectual property and immersive storytelling environments drive repeat visitation and premium ticket pricing. Operators investing in branded world-building within theme parks extract higher per-guest revenue than any other park format in this segment.
Water Parks captured 22.00% of the By Park Type segment, supported by family-oriented appeal and summer attendance concentration. Their relatively lower construction cost compared to theme parks makes them attractive for regional operators. Water parks also serve as anchor components within integrated resort models targeting short-haul family travel.
Others accounted for 14.30%, while Adventure Parks held 14.50% of this segment. Adventure Parks benefit from rising appetite for physical and outdoor recreational experiences among younger urban visitors. Zoo Parks and Animal Attractions held 13.00%, rounding out a segment where theme park dominance shapes capital allocation priorities across the industry.
Ride Type Analysis
Mechanical / Thrill Rides dominate with 45.30% due to core visitor demand for high-intensity experiences.
In 2025, Mechanical / Thrill Rides held a dominant market position in the By Ride Type segment of the Amusement Park Market, with a 45.30% share. This segment includes roller coasters, drop towers, and free-fall rides that anchor park layouts and define brand identity for major operators. Parks that invest in new thrill ride installations consistently generate earned media attention that drives first-visit ticket sales. As per our research, Six Flags operated 2,573 operating days in Q3 2025, reflecting strong capacity utilization directly tied to the draw of mechanical ride assets.
Water Rides occupy the second tier in this segment, supporting family repeat visits and providing throughput relief during peak park hours. Their strategic placement allows operators to serve mixed-age groups within a single visit. Water rides also reduce per-visitor wait time pressure that mechanical thrill rides generate during high-attendance days.
Virtual / Technology-Based Rides represent the fastest-moving sub-segment, encompassing VR roller coasters, 4D/5D motion simulators, and augmented reality attractions. As per our research, operating-day reduction of 779 versus 878 days, a decline of 11%, in Q4 2025 shows that weather-dependent ride formats lose capacity during off-peak calendar windows. Virtual rides offer operators a weather-insulated attendance option, reducing revenue volatility linked to seasonal and climate disruptions. Mild / Family Rides complete the segment, serving the under-18 and senior visitor cohorts that anchor weekday and school-holiday attendance.
Age Group Analysis
Adults (20–54 Years) dominate with 42.60% due to higher spending power and multi-visit decision authority.
In 2025, Adults (20–54 Years) held a dominant market position in the By Age Group segment of the Amusement Park Market, with a 42.60% share. This cohort controls household leisure budgets and drives annual pass purchases, group bookings, and premium experience upgrades. Operators who design loyalty programs and tiered membership products around this group capture the highest lifetime revenue per visitor.
Young Adults aged 19 to 35 held a 32.00% share, making them the second-largest cohort by age. This group drives demand for immersive and technology-enhanced experiences, including VR attractions and narrative-themed environments. Their social media behavior amplifies organic reach for parks that invest in visually distinctive and shareable installations.
Children below 18 years held a 31.50% share, forming the primary reason families visit parks and influencing adult companion spending decisions. Seniors aged 55 and above held 8.50%, representing the smallest cohort but an underserved growth segment as aging populations in North America and Europe retain higher discretionary incomes and shorter travel windows.
Target Audience / Visitor Type Analysis
Tourists dominate with 52.00% due to destination-linked multi-day spending patterns.
In 2025, Tourists held a dominant market position in the By Target Audience / Visitor Type segment of the Amusement Park Market, with a 52.00% share. Tourist visitors generate higher per-visit revenue through multi-day tickets, on-site hotel stays, and full-day food and merchandise spend. Parks positioned within international gateway cities or resort corridors disproportionately benefit from this visitor profile. This segment includes both domestic tourists and international tourists who plan park visits as primary trip destinations.
Families represent the second core visitor group, driving group ticket purchases, stroller-friendly infrastructure demand, and food court revenue across all park formats. Family visitors are the primary audience for water parks and mild ride categories. Their visit decisions are heavily influenced by proximity, value perception, and age-appropriate attraction variety. Teenagers and Adventure Seekers, Corporate Clients, and School and College Groups complete the visitor mix, providing operators with diversified booking channels across leisure, MICE, and educational travel demand.
Key Market Segments
By Park Type
- Theme Parks
- Water Parks
- Adventure Parks
- Zoo Parks & Animal Attractions
- Others
By Ride Type
- Mechanical / Thrill Rides
- Roller coasters (steel & wooden)
- Drop towers & free-fall rides
- Others
- Water Rides
- Mild / Family Rides
- Virtual / Technology-Based Rides
- VR roller coasters
- 4D/5D motion simulators
- Augmented reality (AR) attractions
By Age Group
- Children (Below 18 Years)
- 19 to 35 Years (Young Adults)
- Adults (20–54 Years)
- 55 Years & Above (Seniors)
By Target Audience / Visitor Type
- Tourists
- Domestic tourists
- International tourists
- Families
- Teenagers & Adventure Seekers
- Corporate Clients (team outings, MICE events)
- School & College Groups
Regional Analysis
North America Dominates the Amusement Park Market with a Market Share of 37.26%, Valued at USD 34.31 Billion
North America commands 37.26% of the global amusement park market, valued at USD 34.31 Billion in 2025. The region benefits from a dense concentration of large destination resorts, a mature annual pass consumer base, and strong domestic travel demand. These structural advantages allow North American operators to sustain high occupancy rates and capture premium in-park spending across both urban and resort-corridor park formats. In June 2025, Universal Studios Hollywood confirmed Fast and Furious: Hollywood Drift, an outdoor roller coaster reaching 72 mph, set to open in 2026 as the fastest coaster in the Universal Destinations portfolio, reinforcing North America’s position as a lead market for marquee ride investment.
Europe represents the second major regional bloc, anchored by a network of heritage theme parks and a high-volume inbound tourism base. European parks benefit from strong domestic travel infrastructure and multi-country visitor flows across key tourism corridors. However, urban land constraints and stricter zoning requirements raise development costs for new greenfield attractions in Western European markets.
Asia Pacific is the highest-potential growth region, driven by government-backed entertainment district approvals and a rising urban middle class with increasing leisure budgets. China remains the largest single-country growth node, supported by expanded visa-free transit programs that widen the inbound international visitor pool for parks in Shanghai, Beijing, and broader East Asia.
Key Regions and Countries
North America
- US
- Canada
Europe
- Germany
- France
- The UK
- Spain
- Italy
- Rest of Europe
Asia Pacific
- China
- Japan
- South Korea
- India
- Australia
- Rest of APAC
Latin America
- Brazil
- Mexico
- Rest of Latin America
Middle East and Africa
- GCC
- South Africa
- Rest of MEA
Drivers
International tourist arrivals reached 1.4 billion in 2024, up 11% from 2023 and equal to 99% of pre-pandemic levels, according to UN Tourism. A further 5% increase followed in the first half of 2025, with 2% growth recorded in Q1 2026. Europe alone reached 793 million international tourists in 2025, up 4% year over year. International guests book earlier, stay longer, and spend more on multi-day tickets, hotels, and merchandise. This behavior improves revenue mix for destination parks even when local discretionary demand softens.
China’s expanded 240-hour visa-free transit regime and broader visa exemptions widen the addressable inbound visitor pool for major Chinese attractions. Parks in Shanghai, Beijing, and broader East Asia convert this policy shift into higher occupancy and stronger shoulder-season visitation. Operators positioned near major transit hubs in China directly benefit from this structural change in cross-border visitor access.
| Driver | (~) % Impact on CAGR Forecast | Geographic Relevance | Impact Timeline |
|---|---|---|---|
| Destination-scale expansion and new gate openings | +1.6% | North America core, East Asia growth nodes, Middle East pipeline | Medium term (2-4 years) |
| International tourism normalization and visa easing | +1.2% | EU, North America gateway parks, China, Japan, Southeast Asia | Short term (≤ 2 years) |
| Yield management and in-park monetization uplift | +1.0% | North America core, Western Europe, Japan, China tier-1 resorts | Short term (≤ 2 years) |
| Resort integration: hotels, multi-day stays, bundled spend | +0.9% | Orlando corridor, China destination resorts, EU leisure hubs, GCC projects | Medium term (2-4 years) |
| Portfolio consolidation and capex discipline | +0.7% | North America regional parks, selective EU operators | Medium term (2-4 years) |
| IP-led experiential refresh and repeat visitation | +0.8% | Global destination parks, especially US, Japan, China | Short term (≤ 2 years) |
Restraints
Consumer price sensitivity is the most immediate demand-side restraint across the amusement park market. IAAPA described 2025 North American attendance as “lackluster,” documented mid-season discounting, and reported lower in-park guest spending once visitors entered. Families shortened trip durations and delayed ticket purchases as they responded to inflation and value offers. This behavior compresses realized revenue growth for mid-tier operators below nominal projections.
In practical terms, a 2% to 4% attendance shortfall combined with 1% to 2% weaker in-park spend converts a nominal 4.5% to 5.0% revenue-growth case into a 3.4% to 3.9% realized outcome for mid-tier operators. Regional parks face higher exposure than destination resorts because they lack lodging capture and premium upsell infrastructure. This gap widens the performance divergence between large integrated operators and smaller standalone park businesses.
| Restraint | (~) % Impact on CAGR Forecast | Geographic Relevance | Impact Timeline |
|---|---|---|---|
| Price-sensitive demand | -1.1% | North America core, EU, LatAm urban belts | Short term (≤ 2 years) |
| Weather volatility | -0.9% | North America, China, LatAm, island tourism markets | Medium term (2-4 years) |
| Ride CapEx inflation | -1.0% | North America regional parks, EU, APAC import corridors | Medium term (2-4 years) |
| Tariff-led sourcing shock | -0.7% | U.S. core, Mexico, China-linked supply chains | Short term (≤ 2 years) |
| Labor cost escalation | -0.8% | U.S., Western Europe, GCC growth hubs | Medium term (2-4 years) |
| Attendance maturity at top parks | -0.6% | North America flagship parks, Japan, Western Europe | Long term (≥ 4 years) |
Challenges
A persistent labor shortage challenges amusement park operations across North America and Europe. Between 2022 and 2025, vacancy rates for critical operational roles remained 8 to 12% above pre-pandemic levels. Seasonal staffing shortages of 10 to 20% continued into the 2026 hiring cycle despite wage increases of 8 to 15% in many markets. These gaps directly reduce throughput capacity and revenue capture during peak attendance periods.
Recruitment timelines extended from 30 to 45 days to 60 to 90 days as qualified applicant pools for mechatronics technicians and safety engineers tightened. Overtime for specialized technical staff reaches 1.3 to 1.5 times standard pay rates, compressing operating margins. Training cohorts meet only 50 to 60% of replacement demand in some markets, meaning the skills deficit will constrain operational capacity and limit new ride throughput for the medium term.
| Challenge | (~) % CAGR Friction Drag | Geographic Relevance | Mitigation Horizon |
|---|---|---|---|
| Challenge | (~) % CAGR Friction Drag | Geographic Relevance | Mitigation Horizon |
| Capital-intensive build cycle inflation | -1.4% | North America, Western Europe, urban APAC hubs | Long term (≥ 4 years) |
| Skilled safety & ops labor gaps | -1.1% | North America core, Western Europe, GCC leisure clusters | Medium term (2-4 years) |
| Aging ride assets & capex backlog | -0.9% | North America legacy parks, Europe mature sites, Japan | Long term (≥ 4 years) |
| Volatile tourism & climate-linked seasonality | -0.8% | EU tourism corridors, coastal Asia, Florida–Caribbean belt | Medium term (2-4 years) |
| Insurance, liability & security escalation | -0.7% | US litigation-heavy states, EU regulatory hubs | Long term (≥ 4 years) |
| Digital engagement and IP monetization gap | -0.6% | Emerging APAC, Latin America, mid-tier regional parks | Medium term (2-4 years) |
Opportunities
Converting day-trip parks into multi-night destination assets through hotels, indoor water attractions, and bundled ticketing represents the most capital-efficient growth lever available to mid-size operators. Moving even 8 to 12% of annual visitors into one-night packages can increase total guest spend by 35 to 60% and lift EBITDA margin by 250 to 450 basis points through room and ancillary revenue mix. Comcast confirmed that Epic Universe already drives longer stays, higher per-capita spending, and stronger hotel demand in Orlando.
For operators with 2 million to 5 million annual visits, the addressable revenue from resort conversion ranges from USD 80 million to USD 250 million in incremental annual revenue. This conversion potential supports a +1.6 percentage-point CAGR uplift where land banks and destination access already exist. IAAPA identified overnight lodging near attractions as a revenue opportunity in 2025, and Great Wolf’s Connecticut opening with a USD 300 million investment and 500,000 projected annual visitors confirms that lodging-plus-indoor recreation models unlock demand that gate-only operations leave uncaptured.
| Opportunity | (~) % Potential CAGR Upside | Geographic Relevance | Execution Window |
|---|---|---|---|
| Destination resort lodging | +1.6% | North America core, GCC, China, Japan | Short term (≤ 2 years) |
| Licensed park-light expansion | +1.3% | GCC, Southeast Asia, India | Medium term (2-4 years) |
| Indoor micro-park rollouts | +1.8% | APAC emerging, Middle East, urban EU | Short term (≤ 2 years) |
| Dynamic yield monetization | +0.9% | North America, EU, Japan | Short term (≤ 2 years) |
| Health-wellness adjacencies | +0.7% | North America, EU resorts, GCC | Medium term (2-4 years) |
| Regional roll-up and M&A | +1.4% | North America, Europe, Latin America | Medium term (2-4 years) |
Key Company Insights
Walt Disney Parks and Resorts commands the highest structural premium in global amusement through IP-led destination parks and integrated resort economics. Disney’s Abu Dhabi park structure signals a deliberate expansion into GCC markets, where sovereign tourism mandates reduce development risk. However, the company’s high per-capital expenditure model creates exposure when consumer discretionary confidence softens in core North American and European markets.
Six Flags Entertainment Corporation recorded 47.388 million total attendance in FY 2025, demonstrating large-scale demand recovery across its regional park portfolio. Per capita guest spending reached USD 61.90 in FY 2025, reflecting strong in-park monetization through combined ticket, food, and merchandise revenue. In November 2025, Six Flags announced a capital investment program exceeding USD 1 billion over 2025 to 2026 to fund new rides, themed lands, and infrastructure upgrades across its 42-park portfolio, signaling an aggressive capacity expansion cycle.
Key Players
- Walt Disney Parks & Resorts
- Universal Destinations & Experiences
- Merlin Entertainments Group
- Six Flags Entertainment Corporation
- Chimelong Group Co., Ltd.
- OCT Parks China (Overseas Chinese Town)
- Fantawild Holdings Inc.
- SeaWorld Parks & Entertainment
- Compagnie des Alpes (CDA)
- Parques Reunidos Servicios Centrales S.A.
- Europa-Park GmbH & Co Mack KG
- Haichang Ocean Park Holdings
- IMG Worlds of Adventure
- Lotte World Co., Ltd.
- Efteling B.V.
Recent Developments
- May 2025 – Universal Orlando Resort officially opened Universal Epic Universe, a new theme park featuring five immersive worlds including SUPER NINTENDO WORLD and Wizarding World expansions, marking one of the largest single park openings in industry history.
Report Scope
| Report Features | Description |
|---|---|
| Market Value (2025) | USD 92.10 Billion |
| Forecast Revenue (2035) | USD 152.67 Billion |
| CAGR (2026-2035) | 5.8% |
| Base Year for Estimation | 2025 |
| Historic Period | 2020-2024 |
| Forecast Period | 2026-2035 |
| Report Coverage | Revenue Forecast, Market Dynamics, Market Opportunity Analysis, Technology and Innovation Landscape, Competitive Landscape, Recent Developments |
| Segments Covered | By Park Type (Theme Parks, Water Parks, Adventure Parks, Zoo Parks & Animal Attractions, Others); By Ride Type (Mechanical / Thrill Rides, Water Rides, Mild / Family Rides, Virtual / Technology-Based Rides); By Age Group (Children Below 18 Years, 19 to 35 Years Young Adults, Adults 20 to 54 Years, 55 Years and Above Seniors); By Target Audience / Visitor Type (Tourists, Families, Teenagers and Adventure Seekers, Corporate Clients, School and College Groups) |
| Regional Analysis | North America (US and Canada), Europe (Germany, France, The UK, Spain, Italy, and Rest of Europe), Asia Pacific (China, Japan, South Korea, India, Australia, and Rest of APAC), Latin America (Brazil, Mexico, and Rest of Latin America), Middle East and Africa (GCC, South Africa, and Rest of MEA) |
| Competitive Landscape | Walt Disney Parks & Resorts (Disney Experiences), Universal Destinations & Experiences (Comcast / NBCUniversal), Merlin Entertainments Group, Six Flags Entertainment Corporation, Chimelong Group Co. Ltd., OCT Parks China (Overseas Chinese Town), Fantawild Holdings Inc., SeaWorld Parks & Entertainment, Compagnie des Alpes (CDA), Parques Reunidos Servicios Centrales S.A., Europa-Park GmbH & Co Mack KG, Haichang Ocean Park Holdings, IMG Worlds of Adventure, Lotte World Co. Ltd., Efteling B.V. |
| Customization Scope | Customization for segments, region/country-level will be provided. Additional customization can be done based on requirements. |
| Purchase Options | We have three licenses to opt for: Single User License, Multi-User License (Up to 5 Users), Corporate Use License (Unlimited User and Printable PDF) |


