


Report Overview
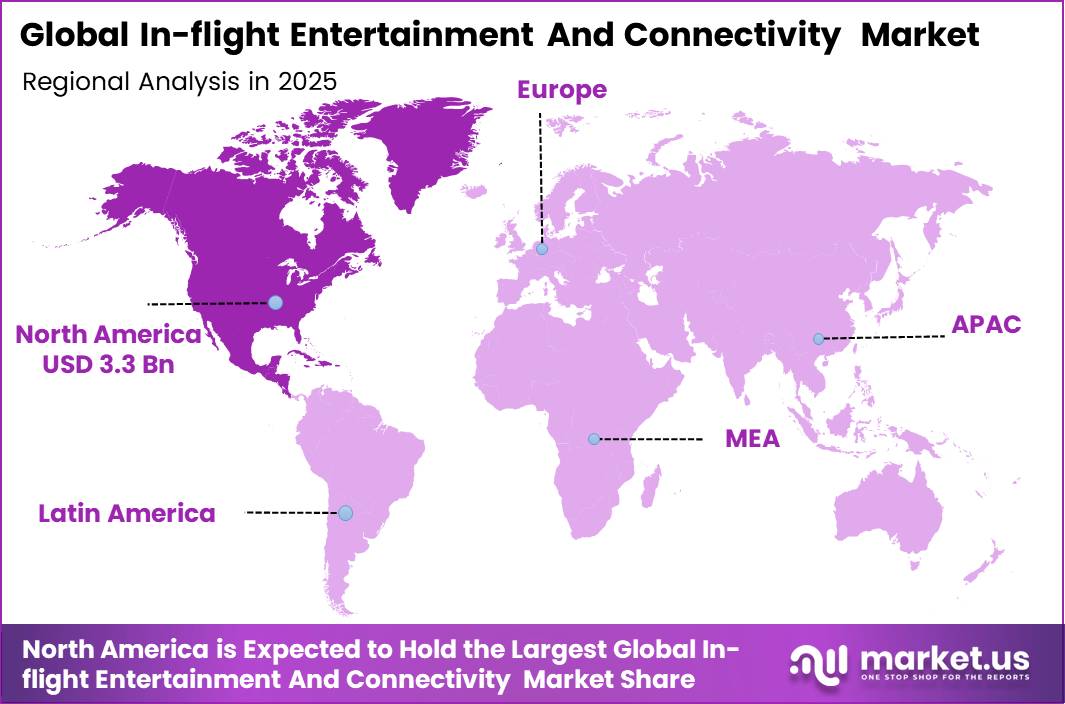
In 2025, the Global Inflight Entertainment And Connectivity Market was valued at USD 8.5 billion. The market is projected to grow at a CAGR of 8.7% during 2026–2035, reaching approximately USD 19.6 billion by 2035. North America dominated the global market in 2025, accounting for more than 39.2% of the total market share and generating approximately USD 3.3 billion in revenue.
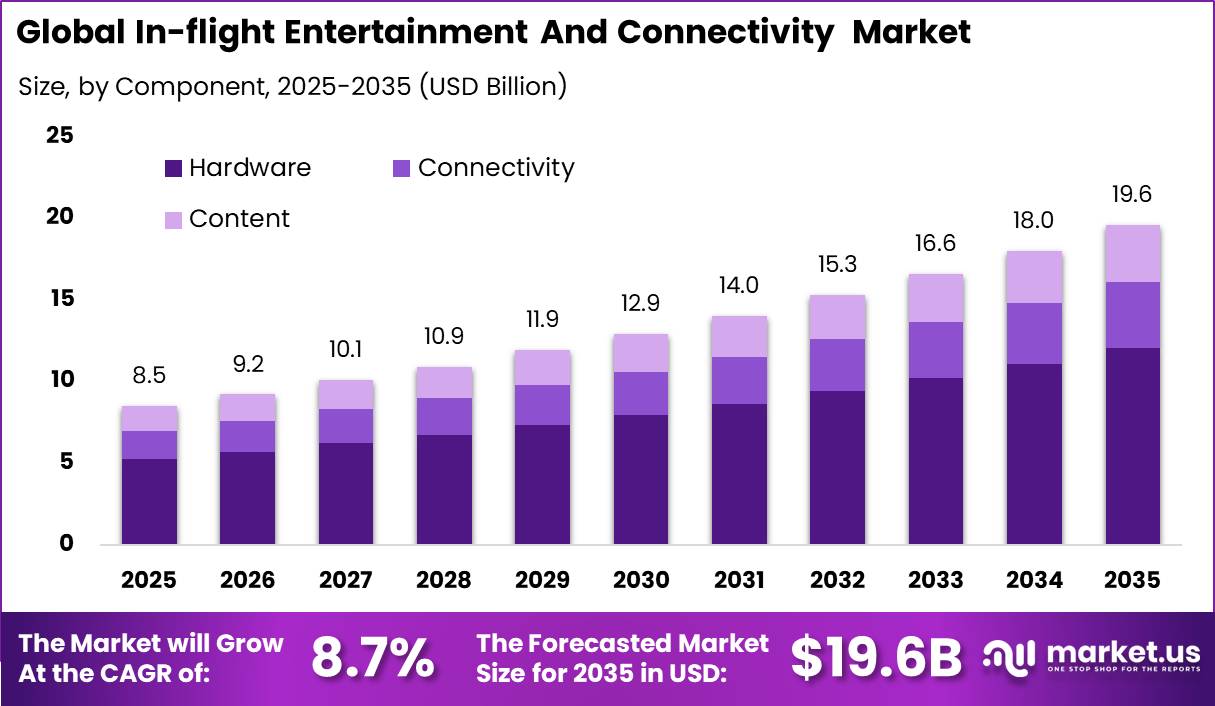
Market growth is strongly supported by rising global air passenger traffic and increasing demand for onboard Wi-Fi, streaming, messaging, seatback entertainment, and other digital services. According to the International Civil Aviation Organization (ICAO), global passenger traffic was estimated at 9.8 billion passengers in 2025, representing an increase of 3.7% from the previous year.
The U.S. Federal Aviation Administration estimated 976.3 million passenger enplanements in 2025. It also expects system revenue passenger miles to increase by 2.8% per year between 2025 and 2045. Fleet expansion provides additional market opportunities, as Boeing projects North America will receive 8,680 commercial aircraft during 2025–2044, increasing the regional fleet to 10,475 aircraft by 2044.
Key Takeaway
- The Global Inflight Entertainment And Connectivity Market was valued at USD 8.5 billion in 2025 and is projected to reach USD 19.6 billion by 2035 at a CAGR of 8.7%.
- Hardware led the component segment with a 61.4% share, driven by equipment demand across the global fleet.
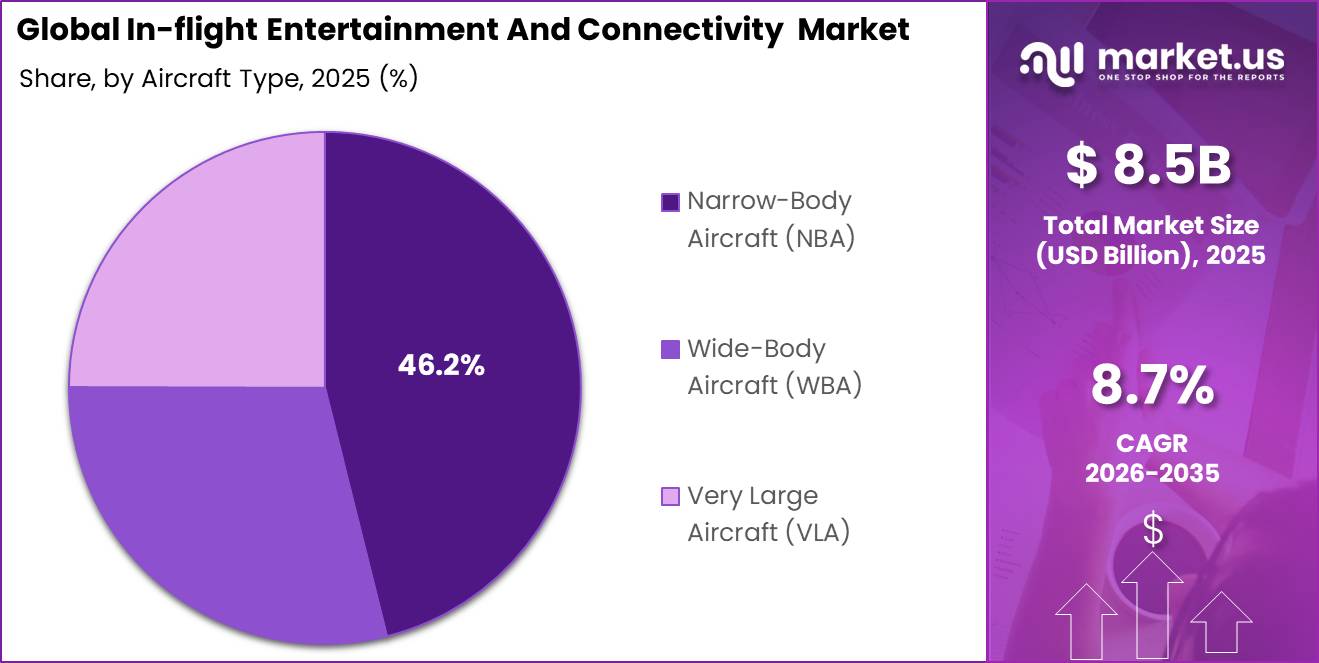
- Narrow-body aircraft led the aircraft-type segment with a 46.2% share, supported by high-frequency regional operations.
- Inflight entertainment (IFE) led the offering-type segment with a 67.2% share, supported by rising international air travel.
- North America led the market with a 39.2% share, generating approximately USD 3.3 billion in revenue in 2025.
By Component
Hardware dominated the Inflight entertainment and connectivity market with a 61.4% share, supported by the high equipment requirement for every connected aircraft. Airlines need physical systems such as seatback displays, cabin servers, wireless access points, antennas, modems, satellite terminals, wiring, power units, and mounting equipment to provide onboard entertainment and internet services.
The large global aircraft fleet continues to create steady demand for new installations, replacements, and upgrades. According to the International Air Transport Association, the global commercial fleet included 35,550 aircraft in June 2025, of which 30,300 aircraft were active. Airbus delivered 793 commercial aircraft to 91 customers in 2025, while its total order backlog reached 8,754 aircraft.
These deliveries create opportunities for factory-installed connectivity systems as well as future retrofit programs. Aircraft utilization also remains high, with IATA recording 10.8 million Boeing 737 flights and 8.7 million Airbus A320 flights during 2025. Frequent aircraft operations increase equipment usage and accelerate technology replacement needs.
By Aircraft Type
Narrow-body aircraft dominated the Inflight entertainment and connectivity market with a 46.2% share, mainly because these aircraft serve high-volume domestic and regional routes. Their frequent daily operations create a large passenger base for onboard Wi-Fi, messaging, streaming, and wireless entertainment services.
The strong narrow-body aircraft delivery outlook further supports the segment’s leading position. Airbus forecasts demand for 34,250 single-aisle passenger aircraft during 2025–2044, accounting for nearly 79% of its projected 43,420 new commercial aircraft deliveries. Boeing also expects 33,285 single-aisle aircraft deliveries during 2025–2044, compared with 7,815 widebody aircraft.
This large delivery pipeline will increase demand for antennas, modems, cabin wireless networks, servers, and passenger connectivity systems. Narrow-body aircraft are also being increasingly deployed on longer regional routes, where passengers expect reliable internet and access to digital services.
By Offering Type
Inflight Entertainment (IFE) dominated the Inflight entertainment and connectivity market with a 67.2% share, supported by its strong role in improving the onboard passenger experience. IFE systems provide access to movies, television programs, music, games, and flight-tracking services without requiring passengers to depend entirely on personal data plans or continuous satellite connectivity.
Growing international air travel continues to strengthen demand for onboard entertainment. According to UN Tourism, international tourist arrivals reached 1.5 billion in 2025, representing 60 million more arrivals than in 2024. The expanding number of travelers increases the audience for digital entertainment during flights, particularly on longer international journeys.
Eurostat also reported 1.1 billion air passengers in the European Union in 2024, an increase of 8.3% year over year. This high passenger volume encourages airlines to maintain and upgrade entertainment systems across their fleets. A single certified IFE platform can serve passengers across multiple seats, support airline branding, strengthen premium cabin services, and provide additional advertising opportunities.
Key Market Segments
By Component
- Hardware
- Connectivity
- Content
By Aircraft Type
- Narrow-Body Aircraft (NBA)
- Wide-Body Aircraft (WBA)
- Very Large Aircraft (VLA)
By Offering Type
- Inflight Entertainment (IFE)
- Inflight Connectivity (IFC)
Geopolitical Impact Analysis
Geopolitical disruptions are increasing supply-chain costs and delivery risks for the Inflight Entertainment and Connectivity (IFEC) market. IFEC systems depend on globally sourced components such as semiconductors, display panels, cabin servers, antennas, modems, satellite terminals, wiring harnesses, and aircraft-grade electronics.
According to UNCTAD, disruption in the Red Sea reduced Suez Canal transits by 42% from their peak and added around 12 sailing days to Shanghai–Rotterdam shipments, increasing transit time by nearly 30%. Longer shipping routes also reduced effective global container capacity by about 9%.
For IFEC suppliers transporting Asian-made electronics to aircraft manufacturing and maintenance locations in Europe and North America, these conditions can raise freight expenses, extend inventory requirements, delay retrofit kits, and increase the risk of aircraft waiting for critical components.
Trade-policy uncertainty is creating additional pressure. The WTO projected global merchandise trade volumes could decline by 0.2% in 2025 under existing tariff conditions, nearly 3 percentage points below a low-tariff scenario. Trade volumes could fall by as much as 1.5% if tariffs and policy uncertainty expand further.
Energy-price volatility can also affect airline investment decisions. The World Bank estimated that a 2 million-barrel-per-day oil supply disruption could increase Brent crude prices to USD 92 per barrel, compared with a USD 73 baseline, while the 2025 average could reach USD 84. Higher fuel expenses may delay cabin upgrades, while increasing demand for lighter and more energy-efficient IFEC equipment.
Regional Analysis
North America dominated the global in-flight entertainment and connectivity market in 2025, capturing 39.2% of total revenue and reaching an estimated value of USD 3.3 billion. The region benefits from a large commercial aircraft fleet, strong passenger spending, intense competition among airlines, and early adoption of onboard digital services.
U.S. airlines operate extensive domestic and international networks where passengers increasingly expect Wi-Fi, streaming, messaging, live television, and seatback entertainment. According to the U.S. Bureau of Transportation Statistics, U.S. air carriers recorded nearly 977.8 million revenue passenger enplanements during the 12 months through April 2025.
Asia-Pacific is expected to be the fastest-growing regional market, supported by rising airline capacity, airport development, increasing middle-class travel, and wider digital adoption. Airports Council International Asia-Pacific forecasts regional passenger traffic to grow by 4.8% annually during 2025–2028, while Southern Asia is projected to expand by 6.3% annually.
International traffic in Eastern Asia is expected to rise by 6.6% annually. Hong Kong International Airport handled 61 million passengers in 2025, increasing 15% year over year, while flight movements grew 8.7% to 394,730. These trends are encouraging airlines to invest in onboard Wi-Fi, satellite connectivity, wireless streaming, cabin servers, and localized entertainment content.
Key Regions and Countries
North America
- US
- Canada
Europe
- Germany
- France
- The UK
- Spain
- Italy
- Rest of Europe
Asia Pacific
- China
- Japan
- South Korea
- India
- Australia
- Rest of APAC
Latin America
- Brazil
- Mexico
- Rest of Latin America
Middle East & Africa
- GCC
- South Africa
- Rest of MEA
Market Dynamics
Drivers
| Driver | (~) % Impact on CAGR Forecast | Geographic Relevance | Impact Timeline |
|---|---|---|---|
| Fleet renewal demand | +1.4% | Global | Medium term (2 to 4 years) |
| Premium-cabin differentiation | +1.1% | North America, Europe, Middle East | Short term (2 years or less) |
| Passenger digital expectations | +1.0% | Global | Short term (2 years or less) |
| Ancillary revenue integration | +0.8% | North America, Asia-Pacific | Medium term (2 to 4 years) |
| Line-fit connectivity adoption | +0.7% | Global | Medium term (2 to 4 years) |
Fleet renewal demand
Fleet renewal is the largest active growth engine because connected-cabin equipment is increasingly specified at aircraft delivery rather than purchased only through later retrofits. Airbus delivered 793 commercial aircraft in 2025, according to Airbus, while its forecast identifies demand for 34,250 single-aisle aircraft during 2025–2044.
IATA reported a global commercial fleet of 35,550 aircraft in June 2025, including 30,300 active units, which expands the installed base eligible for upgrade cycles. ICAO estimated global passenger traffic at 9.8 billion in 2025, reinforcing airline incentives to bundle connectivity, content, and digital commerce into the passenger proposition.
The result is a shift from standalone hardware sales toward longer-duration equipment, bandwidth, software, and maintenance relationships, supporting an estimated +1.4% incremental contribution to the 8.7% baseline CAGR.
Restraints
| Restraint | (~) % Impact on CAGR Forecast | Geographic Relevance | Impact Timeline |
|---|---|---|---|
| Airline capital-allocation pressure | -1.2% | Global, acute among low-cost carriers | Short term (2 years or less) |
| High retrofit certification cost | -0.9% | Global | Medium term (2 to 4 years) |
| Cabin weight trade-offs | -0.6% | Global | Medium term (2 to 4 years) |
| Content-rights fragmentation | -0.5% | Asia-Pacific, Middle East, Africa | Short term (2 years or less) |
| Uneven airline profitability | -0.4% | Latin America, Africa, Asia-Pacific | Short term (2 years or less) |
Airline capital-allocation pressure
Airline capital-allocation pressure is the principal near-term restraint because IFEC upgrades compete directly with fleet, engine, safety, and operating-cost priorities. IATA’s 2025 industry outlook indicated a net profit margin of only 3.7%, leaving limited room for discretionary cabin capital expenditure when aircraft are already exposed to fuel and maintenance volatility.
The World Bank’s conflict-risk scenario showed that Brent crude could reach USD 92 per barrel following a 2 million-barrel-per-day supply disruption, compared with a baseline near USD 73 per barrel; this raises airline operating costs and can delay non-essential retrofits. Meanwhile, the FAA forecasts U.S. system enplanements to expand at an average 2.5% annually through 2045, but this demand growth does not eliminate short-cycle cash constraints
Challenges
| Challenge | (~) % CAGR Friction Drag | Geographic Relevance | Mitigation Horizon |
|---|---|---|---|
| Electronic component logistics | -0.9% | Global | Medium term (2 to 4 years) |
| Multi-orbit network integration | -0.7% | Global | Medium term (2 to 4 years) |
| Cybersecurity assurance burden | -0.6% | Global | Long term (4 years or more) |
| Aircraft downtime scheduling | -0.5% | Global | Short term (2 years or less) |
| Spectrum coordination complexity | -0.4% | Global | Long term (4 years or more) |
Electronic component logistics
Electronic component logistics remain the largest structural friction because IFEC systems combine semiconductors, displays, antennas, modems, power units, and aircraft-qualified wiring sourced across multiple regions.
UNCTAD reported that Suez Canal transits were 57% below their previous peak by mid-October 2024, while Panama Canal transits were 55% lower; these disruptions lengthen the movement of Asian electronics and European aerospace subassemblies.
UNCTAD also noted that the Suez Canal normally handles about 10% of world maritime trade by volume and 22% of containerized trade, making rerouting material for time-sensitive avionics shipments. WTO projected that merchandise-trade volumes could decline by 0.2% in 2025 under prevailing tariff conditions, nearly 3 percentage points below a lower-tariff scenario.
Suppliers must therefore hold larger safety stocks, dual-source critical chips, and reserve installation slots earlier, adding working-capital and scheduling costs that create an estimated -0.9% friction drag on maximum achievable growth.
Opportunities
| Opportunity | (~) % Potential CAGR Upside | Geographic Relevance | Execution Window |
|---|---|---|---|
| Multi-orbit connectivity monetization | +1.5% | Global, led by long-haul networks | Medium term (2 to 4 years) |
| Advertising-funded Wi-Fi | +1.1% | North America, Europe, Asia-Pacific | Short term (2 years or less) |
| Data-led ancillary retail | +0.9% | Global | Medium term (2 to 4 years) |
| Regional fleet retrofits | +0.8% | Asia-Pacific, Latin America, Africa | Long term (4 years or more) |
| Personalized content platforms | +0.6% | Global | Medium term (2 to 4 years) |
Multi-orbit connectivity monetization
Multi-orbit connectivity is a future upside rather than a current baseline driver because many airline contracts still use a single network or treat Wi-Fi primarily as a passenger amenity rather than a managed revenue platform.
Eutelsat reported in 2026 that its aviation platform had reached 600 installations, with commitments from 15 airlines and more than 160 connected private jets, while its Japan Airlines agreement covers more than 40 wide-body aircraft. Viasat stated that its Amara architecture is compatible with equipment on more than 3,000 aircraft operating about 10,000 flights per day, creating a practical base for blended GEO, LEO, and HEO capacity.
Airbus forecasts demand for 42,450 new passenger aircraft through 2044, including 34,250 single-aisle units, extending the future installation pool. If airlines convert capacity into sponsored access, dynamic pricing, and digital retail, an analyst scenario indicates a potential 3–5 percentage-point improvement in service gross margin and a +1.5% upside to baseline CAGR.
Key Players Analysis
Tier-1 leaders in the Inflight entertainment and connectivity market include Collins Aerospace, Thales, Viasat including Inmarsat, Panasonic Avionics, and Safran’s legacy Zodiac Aerospace operations. An indicative competitive assessment suggests these integrated equipment, avionics, satellite, and service providers account for around 55–65% of addressable IFEC spending, although this remains an analyst estimate because comparable IFEC revenue is not separately disclosed.
Collins Aerospace reported USD 30.2 billion in 2025 sales and USD 4.9 billion in operating profit. Thales generated EUR 5.91 billion in Aerospace revenue, up 8.0%, while investing EUR 1.3 billion, equal to 6.0% of group sales, in self-funded R&D. Viasat remains a major connectivity-focused player. Its fiscal 2025 Communication Services revenue reached USD 3.3 billion, while capital expenditure totaled USD 1.0 billion and internal R&D-related spending reached USD 83.4 million.
Viasat served more than 6,000 commercial and business aircraft, including about 1,300 commercial aircraft using its connectivity service. Eutelsat reported EUR 618.1 million in fiscal 2024–25 connectivity revenue, while low-earth-orbit revenue increased 84.1% to EUR 187 million. Planned fiscal 2025–26 capital expenditure stands at EUR 1.0–1.1 billion.
Among Tier-2 players, Gogo generated USD 910.5 million in 2025 revenue, including USD 774.4 million from services and USD 136.1 million from equipment. Iridium reported USD 871.7 million in revenue and USD 100.3 million in capital expenditure, while Honeywell Aerospace Technologies recorded USD 17.5 billion, including USD 7.7 billion from commercial-aviation aftermarket activities.
Top Key Players in the Market
- BAE Systems
- Cobham plc
- Collins Aerospace
- Eutelsat Communications
- Anuvu
- Gogo LLC
- Honeywell International Inc.
- Inmarsat plc
- Iridium Communications Inc.
- Panasonic Corp.
- Safran (Zodiac Aerospace SA)
- SITAONAIR
- Thales SA
- ViaSat Inc.
Recent Developments
- In 2026, Eutelsat reported a major in-flight connectivity agreement for Japan Airlines covering more than 40 wide-body aircraft. The program also includes line-fit installations on Airbus A350-900 and Boeing 787 aircraft. Eutelsat stated that its OneWeb aviation platform had reached 600 installations, with 15 airlines committed and more than 160 private jets connected, showing increasing commercial adoption of multi-orbit aircraft connectivity.
- In 2026, LATAM Airlines is scheduled to begin rolling out a USD 60 million program to introduce Viasat-powered Wi-Fi across its wide-body fleet. LATAM already operates more than 250 Wi-Fi-equipped aircraft, while its onboard connectivity service has been used by more than 8 million passengers, providing a strong base for wider long-haul deployment.
Report Scope
| Report Features | Description |
|---|---|
| Market Value (2025) | USD 8.5 Billion |
| Forecast Revenue (2035) | USD 19.6 Billion |
| CAGR (2026-2035) | 8.7% |
| Base Year for Estimation | 2025 |
| Historic Period | 2020-2024 |
| Forecast Period | 2026-2035 |
| Report Coverage | Revenue Forecast, Market Dynamics, Competitive Landscape, Recent Developments |
| Segments Covered | By Component (Hardware, Connectivity, Content); By Aircraft Type (Narrow-Body Aircraft, Wide-Body Aircraft, Very Large Aircraft); By Offering Type (Inflight Entertainment, Inflight Connectivity) |
| Regional Analysis | North America – US, Canada; Europe – Germany, France, The UK, Spain, Italy, Rest of Europe; Asia Pacific – China, Japan, South Korea, India, Australia, Singapore, Rest of APAC; Latin America – Brazil, Mexico, Rest of Latin America; Middle East & Africa – GCC, South Africa, Rest of MEA |
| Competitive Landscape | BAE Systems, Cobham plc, Collins Aerospace, Eutelsat Communications, Anuvu, Gogo LLC, Honeywell International Inc., Inmarsat plc, Iridium Communications Inc., Panasonic Corp., Safran (Zodiac Aerospace SA), SITAONAIR, Thales SA, ViaSat Inc. |
| Customization Scope | Customization for segments and region/country-level will be provided. Additional customization can be done based on requirements. |
| Purchase Options | We have three licenses to opt for: Single User License, Multi-User License (Up to 5 Users), Corporate Use License (Unlimited Users and Printable PDF) |





























