


Quick Navigation
Report Overview
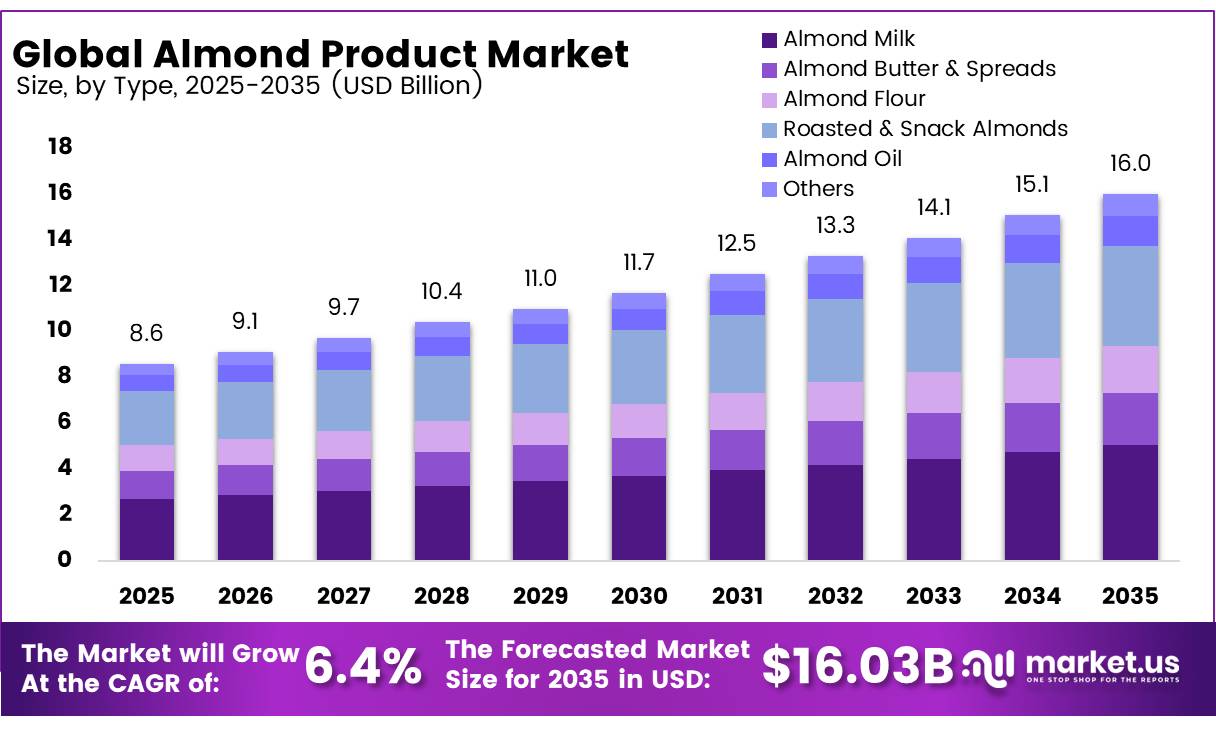
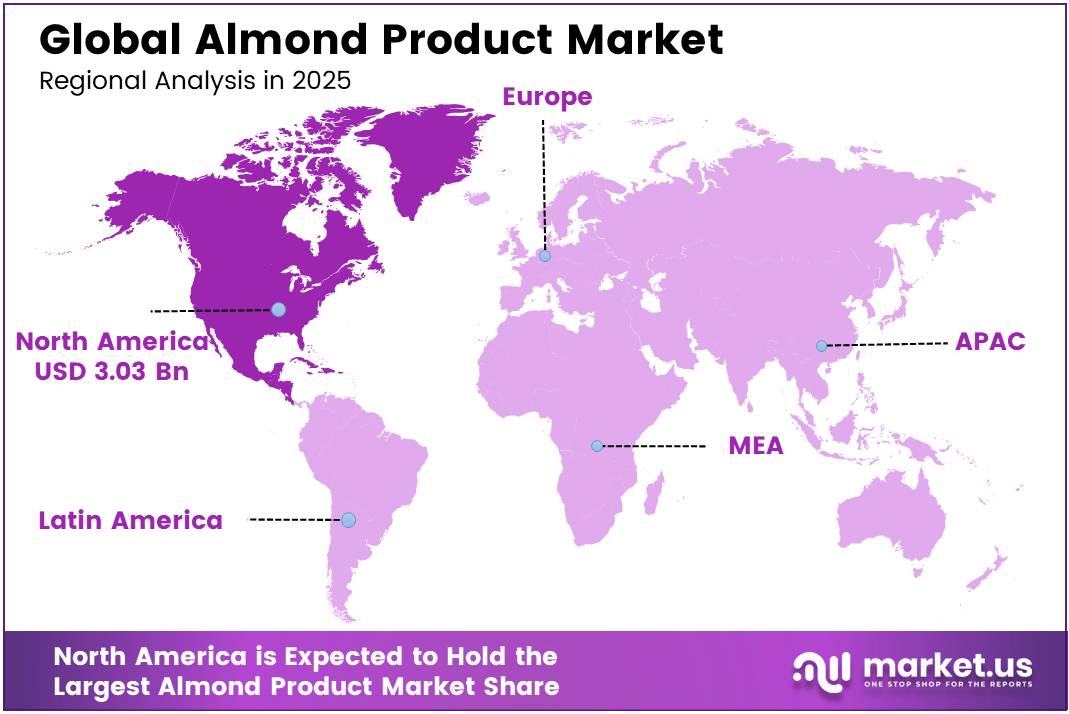
In 2025, the Global Almond Product Market was valued at USD 8.6 billion, and between 2026 and 2035, this market is estimated to register a CAGR of 6.4%, reaching about USD 16.0 billion by 2035. North America held a dominant market position, capturing more than a 35.2% share, holding USD 3.03 billion in revenue.
The almond product market is evolving from a commodity-focused ecosystem into a value-driven, multi-application industry. Growth is increasingly anchored in processed formats such as almond milk and roasted snacks, which now account for the majority of retail and foodservice consumption. Manufacturers are prioritizing formulation innovation, shelf-life optimization, and clean-label positioning to meet rising consumer expectations, while also scaling integrated processing capabilities that enhance operational efficiency and margin potential.
- According to the USDA Foreign Agricultural Service’s November 2025 Tree Nuts: World Markets and Trade report, global almond exports were forecast to rise 3%to 1.1 million tons, led by higher shipments from the United States. The same report noted that China’s almond imports were expected to decline nearly 25% to 100,000 tons, reflecting reduced shipments from the United States even as most other import markets registered gains.
Key Takeaways
- The global Almond product market was valued at USD 8.6 billion in 2025.
- The global market is projected to grow at a CAGR of 6.4% and is estimated to reach USD 16.0 billion by 2035.
- Almond Milk dominated the market, constituting 31.5% of the total market share.
- Processed almonds dominated the Almond Product Market, with a substantial market share of around 61.3%.
- Food & Beverages led the market, comprising 65.6% of the total market.
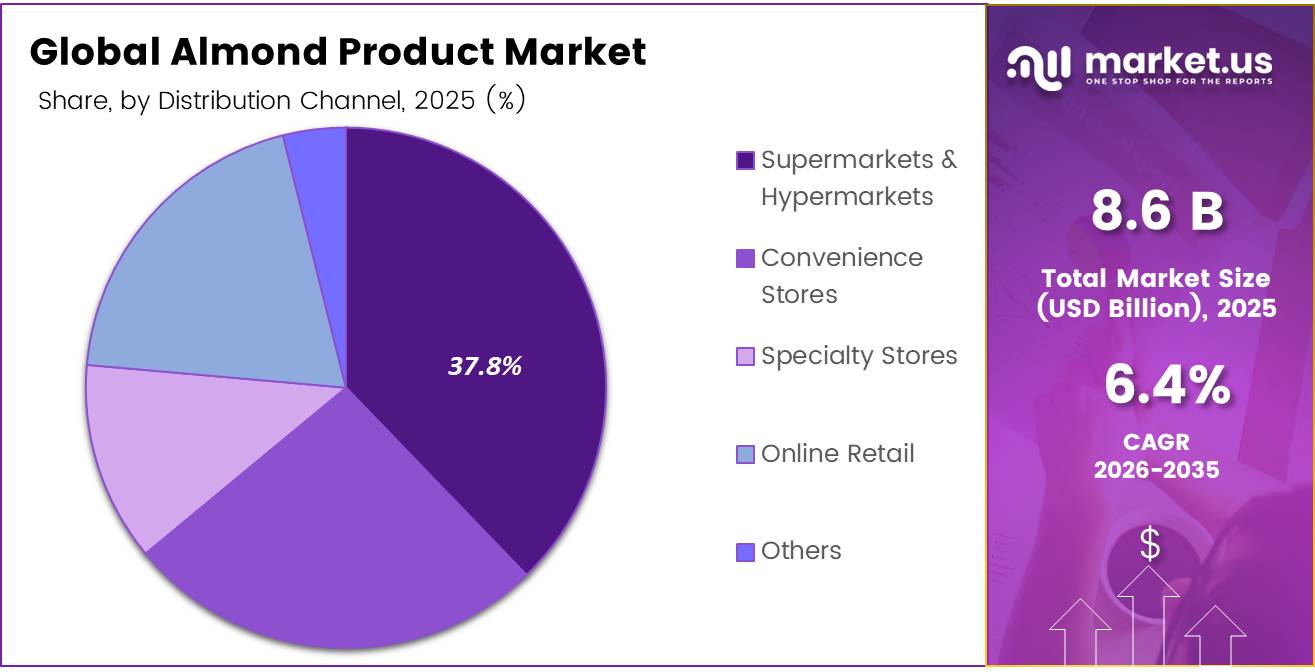
- Supermarkets & Hypermarkets held a major share 37.8% of the market share.
- In 2025, the North America was the most dominant region, accounting for 35.2% of the total global consumption.
According to the USDA’s National Agricultural Statistics Service 2025 California Almond Objective Measurement Report, the state’s 2025 almond meat production was estimated within an 80% confidence interval of 2,610 to 3,390 million pounds. Trade tariff adjustments between major economies have also influenced almond flows, with expanding downstream uses in dairy alternatives, bakery ingredients, and confectionery products broadening consumption channels. These shifts continue to shape sourcing patterns, processing capacity, and orchard investment decisions across leading producing regions globally.
Type Analysis
Almond Milk Represents the Key Revenue-Generating Segment in the Almond Product Market.
Almond milk continues to lead the almond product category, holding a 31.5% share as consumer preference shifts toward plant-based dairy alternatives. This leadership is reinforced by the underlying strength of the raw almond supply chain, with the USDA’s National Agricultural Statistics Service reporting that almonds ranked as the highest-valued tree nut crop in the United States, reaching $5.66 billion in utilized production value in 2024. This scale of production value continues to support consistent raw material availability for beverage-grade processing.
Roasted and snack almonds represent the fastest-growing segment, as demand for convenient, protein-dense snacking options rises. Trade policy developments have also supported growth in edible-use almond exports, with the USDA Foreign Agricultural Service confirming that the retaliatory tariff on U.S. almonds entering China was reduced from 125% to 10% in June 2025, easing a key barrier to snack-grade almond.
Form Analysis
Processed Almond Segment Dominates the Global Almond Product Market.
Processed almonds continue to dominate the category with a market share of 61.3%, favored for their adaptability across an expanding range of end uses, from beverages and bakery formulations to confectionery and snack applications. Manufacturers increasingly prefer processed formats such as slivers, flour, and paste, as these forms integrate seamlessly into automated production lines and reduce preparation time for food companies.
Raw, in-shell almonds are emerging as the fastest-growing form, gaining favor among consumers who associate minimal processing with freshness, nutritional integrity, and transparency in sourcing. Health-conscious buyers increasingly view raw almonds as a cleaner snacking option, free from additives or industrial handling. This shift is also being shaped by rising consumer interest in traditional, less-processed foods, encouraging retailers to expand raw almond offerings across specialty and organic segments to meet evolving dietary preferences
Application Analysis
Food & Beverages Emerges as the Core Application Hub in the Almond Product Market.
Food & beverages remain the dominant application, commanding a leading 65.6% share as almonds continue to serve as a versatile, nutrient-dense ingredient across snacking, bakery, dairy-alternative, and confectionery formulations. In December 2024, according to the FDA, a final rule updating the “healthy” nutrient content claim now allows nuts and seeds, including almonds, to qualify for the “healthy” label based on current dietary science and federal nutrition guidance. In July 2025, according to the USDA’s Economic Research Service, almond exports for the period August 2024 through May 2025 reached 1.727 billion pounds, up 1.6% from the prior year.
Cosmetics & personal care represents the fastest-growing application, as almond oil and derivatives gain traction in skincare and haircare formulations. In March 2026, according to the FDA, there were 15,309 active cosmetic product facility registrations and 1,102,092 active product listings under the Modernization of Cosmetics Regulation Act.
Distribution Channel Analysis
Supermarkets & Hypermarkets Emerge as the Leading Distribution Channel in the Almond Product Market.
Supermarkets & hypermarkets remain the leading distribution channel, commanding a dominant 37.8% share as consumers continue to favor one-stop shopping destinations for grocery and packaged food purchases, including almond-based products. In May 2026, according to the USDA’s Economic Research Service, the food-at-home Consumer Price Index, which tracks grocery store and supermarket purchases, rose 2.7% compared to May 2025, reflecting sustained consumer spending activity within traditional retail formats. This continued spending strength reinforces supermarkets’ role as the primary gateway for almond product purchases.
Online retail represents the fastest-growing distribution channel, as consumers increasingly shift toward digital shopping convenience. In May 2026, according to the U.S. Census Bureau, retail e-commerce sales for the first quarter of 2026 rose 9.8% year-over-year, reaching 16.9% of total U.S. retail sales
Key Market Segments
By Type
- Almond Milk
- Almond Butter & Spreads
- Almond Flour
- Roasted & Snack Almonds
- Almond Oil
- Other
By Form
- Raw
- Processed
By Application
- Food & Beverages
- Cosmetics & Personal Care
- Nutraceuticals
- Pharmaceuticals
- Others
By Distribution Channel
- Supermarkets & Hypermarkets
- Convenience Stores
- Specialty Stores
- Online Retail
- Others
Drivers
Rising export demand in India and APAC corridors
Almond Board of California and Blue Diamond export data show that in March 2026, total industry shipments reached 258 million pounds, up 16.5 percent year-over-year, with exports hitting 205.2 million pounds—an increase of 21 percent YoY—confirming that international markets are growing faster than domestic ones. India alone imported approximately 39.2 million pounds in March 2026, reducing its YoY shortfall to just 3 percent, and for the 2024/25 season India imported approximately 190,000 metric tonnes of almonds against domestic production of only about 4,150 MT, reflecting a structural import dependency driven by a consumer base where almond consumption is projected to reach 195,840 MT in MY2025–26.
India’s market, which now accounts for as much as 21 percent of total U.S. almond exports, is growing at a sustained 6–8 percent annual pace, while China shipments surged 123 percent in March 2026 against a weak prior-year comparison base affected by newly introduced tariffs, and Vietnam grew 63 percent year-to-date, highlighting ASEAN as an emerging demand corridor.
Drivers Impact Analysis
| Driver | (~) % Impact on CAGR | Geographic Relevance | Impact Timeline |
|---|---|---|---|
| Plant-based dairy momentum led by almond milk | +1.8% | North America core, EU, developed APAC | Long term (≥ 4 years) |
| Rising export demand in India and APAC corridors | +1.5% | India, China/HK, Vietnam, Middle East | Medium term (2-4 years) |
| Health and snacking premiumization driving value-added formats | +1.3% | North America, EU, APAC, MENA | Medium term (2-4 years) |
| Almond flour and gluten-free bakery expansion | +1.1% | North America, EU, India | Long term (≥ 4 years) |
| Tight supply supporting price firmness and margin recovery | +0.9% | California origin, global buyers | Short term (≤ 2 years) |
| Organic and clean-label almond premium segment growth | +0.8% | EU, North America, developed APAC | Long term (≥ 4 years) |
Restraints
California water scarcity and supply concentration risk
California produces approximately 80 percent of the world’s commercial almond supply and accounts for essentially all U.S. almond exports, making the global almond products market uniquely exposed to a single geographic water risk that no other crop concentration quite matches: as of June 2026, water availability remains the single biggest concern for California almond growers, with the 2026 crop forecast at roughly 2.7 billion pounds shaped in part by water allocation decisions rather than purely agro-climatic factors.
In practical unit economics, water costs represent 15–25 percent of total per-acre production cost for almond growers, and curtailment events can reduce yields by 8–15 percent and increase per-pound production cost by a commensurate margin; when multiple growers simultaneously face curtailment, the aggregate supply shortfall firms almond prices but also signals to global buyers that supply reliability is structurally limited, prompting some large food manufacturers and beverage brands to invest in dual-source procurement strategies that dilute California’s market share and increase procurement overhead for all parties.
Restraint Impact Analysis
| Restraint | (~) % Impact on CAGR | Geographic Relevance | Impact Timeline |
|---|---|---|---|
| California water scarcity and supply concentration risk | -1.6% | California origin; global buyers | Long term (≥ 4 years) |
| Tariff and trade-barrier volatility | -1.2% | U.S. exports to China, India, EU, MENA | Medium term (2-4 years) |
| Allergen regulation and labeling complexity | -0.9% | North America, EU, APAC, Middle East | Medium term (2-4 years) |
| Competition from alternative plant-based milks | -0.8% | North America, EU, developed APAC | Long term (≥ 4 years) |
| High water and input cost sensitivity to price | -0.7% | Global; sharpest in cost-sensitive APAC, MENA | Medium term (2-4 years) |
| Orchard replanting cycle and supply lag | -0.6% | California core, global supply chain | Long term (≥ 4 years) |
Opportunity
Almond byproduct upcycling platform
Research from BEAM Circular, MycoTechnology, and the USDA’s ABPDU confirms that almond hulls—rich in glucose, fructose, pectin, dietary fiber, antioxidants, and prebiotic compounds—can serve as fermentation feedstock for enzymes, specialty chemicals, and protein biomass production; as an ingredient in high-fiber bakery products, performance nutrition bars, and prebiotic supplements; and as a coffee flavour extender where hulls can replace up to 20 percent of coffee beans while adding complex vanilla and fruity notes.
Almond shells, through pyrolysis at temperatures of 400–700°C in oxygen-free conditions, yield biochar with carbon sequestration potential and potential use as an activated carbon filter medium for water purification—a growing industrial application as water-quality regulation tightens globally—as well as composite filler material for recycled plastics. Almond skins, already available as a byproduct of blanching operations at scale, are a rich source of polyphenols and natural colourants with proven antioxidant activity, and early research suggests applications in natural textile dyeing and nutraceutical formulation.
Opportunity Impact Analysis
| Opportunity | (~) % Potential CAGR | Geographic Relevance | Execution Window |
|---|---|---|---|
| Almond protein concentrate/isolate for sports and clinical nutrition | +1.1% | North America, EU, developed APAC, GCC | Medium term (2-4 years) |
| Almond byproduct upcycling platform (hull, shell, skin) | +0.9% | North America core, EU, APAC | Long term (≥ 4 years) |
| Untapped Middle East and Africa premium almond category | +0.8% | GCC, North Africa, Sub-Saharan Africa | Long term (≥ 4 years) |
| Almond butter and nut-spread adjacent expansion | +0.8% | North America, EU, APAC emerging | Medium term (2-4 years) |
| Direct-to-consumer and personalised nutrition models | +0.7% | North America core, EU, developed APAC | Short term (≤ 2 years) |
| Gut-health functional almond formulations | +0.6% | EU, North America, APAC health-conscious tier | Long term (≥ 4 years) |
Challenge
Aflatoxin and food-safety compliance complexity
Almond Board of California protocols and certified-laboratory guidance confirm that the primary contamination pathway is Navel Orangeworm (NOW) damage: the insect creates entry points in the almond shell through which mould spores can access the nutmeat, and stockpiled almonds with total fruit moisture content above 6.5–7 percent provide ideal mould-growth conditions, with in-hull almonds left in hot, humid stockpiles during harvest season being particularly at risk.
Maximum residue limits differ materially across jurisdictions the EU cap is 10 ppb total aflatoxin (8 ppb for B1), U.S. FDA allows 20 ppb, India sets 10 ppb for ready-to-eat product, and China allows 20 ppb with a stricter 5 ppb for B1 and these divergent thresholds require processors to maintain multiple lot-segregation protocols, distinct test frequencies, and documentation chains for each destination, adding 3–6 percent to per-tonne compliance overhead on export-grade product.
Challenges Impact Analysis
| Challenge | (~) % CAGR Friction | Geographic Relevance | Mitigation Horizon |
|---|---|---|---|
| Aflatoxin and food-safety compliance complexity | -1.0% | EU, China, India, MENA import checkpoints | Long term (≥ 4 years) |
| Yield quality inconsistency and harvest variability | -0.9% | California origin; global supply chain | Medium term (2-4 years) |
| Agricultural labour supply thinning | -0.8% | California core; APAC processing hubs | Long term (≥ 4 years) |
| Cold-chain infrastructure gaps in growth markets | -0.7% | India, MENA, Africa, APAC corridors | Long term (≥ 4 years) |
| Pollinator dependency and bee colony risk | -0.6% | California core; global supply risk | Long term (≥ 4 years) |
| Multi-jurisdictional MRL and pesticide compliance | -0.6% | EU, China, India, GCC import gates | Medium term (2-4 years) |
Geopolitical Impact Analysis
Trade Tariff Volatility and Supplier Diversification Reshaping Global Almond Trade Flows.
Escalating trade tensions between major economies have introduced significant volatility into global almond trade routes. In March 2025, according to the USDA Foreign Agricultural Service, tariffs on U.S. almonds entering China rose to an overall applicable rate of 35%, following an additional 10% point increase layered atop existing duties. This escalation disrupted established trade corridors, prompting buyers and exporters to reassess sourcing strategies and accelerating a broader shift toward supplier diversification across the global almond trade.
This realignment has strengthened alternative supply origins outside the United States. In the same USDA report, Australian almond exports for marketing year 2025/26 were forecast to reach a record 143,000 metric tons, positioning Australia as an increasingly important counterbalance to U.S. supply dominance amid ongoing trade friction. This structural shift reflects how geopolitical tensions are gradually redistributing global almond trade influence beyond traditional export leaders.
Regional Analysis
North America Held the Largest Share of the Global Almond Product Market.
North America holds a 35.2% share of the global almond product market, making it the dominant regional market. This leadership is primarily driven by the region’s strong production base, particularly in California, which ensures consistent raw almond supply and supports large-scale processing and value-added product development. The presence of well-established supply chains, advanced processing infrastructure, and strong penetration of plant-based food products has further reinforced regional dominance.
In addition, North America benefits from strong integration between growers, processors, and branded manufacturers, enabling efficient commercialization of new product formats and faster scaling of innovation. This vertically integrated ecosystem supports competitiveness across both domestic consumption and export markets, strengthening its global influence in almond product trade dynamics.
Europe and Asia Pacific are emerging as key growth regions, driven by rising health consciousness, expanding demand for plant-based diets, and increasing retail modernization, while Latin America and the Middle East & Africa are gradually gaining traction through import-driven consumption growth and evolving dietary preferences.
Key Regions and Countries Covered
- North America
- The US
- Canada
- Europe
- Germany
- France
- The UK
- Spain
- Italy
- Russia & CIS
- Rest of Europe
- APAC
- China
- Japan
- South Korea
- India
- ASEAN
- Rest of APAC
- Latin America
- Brazil
- Mexico
- Rest of Latin America
- Middle East & Africa
- GCC
- South Africa
- Rest of MEA
Key Players Analysis
The global almond product market is moderately consolidated at the branded and processing level, with the top five players being Blue Diamond Growers, The Wonderful Company, Olam Food Ingredients, John B. Sanfilippo & Son, Inc., and Archer Daniels Midland Company, collectively in 2025. Within this structure, Blue Diamond Growers remains the clear leader with over 10.2% share, supported by its cooperative grower network, large-scale processing infrastructure, and globally established branded portfolio.
Blue Diamond Growers and The Wonderful Company dominate branded consumer channels, while Olam Food Ingredients and Archer Daniels Midland Company strengthen global ingredient supply chains and industrial partnerships. Meanwhile, specialized players such as John B. Sanfilippo & Son, Inc. differentiate through snack innovation and channel-specific product strategies, reinforcing a dual structure of scale-driven leaders and agile niche competitors.
The Major Players In The Industry
- Archer Daniels Midland Company (ADM)
- The Wonderful Company
- Blue Diamond Growers
- Olam International Limited
- Barry Callebaut Group
- John B. Sanfilippo & Son, Inc.
- Treehouse California Almonds, LLC
- Borges Agricultural & Industrial Nuts (Borges Group)
- Savencia SA
- Modern Ingredients
- Royal Nut Company
- Harris Woolf California Almonds
- Wonderful Pistachios & Almonds
- Mariani Nut Company
- Waterford Nut Company
Key Development
- In 2026, Wonderful Orchards also joined crop-tour work that estimated California’s almond crop at a 2.64 billion-pound midpoint, with a range of 2.57–2.71 billion pounds.
- Blue Diamond reported FY2025 net sales and other revenue of about USD 1.509 billion, compared with USD 1.332 billion in FY2024. In 2025, it also planned to close its 53-acre Sacramento plant over two years and shift manufacturing to Turlock and Salida, affecting about 600 jobs.
- In 2025, Olam said it would invest USD 500 million into ofi while selling other businesses over time. In 2026, it completed the sale of a 44.58% stake in Olam Agri to SALIC for about USD 1.88 billion, leaving Olam Group with 19.99% of Olam Agri and giving more focus to its food ingredients platform.
- In 2025, Savencia reported annual revenue of about EUR 6.96 billion, down 2.6%, with organic growth of 1.6%. Its key 2026 M&A move was the acquisition by Savencia Fromage & Dairy of Savencia Gourmet’s chocolate activities, which generated about EUR 800 million in 2025 revenue.
Report Scope
| Report Features | Description |
|---|---|
| Market Value (2025) | USD 8.6 Bn |
| Forecast Revenue (2035) | USD 16.0 Bn |
| CAGR (2026-2035) | 6.4% |
| Base Year for Estimation | 2025 |
| Historic Period | 2020-2024 |
| Forecast Period | 2026-2035 |
| Report Coverage | Revenue Forecast, Market Dynamics, Competitive Landscape, Recent Developments |
| Segments Covered | By Type (Almond Milk, Almond Butter & Spreads, Almond Flour, Roasted & Snack Almonds, Almond Oil, Others); By Form (Raw, Processed); By Application (Food & Beverages, Cosmetics & Personal Care, Nutraceuticals, Pharmaceuticals, Others); By Distribution Channel (Supermarkets & Hypermarkets, Convenience Stores, Specialty Stores, Online Retail, Others) |
| Regional Analysis | North America – The US & Canada; Europe – Germany, France, The UK, Spain, Italy, Russia & CIS, Rest of Europe; APAC– China, Japan, South Korea, India, ASEAN & Rest of APAC; Latin America– Brazil, Mexico & Rest of Latin America; Middle East & Africa– GCC, South Africa, & Rest of MEA |
| Competitive Landscape | Archer Daniels Midland Company (ADM), The Wonderful Company, Blue Diamond Growers, Olam International Limited, Barry Callebaut Group, John B. Sanfilippo & Son Inc., Treehouse California Almonds LLC, Borges Agricultural & Industrial Nuts, Savencia SA, Modern Ingredients, Royal Nut Company, Harris Woolf California Almonds, Wonderful Pistachios & Almonds, Mariani Nut Company, Waterford Nut Company. |
| Customization Scope | Customization for segments, region/country-level will be provided. Moreover, additional customization can be done based on the requirements. |
| Purchase Options | We have three licenses to opt for: Single User License, Multi-User License (Up to 5 Users), Corporate Use License (Unlimited Users and Printable PDF) |





































