


Report Overview
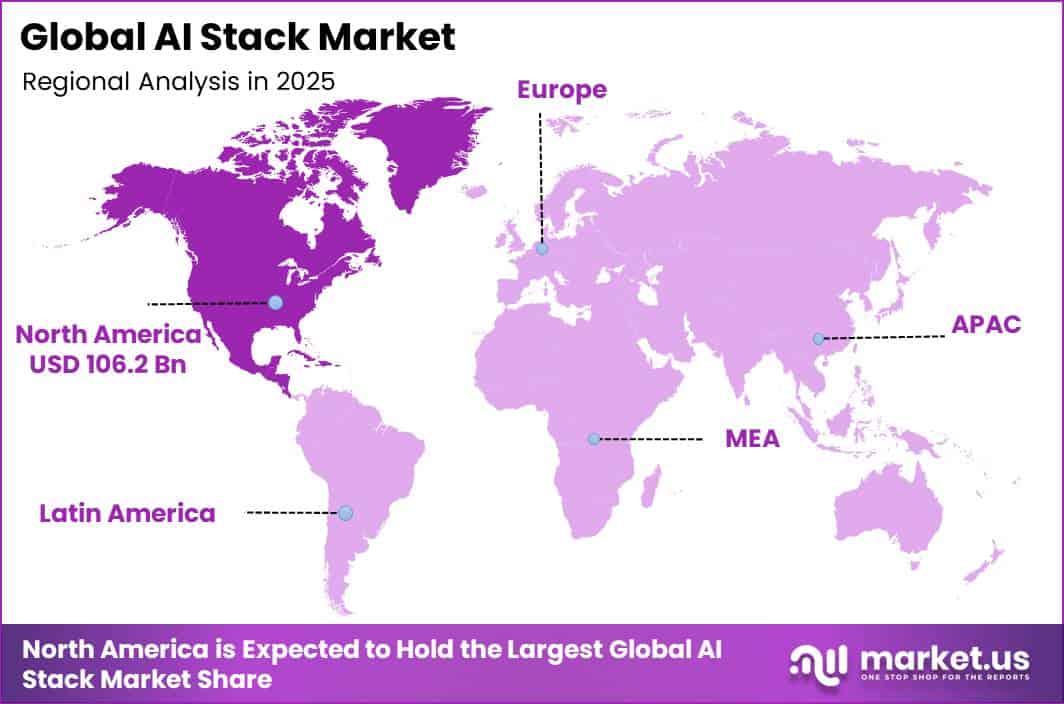
In 2025, the Global AI Stack Market was valued at USD 231.8 billion. The market is projected to grow at a CAGR of 22.4% during 2026–2035, reaching approximately USD 1773.4 billion by 2035. North America dominated the global market in 2025, accounting for more than 45.8% of the total market share and generating approximately USD 106.2 billion in revenue.
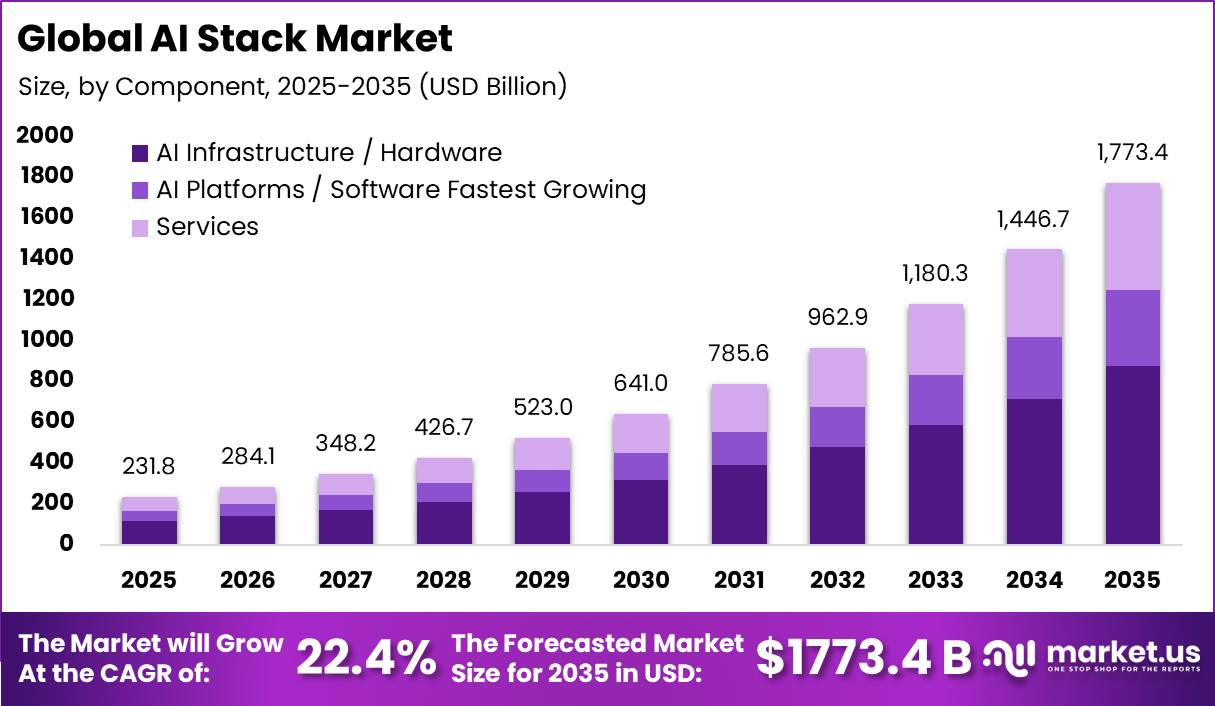
Growth is supported by rising investment across AI chips, cloud infrastructure, data platforms, foundation models, development tools, and business applications. The IEA reported that global data-centre electricity consumption reached about 415 TWh in 2024 and could increase to nearly 945 TWh by 2030, more than doubling within 6 years.
This reflects strong demand for AI servers, accelerated computing, storage, networking, cloud services, and model-deployment platforms. Stanford University’s AI Index also reported global private AI investment of USD 344.7 billion in 2025, representing an increase of 127.5% from the previous year. Of this, around USD 143.2 billion was invested in AI infrastructure, models, research, and governance.
U.S. private AI investment reached USD 109.1 billion in 2024, nearly 12 times China’s USD 9.3 billion. The United States also accounted for around 45% of global data-centre electricity consumption in 2024. AI-focused hyperscale facilities can require more than 100 MW of power, compared with approximately 10–25 MW for conventional data centres.
Key Takeaway
- Global AI Stack Market valued at USD 231.8 billion in 2025, projected to reach USD 1773.4 billion by 2035 at a 22.4% CAGR.
- AI Infrastructure & Hardware led the market with a 49.5% share, driven by strong demand for GPUs, servers, storage, networking, and power systems.
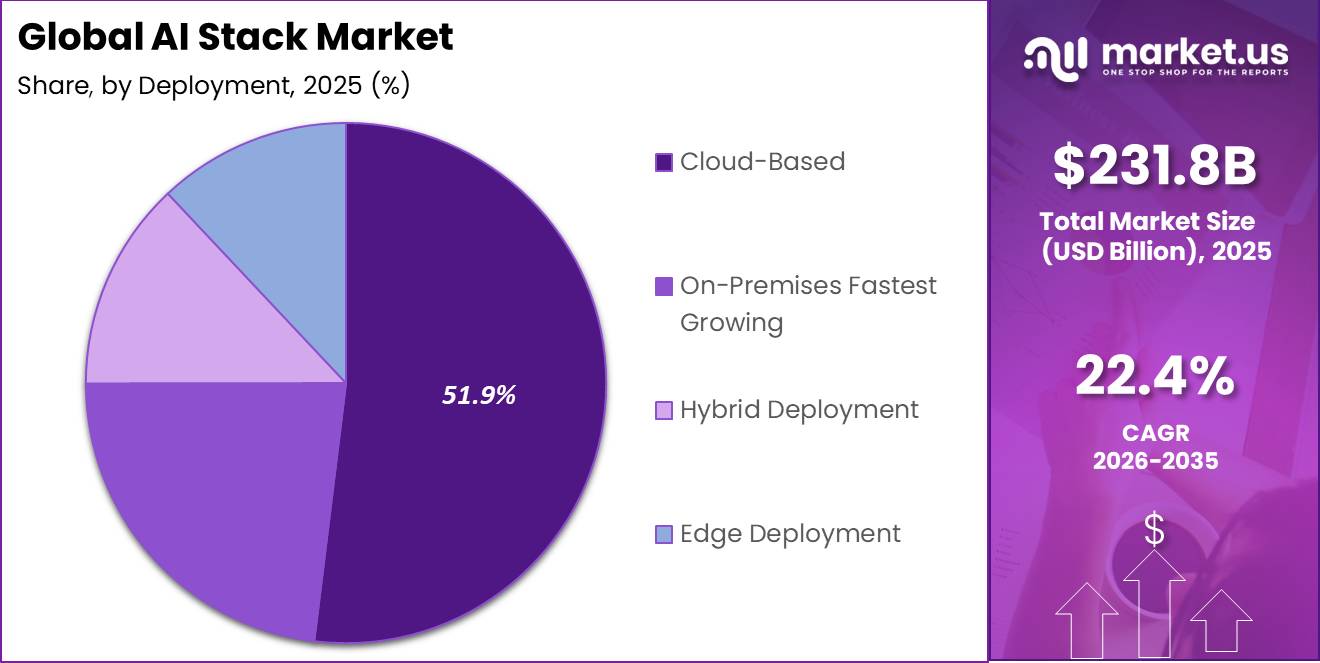
- Cloud-Based Deployment dominated with a 51.9% share, supported by scalable access to AI computing, storage, models, and development tools.
- Infrastructure Layer, held a 34.5% share, as chips, servers, networking, cooling, and power equipment form the foundation of AI systems.
- Machine Learning, led with a 30.8% share, supported by broad applications in forecasting, fraud detection, predictive maintenance, and recommendation systems.
- Customer Service & Chatbots accounted for a 23% share, driven by growing automation of customer queries, service requests, and support operations.
- IT & Telecommunications led with a 24.5% share, supported by rising AI adoption in network management, cloud workloads, cybersecurity, and connected services.
- North America led the market in 2025 with a 45.8% share, generating about USD 106.2 billion in revenue.
Market Statistics and Data Insights
- Global data centres consumed 415 TWh of electricity in 2024, equal to around 1.5% of worldwide electricity consumption. The United States accounted for 45% of global data-centre electricity use, confirming the concentration of AI-compute infrastructure in North America.
- Memory semiconductor sales reached USD 223.1 billion in 2025, while logic and memory were the strongest semiconductor categories supporting AI accelerators, high-bandwidth computing and data-centre systems.
- Microsoft reported more than USD 75 billion in Azure revenue in FY2025, representing 34% growth. Microsoft Cloud revenue reached USD 168.9 billion, highlighting rising spending on cloud infrastructure, AI services and enterprise software.
- Microsoft operated more than 400 data centres across 70 regions and added over 2 GW of new data-centre capacity during FY2025. Every Azure region had also been enabled to support liquid cooling for high-density AI computing.
- In the EU, 52.74% of enterprises with at least 10 employees used paid cloud computing services in 2025. Among companies using paid cloud, 28.1% purchased computing power for their own software and 26.08% used cloud platforms for application development, testing or deployment.
- AI adoption among EU enterprises reached 19.95% in 2025, rising by 6.47 percentage points from 2024. Adoption reached 55.03% among large enterprises, 30.3% among medium enterprises and 17% among small enterprises.
- Among EU businesses already using AI in 2025, 34.70% used it for marketing or sales, and 31.05% used it for administration or management. Among large AI-using enterprises, 47.51% used AI for ICT security and 33.46% for production processes.
- U.S. Census Bureau data covering November 2025–January 2026 found that 18% of firms used AI in a business function, rising to 32% when weighted by employment. Among AI-using firms, 52% used AI in sales and marketing, 45% in strategy and business development, and 41% in IT.
- The same U.S. Census research found that 23% of firms had workers using AI for work-related tasks, increasing to 41% on an employment-weighted basis. Around 66% of AI users relied on AI only to augment work, while AI-linked employment declines were reported by just 2% of firms.
- Among Canadian companies using AI in Q2 2026, 36.6% used data analytics, 34.5% used text analytics and 28.2% used virtual agents or chatbots. Natural-language processing reached 27.0%, while large language model use reached 24.8%.
- Alphabet reported more than 750 million monthly active users for the Gemini app by February 2026. Gemini Enterprise had sold more than 8 million paid seats to over 2,800 companies, showing adoption at both consumer and enterprise levels.
- In Canada’s Q2 2026 business survey, 13.4% of businesses identified cybersecurity or privacy concerns as an AI adoption barrier, while 10.6% identified cost. Among information and cultural businesses, privacy or cybersecurity concerns reached 30.9%.
By Component
AI infrastructure and hardware held the leading position in the global AI stack market with a 49.5% share, supported by the high spending required for GPUs, AI accelerators, servers, high-bandwidth memory, storage, networking equipment, cooling systems, and power infrastructure. These components form the basic computing layer needed to train large AI models and process large volumes of real-time requests.
The November 2025 TOP500 ranking highlights the scale of this infrastructure investment. The El Capitan supercomputer achieved 1.809 exaflops of performance using 11.3 million processor cores, while the top 3 systems together delivered more than 4.17 exaflops. Such large computing systems require significant upfront investment, supporting the strong revenue contribution of the hardware segment.
Meanwhile, AI platforms and software are expected to be the fastest-growing segment. Enterprises increasingly require software for model development, testing, deployment, governance, monitoring, security, and regular updates. As AI becomes part of daily business operations, spending is moving toward recurring cloud services, model-management platforms, security solutions, and AI applications, allowing the software segment to grow faster from a smaller installed base.
By Deployment
Cloud-based deployment led the AI stack market with a 51.9% share, mainly because it allows companies to access advanced computing power, storage, AI models, and development tools without investing heavily in their own data centres. In 2025, around 52.74% of EU enterprises with at least 10 employees used paid cloud services, showing the strong existing base for cloud-based AI adoption.
Cloud platforms also allow businesses to share costly GPU resources, scale AI training and inference when needed, and pay based on usage. This makes cloud deployment especially attractive for smaller companies with limited IT staff and capital budgets.
On-premises deployment is the fastest-growing segment, supported by demand from large enterprises and government organizations that require greater control over sensitive data, system access, compliance, and response times. The UK Government has committed up to £2 billion to develop a national computing ecosystem.
This includes more than £1 billion to expand the AI Research Resource by 20 times by 2030, along with up to £750 million for a national supercomputer service. These investments highlight growing demand for locally controlled, high-performance AI infrastructure.
By Stack Layer
The infrastructure layer led the AI stack market with a 34.5% share, as chips, servers, storage systems, networking, cooling, and power equipment are required before AI models and applications can operate. In the United States, developers plan to add a record 86 gigawatts of new utility-scale generating capacity in 2026, with solar and battery storage accounting for around 79% of the total.
This expansion reflects rising electricity needs from data centres and computing infrastructure. In Europe, data-centre capacity is expected to reach 13 gigawatts by the end of 2026, around one-fifth higher than the previous year. These large capital investments keep infrastructure as the biggest spending layer of the AI stack.
The model layer is the fastest-growing segment, supported by rapid development of new foundation models and rising spending on training, tuning, and licensing. Stanford HAI reported that industry released 87 of 94 notable AI models in 2025. The United States produced 59 notable models, compared with 35 from China. Growing model launches, improving capabilities, and continuous R&D investment are therefore accelerating demand across the model layer.
By Technology Type
Machine learning (ML) led the AI stack market with a 30.8% share, supported by its wide use across fraud detection, demand forecasting, predictive maintenance, customer scoring, image inspection, and recommendation systems. ML models can work with structured business data and can be integrated directly into regular operations, creating continuous demand for data pipelines, model training, inference infrastructure, and monitoring tools.
The World Bank reported that intentional AI adoption among firms averaged around 8% across OECD countries in 2023, with large enterprises showing higher adoption than smaller businesses. This indicates significant room for further ML adoption across core business activities.
Generative AI is the fastest-growing technology segment because it can create text, software code, images, and summaries from unstructured information. Stanford HAI reported that 71% of surveyed organizations used generative AI in at least one business function in 2024, compared with 33% in 2023. Global private investment in generative AI also reached USD 33.9 billion in 2024, increasing 18.7% year over year.
By Application
Customer service and chatbots led the AI stack market with a 23% share, supported by their ability to manage large volumes of customer questions, account requests, order updates, and service issues. These AI tools can operate continuously, improve response times, and transfer complex cases to human agents when needed.
U.S. Census Bureau research found that virtual agents were the second-most common AI application among AI-using firms, with 21.6% adoption. Chatbots, natural-language processing, and text analytics were also among the most widely used business AI tools, increasing demand for model hosting, knowledge bases, integration software, and monitoring platforms.
Content generation is the fastest-growing application as generative AI is increasingly used to create marketing copy, product descriptions, reports, training materials, images, and software code. U.S. Census Bureau data for November 2025–January 2026 showed that writing, document analysis, and information search were among the leading generative-AI work tasks. Among firms adopting AI, sales and marketing was the most common business function, used by 52% of firms.
By End-User Industry
IT and telecommunications led the AI stack market with a 24.5% share, supported by the growing need to manage large volumes of network traffic, cloud workloads, and connected users. The International Telecommunication Union estimated that 6 billion people, or 74% of the global population, used the internet in 2025, while mobile subscriptions reached 9.1 billion.
This large digital base increases demand for AI-based network planning, traffic management, fault detection, cybersecurity, customer support, and capacity forecasting. These applications require strong computing infrastructure, data storage, machine-learning platforms, and automation software, keeping IT and telecom as a major buyer of AI stack solutions.
BFSI is the fastest-growing end-user segment as banks and insurers increasingly use AI for fraud detection, credit assessment, claims processing, compliance, and personalized services. The World Bank reported that 61% of adults in low- and middle-income economies made or received a digital payment in 2024, representing 82% of account owners and an increase of 27 percentage points from 2014.
Key Market Segments
By Component
- AI Infrastructure / Hardware
- AI Platforms / Software
- Services
By Deployment
- Cloud-Based
- On-Premises
- Hybrid Deployment
- Edge Deployment
By Stack Layer
- Infrastructure Layer
- Data Layer
- Model Layer
- MLOps & Orchestration Layer
- Application Layer
- Security & Governance Layer
By Technology Type
- Generative AI
- Machine Learning (ML)
- Natural Language Processing (NLP)
- Computer Vision
- Speech & Voice AI
- Agentic AI / Autonomous Agents
By Application
- Content Generation
- Customer Service & Chatbots
- Software Development Assistance
- Workflow Automation
- Analytics & Decision Intelligence
- Cybersecurity & Fraud Detection
- Recommendation & Personalization
By End-User Industry
- BFSI
- Healthcare & Life Sciences
- Retail & E-commerce
- IT & Telecommunications
- Manufacturing
- Government & Public Sector
- Media & Entertainment
- Others
Geopolitical Impact Analysis
Geopolitical disruption is increasing costs, delivery times, and supply-chain risks across the global AI stack, particularly for GPUs, high-bandwidth memory, servers, optical modules, switches, cooling systems, and power equipment sourced from Asia. UNCTAD reported that Red Sea disruptions and rerouting through the Cape of Good Hope added around 10 days to two weeks to Far East–Northwest Europe shipping times, increased average fuel costs by 40%, and raised round-trip greenhouse-gas emissions by 70%.
By September 2024, container freight rates from the Far East to Northwest Europe had increased 276%, while Mediterranean routes rose 167%. Suez Canal tonnage also declined 70%, while Cape-route arrivals increased 89% by mid-2024. These disruptions raise freight, insurance, inventory, and working-capital costs for AI infrastructure suppliers.
Trade policies create additional pressure. In 2025, policy measures included a 10% U.S. baseline tariff and a 10% Chinese tariff, while proposed reciprocal duties reached 24% for Malaysia, 46% for Vietnam, 34% for China, 36% for Thailand, and 25% for South Korea. These measures increase the landed cost of AI hardware and encourage companies to diversify suppliers and manufacturing locations.
Energy costs are another major concern. Data centres consumed around 415 TWh in 2024, equal to 1.5% of global electricity demand, and consumption could reach 945 TWh by 2030. AI-focused facilities can require 100 MW or more, comparable to the annual electricity use of around 350,000–400,000 electric cars. These pressures are encouraging AI companies to diversify data-centre locations and strengthen energy planning.
Regional Analysis
North America dominated the global AI stack market in 2025, holding a 45.8% share and generating an estimated USD 106.2 billion in revenue. The region benefits from a strong presence of hyperscale cloud providers, AI-chip companies, model developers, enterprise software firms, and large technology buyers. The United States remains a major centre for advanced AI development.
Stanford University’s AI Index reported that U.S.-based institutions produced 40 notable AI models in 2024, compared with 15 in China and 3 across Europe. This strong innovation base supports spending on AI servers, networking, cloud infrastructure, data platforms, foundation models, cybersecurity, model-management tools, and business applications. High cloud availability and strong enterprise investment also help companies move AI projects from testing to commercial deployment more quickly.
Asia Pacific is expected to be the fastest-growing regional market, supported by expanding digital services, semiconductor production, cloud infrastructure, and local AI development. China produced 15 notable AI models in 2024, showing its growing AI capabilities. The World Bank reported that Vietnam’s AI-related exports increased from around 20% of GDP in 2023 to approximately 32% in 2025, while Malaysia’s share rose from about 28% to 34%.
Strong electronics supply chains, skilled engineering talent, government digital programs, and rising demand for local-language AI solutions are increasing adoption across banking, telecom, e-commerce, manufacturing, and public services, supporting rapid regional growth.
Key Regions and Countries
North America
- US
- Canada
Europe
- Germany
- France
- The UK
- Spain
- Italy
- Rest of Europe
Asia Pacific
- China
- Japan
- South Korea
- India
- Australia
- Rest of APAC
Latin America
- Brazil
- Mexico
- Rest of Latin America
Middle East & Africa
- GCC
- South Africa
- Rest of MEA
Market Dynamics
Drivers
| Driver | (~) % CAGR | Geographic Relevance | Impact Timeline |
|---|---|---|---|
| Hyperscale compute buildout | +3.2% | Global; strongest in North America and East Asia | Short term (2 years or less) |
| Enterprise AI deployment | +2.6% | North America, Europe, Asia Pacific | Short term (2 years or less) |
| Accelerator server replacement | +2.1% | Global | Medium term (2 to 4 years) |
| Cloud AI service adoption | +1.9% | Global | Short term (2 years or less) |
| Public-sector compute programs | +1.3% | North America, Europe, Gulf, Asia Pacific | Medium term (2 to 4 years) |
Hyperscale compute buildout
Hyperscale compute expansion is the strongest growth driver because AI model training and large-scale inference require GPUs, high-speed networking, storage, cooling, and power infrastructure. Global data-centre electricity use reached 415 TWh in 2024, equal to 1.5% of global electricity consumption, and could rise to around 945 TWh by 2030. AI accelerator-server electricity demand may also grow by about 30% annually.
This rising infrastructure need is increasing spending across the AI stack. NVIDIA reported Data Center revenue of USD 193.7 billion in FY2026, up 68%, while Microsoft reported Azure revenue above USD 75 billion in FY2025, up 34%. These trends could add around +3.2% to the market’s 22.40% baseline CAGR.
Restraints
| Restraint | (~) % CAGR | Geographic Relevance | Impact Timeline |
|---|---|---|---|
| Grid-connection scarcity | -2.8% | North America, Europe, East Asia | Medium term (2 to 4 years) |
| AI compliance obligations | -1.7% | European Union and global suppliers | Short term (2 years or less) |
| Advanced-chip trade controls | -1.5% | United States, China, East Asia | Short term (2 years or less) |
| High infrastructure capital intensity | -1.4% | Global | Medium term (2 to 4 years) |
| Data residency restrictions | -1.0% | Europe, India, Middle East, Asia Pacific | Medium term (2 to 4 years) |
Grid-connection scarcity
Grid-connection scarcity is a major near-term challenge because AI data centres cannot operate without reliable power and transmission access. Data-centre electricity use could rise from 415 TWh in 2024 to around 945 TWh by 2030, while total electricity generation needed for data centres may exceed 1,000 TWh by 2030, compared with about 460 TWh in 2024.
The U.S. plans to add 86 GW of utility-scale capacity in 2026, but new generation does not fully solve local grid and interconnection delays. Slow transmission expansion can postpone data-centre launches, raise backup-power and energy-contract costs, and leave capital tied up in unfinished projects. These constraints could reduce the market’s achievable CAGR by around 2.8%.
Challenges
| Challenge | (~) % CAGR | Geographic Relevance | Mitigation Horizon |
|---|---|---|---|
| Memory and networking supply | -2.0% | Global; concentrated in East Asia | Medium term (2 to 4 years) |
| AI engineering talent gap | -1.8% | Global | Medium term (2 to 4 years) |
| Model reliability assurance | -1.6% | Global | Medium term (2 to 4 years) |
| Data quality fragmentation | -1.4% | Global | Long term (4 years or more) |
| Cooling water constraints | -1.1% | Water-stressed regions globally | Long term (4 years or more) |
Memory and networking supply
Memory and networking supply is a major operational challenge because AI systems depend on high-bandwidth memory, advanced packaging, optical modules, switches, and cables. Global semiconductor sales reached USD 627.6 billion in 2024, up 19.1%, while worldwide chip sales were forecast to grow 11.2% in 2025.
Networking demand is also rising quickly, with NVIDIA reporting 142% growth in Data Center networking revenue in FY2026. Since maritime transport carries about 80% of global merchandise trade, supply concentration and logistics disruptions can increase lead times and inventory costs. These pressures may slow AI infrastructure deployment and create around a 2.0% drag on maximum market growth.
Opportunities
| Opportunity | (~) % CAGR | Geographic Relevance | Execution Window |
|---|---|---|---|
| Sovereign AI platforms | +2.7% | Europe, Middle East, Asia Pacific | Medium term (2 to 4 years) |
| Industry-specific AI stacks | +2.3% | Global | Medium term (2 to 4 years) |
| Edge inference monetization | +1.9% | Global | Long term (4 years or more) |
| Energy-aware workload scheduling | +1.6% | Power-constrained markets | Medium term (2 to 4 years) |
| AI infrastructure consolidation | +1.4% | North America, Europe, Asia Pacific | Short term (2 years or less) |
Sovereign AI platforms
Sovereign AI platforms represent a strong future opportunity as governments and regulated industries increasingly require local data hosting, national-security controls, and regional AI models. In the EU, general-purpose AI model obligations applied from 2 August 2025, while broader AI Act rules became applicable from 2 August 2026.
Digital adoption also supports this opportunity. Around 67% of adults in low- and middle-income economies used the internet in 2024, while global internet use reached about 74% in 2025. Growing demand for local-language AI, compliant cloud regions, and secure hosting could add around 2.7% to the market’s 22.4% baseline CAGR.
Key Players Analysis
Tier-1 leaders, including NVIDIA, Microsoft, Alphabet, Amazon Web Services (AWS), Meta, and Oracle, control the highest-value parts of the AI stack, including accelerated computing, cloud infrastructure, foundation models, and enterprise platforms.
Microsoft generated FY2025 revenue of USD 281.7 billion, with Azure exceeding USD 75 billion, up 34%. Alphabet reported USD 58.7 billion in Google Cloud revenue in 2025, USD 61.1 billion in R&D spending, and USD 91.4 billion in CapEx, with about 60% allocated to servers and 40% to data centres and networking. Tier-1 companies are estimated to capture around 55–65% of global AI-stack spending.
AWS generated USD 128.7 billion in 2025 revenue and USD 45.6 billion in operating income, while Amazon’s CapEx reached about USD 131.8 billion. Meta spent USD 57.4 billion, equal to 28.5% of revenue, on R&D and around USD 69.7 billion on CapEx. Oracle reported FY2025 cloud services and licence-support revenue of USD 44.0 billion, with OCI infrastructure contributing 74% of cloud revenue growth.
Tier-2 challengers compete through alternative accelerators, data platforms, enterprise AI software, sovereign cloud services, and open-weight models. Their main challenge is growing vertical integration by Tier-1 companies.
Top Key Players in the Market
- NVIDIA Corporation
- Microsoft Corporation
- Alphabet Inc. (Google)
- Amazon Web Services, Inc.
- OpenAI
- Anthropic PBC
- Meta Platforms, Inc.
- IBM Corporation
- Databricks, Inc.
- Snowflake Inc.
- Palantir Technologies Inc.
- Hugging Face
- Oracle Corporation
- Intel Corporation
- Advanced Micro Devices, Inc.
- Cisco Systems, Inc.
- Salesforce, Inc.
- SAP SE
- Siemens AG
- Hewlett Packard Enterprise Development LP
- Dell Technologies Inc.
- Super Micro Computer, Inc.
- Baidu, Inc.
- Alibaba Cloud
- Tencent Holdings Ltd.
- Huawei Technologies Co., Ltd.
- Cohere Inc.
- Mistral AI
- Stability AI Ltd.
- Together AI
- CoreWeave, Inc.
Recent Developments
- In February 2026, NVIDIA reported record FY2026 revenue of USD 215.9 billion, increasing 65% year over year. Data Center revenue reached USD 193.7 billion, up 68%, while fourth-quarter Data Center revenue rose 75% to USD 62.3 billion. The results highlight continued strong demand for GPUs, accelerated computing, networking, and complete AI infrastructure systems.
- In March 2026, Google completed its USD 32 billion all-cash acquisition of Wiz. Wiz became part of Google Cloud while continuing to support customers across major cloud environments. The acquisition strengthens Google’s position in cloud and AI security as enterprises increase AI workloads across multicloud environments.
Report Scope
| Report Features | Description |
|---|---|
| Market Value (2025) | USD 231.8 Billion |
| Forecast Revenue (2035) | USD 1773.4 Billion |
| CAGR (2026-2035) | 22.4% |
| Base Year for Estimation | 2025 |
| Historic Period | 2020-2024 |
| Forecast Period | 2026-2035 |
| Report Coverage | Revenue Forecast, Market Dynamics, Competitive Landscape, Recent Developments |
| Segments Covered | By Component: (AI Infrastructure/Hardware, AI Platforms/Software, Services), By Deployment: (Cloud-Based, On-Premises, Hybrid Deployment, Edge Deployment), By Stack Layer: (Infrastructure Layer, Data Layer, Model Layer, MLOps & Orchestration Layer, Application Layer, Security & Governance Layer), By Technology Type: (Generative AI, Machine Learning (ML), Natural Language Processing (NLP), Computer Vision, Speech & Voice AI, Agentic AI/Autonomous Agents), By Application: (Content Generation, Customer Service & Chatbots, Software Development Assistance, Workflow Automation, Analytics & Decision Intelligence, Cybersecurity & Fraud Detection, Recommendation & Personalization), By End-User Industry: (BFSI, Healthcare & Life Sciences, Retail & E-commerce, IT & Telecommunications, Manufacturing, Government & Public Sector, Media & Entertainment, Others) |
| Regional Analysis | North America – US, Canada; Europe – Germany, France, The UK, Spain, Italy, Rest of Europe; Asia Pacific – China, Japan, South Korea, India, Australia, Singapore, Rest of APAC; Latin America – Brazil, Mexico, Rest of Latin America; Middle East & Africa – GCC, South Africa, Rest of MEA |
| Competitive Landscape | NVIDIA Corporation, Microsoft Corporation, Alphabet Inc. (Google), Amazon Web Services, Inc., OpenAI, Anthropic PBC, Meta Platforms, Inc., IBM Corporation, Databricks, Inc., Snowflake Inc., Palantir Technologies Inc., Hugging Face, Oracle Corporation, Intel Corporation, Advanced Micro Devices, Inc., Cisco Systems, Inc., Salesforce, Inc., SAP SE, Siemens AG, Hewlett Packard Enterprise Development LP, Dell Technologies Inc., Super Micro Computer, Inc., Baidu, Inc., Alibaba Cloud, Tencent Holdings Ltd., Huawei Technologies Co., Ltd., Cohere Inc., Mistral AI, Stability AI Ltd., Together AI, CoreWeave, Inc. |
| Customization Scope | Customization for segments, region/country-level will be provided. Moreover, additional customization can be done based on the requirements. |
| Purchase Options | We have three licenses to opt for: Single User License, Multi-User License (Up to 5 Users), Corporate Use License (Unlimited Users and Printable PDF) |





























