


Report Overview
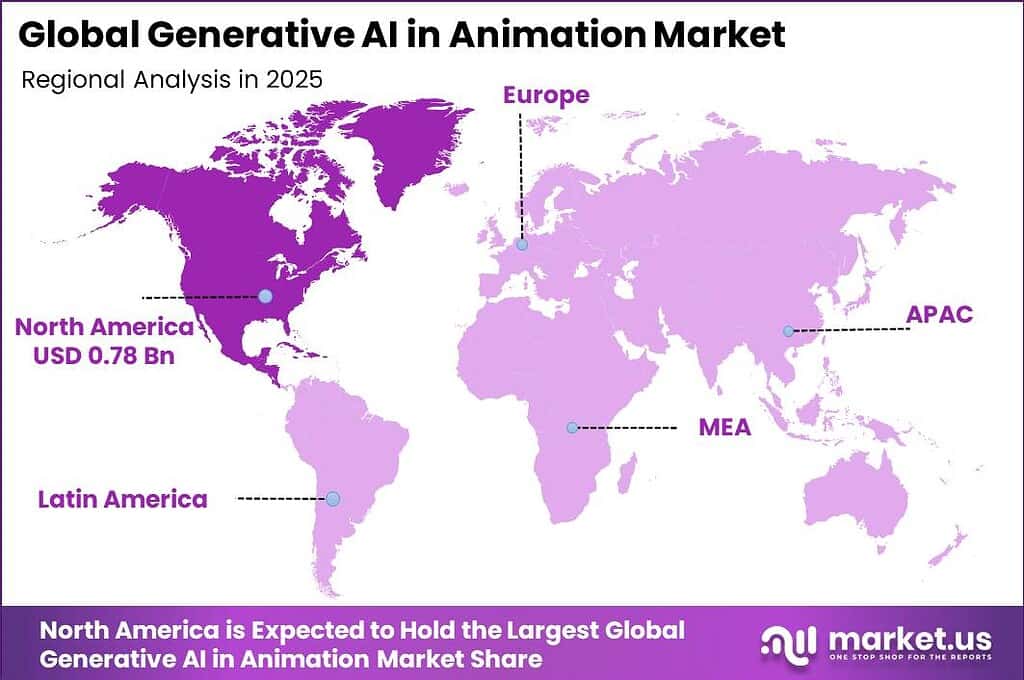
In 2025, the Generative AI in Animation Market was valued at USD 2.3 billion. The market is projected to grow at a CAGR of 34.2% during 2026–2035, reaching approximately USD 44.4 billion by 2035. North America dominated the global market in 2025, accounting for more than 34.1% of the total market share and generating approximately USD 0.78 billion in revenue.
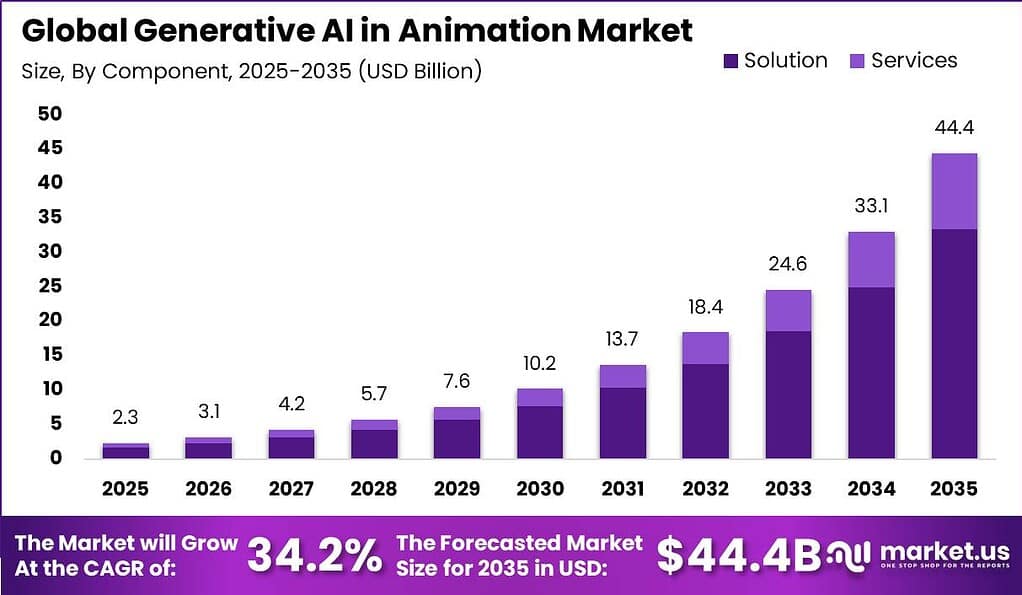
This sharp climb is rooted in how fast AI is being pulled into everyday content production. Across OECD countries, firm-level AI adoption rose to 20.2% in 2025, up from just 8.7% in 2023, more than doubling in two years, and the ICT and media-adjacent sector leads all industries with a 57.3% adoption rate, according to OECD data. In the UK, government figures show 51% of creative businesses now use AI tools compared with 33% across the wider economy, confirming that studios, not just tech firms, are the ones driving uptake.
Feeding this demand is a film and television industry that supports over 2 million jobs, pays out more than USD 200 billion in wages, and includes over 162,000 businesses in the US alone, based on Motion Picture Association figures. Add to that a video game sector where American consumers spent USD 60.7 billion in 2025, per the Entertainment Software Association, and where 212 million Americans, 67% of the country, actively play games.
As OECD data confirms that large firms adopt AI at nearly three times the rate of small firms, 52% versus 17.4%, North America’s concentration of major studios and publishers gives it a natural head start in embedding generative AI into animation pipelines, a lead expected to persist through the 2026–2035 forecast period as global content output keeps expanding.
Key Takeaway
- The global generative AI in animation market was valued at USD 2.3 billion in 2025.
- The global generative AI in animation market is projected to grow at a CAGR of 34.2% and is estimated to reach USD 44.4 billion by 2035.
- On the basis of component, the solution segment dominated the market, constituting 75.3% of the total market share.
- Based on deployment, cloud deployment dominated the market, accounting for 60.7% of the total market share.
- Based on type, transformers dominated the generative AI in animation market, with a market share of 52.3%.
- Among the applications, television and OTT held the largest share, accounting for 27.9% of the total market.
- In 2025, North America was the most dominant region in the generative AI in animation market, accounting for 34.1% of the total market share, equivalent to approximately USD 0.78 billion.
By Component
In 2025, Solution held a dominant market position, capturing more than a 75.3% share, as animation studios and content teams leaned heavily on ready-to-use software platforms rather than piecing together custom AI workflows.
This shift tracks a broader pattern across enterprises, where regular use of generative AI tools climbed to 88% in 2025 from 78% the year before, showing how quickly packaged tools moved from experimentation to daily use.
Toward the middle of 2026, adoption spread further into education and training content, where instructors needed animation output without hiring specialized technical staff. This practical, low-friction appeal is what kept packaged solutions firmly ahead of services and custom builds throughout the period.
By Deployment
Cloud captured more than a 60.7% share of deployment in 2025, as studios and independent creators increasingly moved their animation workloads off local machines and onto remote servers for speed and flexibility. Eurostat data shows that 66.78% of medium-sized European enterprises used purchased cloud computing services in 2025, up from 59.09% in 2023, reflecting how quickly production teams treated cloud infrastructure as a core tool rather than a backup option.
By late 2025, global cloud infrastructure spending had surged 29% year over year in the fourth quarter alone, the sixth straight quarter of 20%-plus growth, a pace that mirrored the rising compute demands of AI-driven rendering. Heading into 2026, roughly 94% of enterprises were running some form of cloud setup, and many production houses cited faster rendering turnaround and easier remote collaboration as the main draw.
By Type
Transformers accounted for more than a 52.3% share of model architecture use in 2025, powering most of the underlying systems that animation tools rely on to generate motion, dialogue-synced expressions, and scene transitions. Research activity around transformer designs has stayed intense, with academic surveys documenting their expanding role across vision and sequence-based tasks, including creative content generation, and noting over 750 citations for major transformer survey work.
Throughout 2025, developers continued refining these architectures for efficiency, with new variants aimed at cutting training costs while keeping output quality high. By early 2026, researchers were still publishing widely on transformer-based natural language processing, noting a consistent edge in handling long sequences of data, a trait that translates well to frame-by-frame animation generation.
By Application
Television and OTT captured more than a 27.9% share of application use in 2025, as streaming platforms leaned on AI-generated animation to fill content libraries faster and cheaper than traditional production allowed.
Global OTT users reached roughly 4.12 billion in 2025 and climbed to about 4.33 billion by 2026, giving platforms a growing audience hungry for constant new content. Connected TVs and smart TVs accounted for 58% of all streaming hours during this period, pushing platforms to prioritize formats that render well on bigger screens, which favored higher-quality AI animation pipelines.
Viewers also spent substantial time engaged with this content, averaging 17 hours per week on streaming platforms globally, a figure that kept pressure on studios to release fresh animated series and shorts regularly. By mid-2026, connected TV consumption patterns continued shaping investment decisions, since platforms wanted animated content that looked sharp on large displays without ballooning production budgets.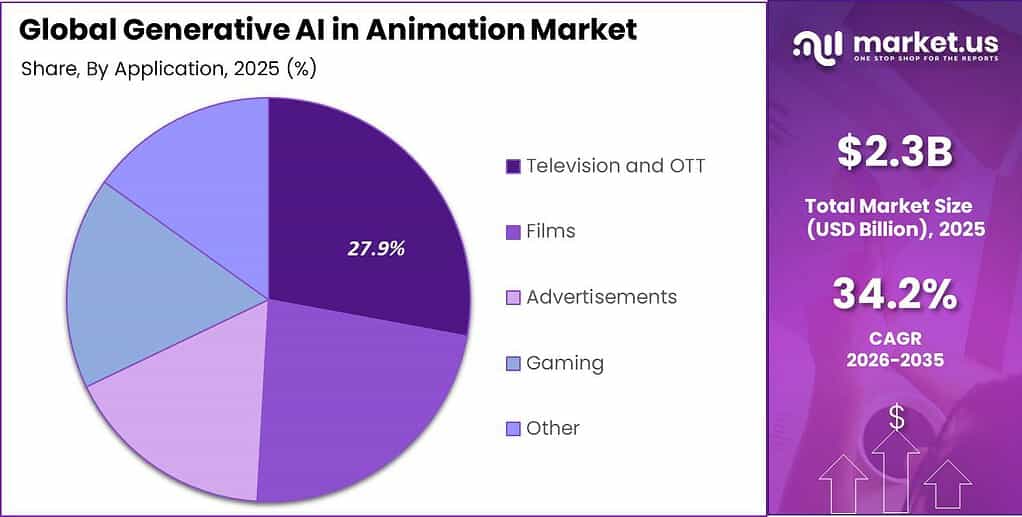
Key Market Segments
By Component
- Solution
- Services
By Deployment
- On-Premises
- Cloud
By Type
- Transformers
- GANs
- VAEs
- Other
By Application
- Television and OTT
- Films
- Advertisements
- Gaming
- Other
Market Dynamics
Drivers
| Driver | (~) % Impact on CAGR Forecast | Geographic Relevance | Impact Timeline |
|---|---|---|---|
| Text-to-video model maturation | +4.1% | North America, East Asia | Short term (≤ 2 years) |
| Studio SaaS licensing pivot | +3.4% | North America, Western Europe | Short term (≤ 2 years) |
| Mid-scene automation for VFX pipelines | +2.6% | Global | Medium term (2–4 years) |
| Explosive short-form content demand | +2.2% | Asia-Pacific, Latin America | Short term (≤ 2 years) |
| GPU/cloud rendering cost decline | +1.8% | Global | Medium term (2–4 years) |
| Localization and multilingual dubbing automation | +1.3% | Asia-Pacific, Middle East | Short term (≤ 2 years) |
Text-to-video model maturation
The root cause of this driver is the rapid architectural leap in diffusion and transformer-based video generation models, exemplified by commercial releases such as OpenAI Sora in December 2024 and successive keyframe-interpolation tools like MotionMaker launched June 4, 2025, which collectively compressed pre-visualization cycles that previously consumed 30% to 40% of pre-production budgets.
The quantitative mechanism is visible in production economics: studios integrating these tools report keyframe-to-motion turnaround dropping from multi-day cycles to under 24 hours, effectively lowering cost-per-second of animated footage by an estimated 25% to 35%, while independent creator adoption via app-based platforms which commanded roughly 70.6% share of tool usage in 2025 expanded the addressable customer base beyond studios into freelance and SMB segments.
Strategically, this is catalyzing a shift from per-seat licensing toward consumption-based SaaS and API monetization, compressing traditional software margins by an estimated 5 to 8 percentage points at incumbent tool vendors even as it accelerates topline volume, forcing legacy animation software providers to restructure pricing within a 12- to 18-month window to avoid customer attrition to newer generative-native entrants.
Restraints
| Restraint | (~) % Impact on CAGR Forecast | Geographic Relevance | Impact Timeline |
|---|---|---|---|
| Copyright infringement litigation exposure | -3.2% | North America, United Kingdom | Short term (≤ 2 years) |
| Union labor bans on unrestricted GenAI use | -2.4% | North America | Short term (≤ 2 years) |
| Training-data licensing cost escalation | -1.6% | Global | Medium term (2–4 years) |
| Enterprise capital allocation freezes | -1.1% | Global | Short term (≤ 2 years) |
| Model output rights ambiguity blocking distribution deals | -0.9% | North America, Western Europe | Short term (≤ 2 years) |
Copyright infringement litigation exposure
The root cause is the unresolved legal status of training-data provenance, with the number of active copyright infringement suits against generative AI companies more than doubling from roughly 30 at the end of 2024 to over 70 by the close of 2025, including marquee actions such as Getty Images’ suit against Stability AI seeking $1.7 billion in damages.
The quantitative bottleneck manifests as studios and platform vendors freezing commercial deployment of specific models pending discovery outcomes, with legal and compliance reserves at exposed vendors rising by an estimated 8% to 12% of operating budget and enterprise licensing negotiations extending by 4 to 6 months beyond typical procurement cycles.
The strategic business impact is a direct freeze on near-term sales conversion for risk-averse enterprise buyers particularly major studios and broadcasters who are withholding production-scale contracts until indemnification clauses are standardized, delaying projected CapEx commitments into subsequent fiscal years and compressing near-term realized revenue against the technically available baseline.
Challenges
| Challenge | (~) % CAGR Friction Drag | Geographic Relevance | Mitigation Horizon |
|---|---|---|---|
| Animator workforce displacement backlash | -1.9% | North America | Medium term (2–4 years) |
| Temporal consistency technical limits | -1.5% | Global | Medium term (2–4 years) |
| GPU compute supply constraints | -1.2% | East Asia, North America | Short term (≤ 2 years) |
| Fragmented output rights standards | -0.8% | Global | Long term (≥ 4 years) |
| AI-specialist talent shortage | -0.7% | North America, Western Europe | Medium term (2–4 years) |
Animator workforce displacement backlash
The structural vulnerability stems from labor-side resistance documented in the CVL Economics survey commissioned by The Animation Guild, where 75% of respondents confirmed GenAI tools already contributed to job elimination, reduction, or consolidation, and where an estimated 21.4% of film, television, and animation roles approximately 118,500 jobs in the U.S. are projected to be materially affected by 2026, with California alone absorbing roughly 39,500 of those job impacts.
The quantitative friction appears as renegotiated union contracts embedding GenAI usage caps and disclosure clauses, extending studio production-scheduling and HR compliance timelines by an estimated 15% to 20%, alongside reputational risk that dampens brand-safe advertiser and studio adoption.
Long-term corporate adjustment requires firms to build hybrid human-in-the-loop production models, retrain 30% to 40% of creative staff into AI-supervisory roles, and absorb transitional productivity dips of an estimated 10% over a multi-year workforce restructuring window, rather than pursuing full automation that would trigger continued labor and regulatory friction.
Opportunities
| Opportunity | (~) % Potential CAGR Upside | Geographic Relevance | Execution Window |
|---|---|---|---|
| Enterprise training and e-learning animation white space | +2.8% | North America, Asia-Pacific | Medium term (2–4 years) |
| Adjacent gaming and AR/VR asset generation | +2.1% | East Asia, North America | Medium term (2–4 years) |
| Untapped emerging-market creator monetization | +1.7% | Latin America, Southeast Asia, Middle East | Medium term (2–4 years) |
| Licensed IP-safe model roll-ups and M&A consolidation | +1.4% | North America, Western Europe | Long term (≥ 4 years) |
| On-device edge animation rendering | +1.0% | Global | Long term (≥ 4 years) |
Enterprise training and e-learning animation white space
This is classified as untapped future potential rather than a current driver because enterprise learning-and-development budgets remain overwhelmingly allocated to live-action video and static e-learning modules today, with generative animation penetration into corporate training content still in early pilot phases rather than embedded procurement, unlike the advertising and entertainment segments already reflected in the baseline.
The unit-economic shift is substantial: multilingual avatar-based generation platforms similar to those already validated in corporate communications use cases can compress per-minute training-video production cost by an estimated 60% to 70% versus traditional live-action shoots, while enabling margin expansion of 8 to 12 percentage points for vendors who bundle localization, captioning, and avatar animation into a single workflow rather than selling point tools separately.
Capturing this white space requires deliberate go-to-market investment into enterprise L&D software integrations and compliance-grade content certification absent this strategic action, the segment remains a significant portion of unmet demand sitting outside the current baseline trajectory rather than a passively accruing tailwind.
Geopolitical Impact Analysis
Escalating US-China technology decoupling is directly reshaping the manufacturing and pricing structure of the Generative AI in Animation Market, which relies heavily on high-performance GPUs and cloud compute infrastructure. Following Proclamation 11,002 issued on January 14, 2026, the US imposed a 25% Section 232 tariff on advanced computing chips such as NVIDIA’s H200 and AMD’s MI325X when transiting US territory en route to China, while capping export volumes at 50% of domestic shipment levels.
This tariff structure, combined with mandatory third-party testing requirements that force Taiwan-fabricated chips to route through the US before re-export, effectively functions as an export tax and raises compliance costs for animation studios and AI rendering platforms sourcing compute hardware from Asia-Pacific supply chains. The World Trade Organization has flagged that broader export controls covering chip-making equipment now restrict sales to 136 Chinese entities, tightening global GPU availability and pushing up procurement lead times for AI-animation render farms dependent on advanced silicon.
Parallel to chip restrictions, energy volatility and logistics disruption are compounding cost pressures on data-center-dependent animation pipelines. The International Energy Agency projects that global data center electricity consumption will grow at approximately 15% annually through 2030, reaching around 945 TWh, directly inflating the operating expenses of cloud-based rendering and generative AI training infrastructure that animation studios lease.
Simultaneously, UNCTAD-tracked freight disruptions tied to Red Sea rerouting drove container shipping rates on the China-Mediterranean corridor up as much as 120% between October 2023 and June 2024, with July 2026 spot rates for Far East routes surging to between $7,000 and $13,000 per FEU, delaying delivery of specialized servers, GPUs, and peripheral hardware components essential to animation production studios by several weeks per shipment. Together, these tariff, energy, and logistics shocks are compressing margins and incentivizing regionalized compute sourcing across the animation technology value chain.
Regional Analysis
North America commands the Generative AI in Animation Market with a dominant 34.1% share and a market value of USD 0.78 Billion, underpinned by robust statistical evidence across its AI and creative industries. US-based firms captured 97% of global generative AI deal value in H1 2025, with GenAI VC funding surging to USD 49.2 Billion in that period alone, outpacing the full-year 2024 total of USD 44.2 Billion. This capital concentration reflects a broader trend where AI and machine learning deals accounted for 65.4% of all US venture capital deal value in 2025, totaling USD 222 Billion out of USD 339 Billion deployed nationally, up sharply from just 47.2% in 2024.
Of the 39 recognized AI unicorns worldwide, 29 are headquartered in the US, compared to only three in Europe and two in Israel, underscoring the region’s innovation density feeding directly into animation-focused AI tools. The US animation industry itself employs more than 220,000 professionals with a projected 5% annual growth rate, providing a deep talent pool for generative AI integration into production pipelines. The Bureau of Labor Statistics further reports a median annual wage of USD 99,800 for special effects artists and animators, with roughly 5,000 job openings projected annually through 2034. Canada strengthens the region’s position through its visual effects sector, which generated CAD 1.9 Billion in 2023, nearly tripling 2015 revenue, supported by roughly 100 VFX studios concentrated in Vancouver and Toronto.
The Canada visual effects market alone reached USD 214.0 Million in 2024, with AI increasingly cited as a core technology shaping production workflows. Enterprise-wide, US companies spent USD 37 Billion on generative AI in 2025, up 3.2x from USD 11.5 Billion in 2024, signaling accelerating institutional adoption that extends into creative and animation applications. This combination of concentrated venture capital, skilled labor supply, and rising enterprise AI spend explains North America’s statistically-grounded leadership in the generative AI animation space.
Key Regions and Countries
North America
- US
- Canada
Europe
- Germany
- France
- The UK
- Spain
- Italy
- Rest of Europe
Asia-Pacific
- China
- Japan
- South Korea
- India
- Australia
- Rest of APAC
Latin America
- Brazil
- Mexico
- Rest of Latin America
Middle East & Africa
- GCC
- South Africa
- Rest of MEA
Key Players Analysis
The Generative AI in Animation market exhibits a clear tiered structure dominated by platform-scale technology incumbents. Tier-1 Leaders are anchored by Adobe, whose FY2025 total revenue reached approximately $23.8 billion, with Digital Media (housing Firefly) contributing roughly $17.25–17.4 billion, up 11% YoY, and Firefly itself generating over 22 billion assets by April 2025, with enterprise contracts accounting for 61% of Firefly-attributable revenue.
Alphabet, via Google DeepMind’s Veo and Imagen models, reported Q3 FY2025 revenue of $102.3 billion company-wide, with revenue from products built on its generative AI models growing over 200% YoY and Veo 3 crossing 230 million videos generated. Nvidia commands infrastructure dominance underpinning nearly all generative animation pipelines, posting FY2025 revenue of $130.5 billion (up 114% YoY), R&D spend of $12.9 billion for the year, and Professional Visualization/Omniverse-adjacent revenue of $1.9 billion, up 21% YoY.
Tier-2 Challengers include Autodesk, whose FY2025 R&D expenditure reached $1.485 billion (8.16% increase YoY), reflecting steady but comparatively modest AI-animation tooling investment versus hyperscalers, alongside pure-play generative video specialist Runway, which hit an estimated $90 million in annualized revenue by mid-2025, targeting a $265–300 million run rate by year-end, and raised a $315 million Series E in February 2026 at a $5.3 billion post-money valuation, backed by Nvidia, Fidelity, and Adobe Ventures.
Strategic M&A and licensing activity is reshaping competitive positioning: Disney’s $1 billion equity investment in OpenAI, tied to a three-year Sora licensing deal covering 200+ Disney, Marvel, Pixar, and Star Wars characters, signals studio-level capitulation to third-party generative infrastructure rather than in-house model development.
Top Key Players in the Market
- DeepMotion
- Adobe
- Gooey.AI
- Stability AI
- Oddtoe
- Krikey Inc.
- Runway
- Steve AI
- RADiCAL
- Synthesia
- Plask
- Kinetix
Recent Developments
- In February 2026, Runway AI raised $315 million in Series E funding led by General Atlantic, with NVIDIA, Fidelity, AllianceBernstein, Adobe Ventures, Mirae Asset, and AMD Ventures participating, bringing its valuation to $5.3 billion to support the development of next-generation AI video and animation models.
- In May 2026, Netflix formally launched INKubator, an in-house generative AI animation studio focused initially on short-form content, with plans to expand into long-form production and supported by new AI-focused production and engineering roles.
Report Scope
| Report Features | Description |
|---|---|
| Market Value (2025) | USD 2.3 Billion |
| Forecast Revenue (2035) | USD 44.4 Billion |
| CAGR (2026-2035) | 34.2% |
| Base Year for Estimation | 2025 |
| Historic Period | 2020-2024 |
| Forecast Period | 2026-2035 |
| Report Coverage | Revenue Forecast, Market Dynamics, Competitive Landscape, Recent Developments |
| Segments Covered | By Component (Solution, Services), By Deployment (On-Premises, Cloud), By Type (Transformers, GANs, VAEs, Other Types), By Application (Television and OTT, Films, Advertisements, Gaming, Other Applications) |
| Regional Analysis | North America – US, Canada; Europe – Germany, France, The UK, Spain, Italy, Rest of Europe; Asia-Pacific – China, Japan, South Korea, India, Australia, Singapore, Rest of APAC; Latin America – Brazil, Mexico, Rest of Latin America; Middle East & Africa – GCC, South Africa, Rest of MEA |
| Competitive Landscape | DeepMotion, Adobe, Gooey.AI, Stability AI, Oddtoe, Krikey Inc., Runway, Steve AI, RADiCAL, Synthesia, Plask, Kinetix |
| Customization Scope | Customization for segments, region/country-level will be provided. Moreover, additional customization can be done based on the requirements. |
| Purchase Options | We have three licenses to opt for: Single User License, Multi-User License (Up to 5 Users), Corporate Use License (Unlimited Users and Printable PDF) |





























