
Quick Navigation
Report Overview
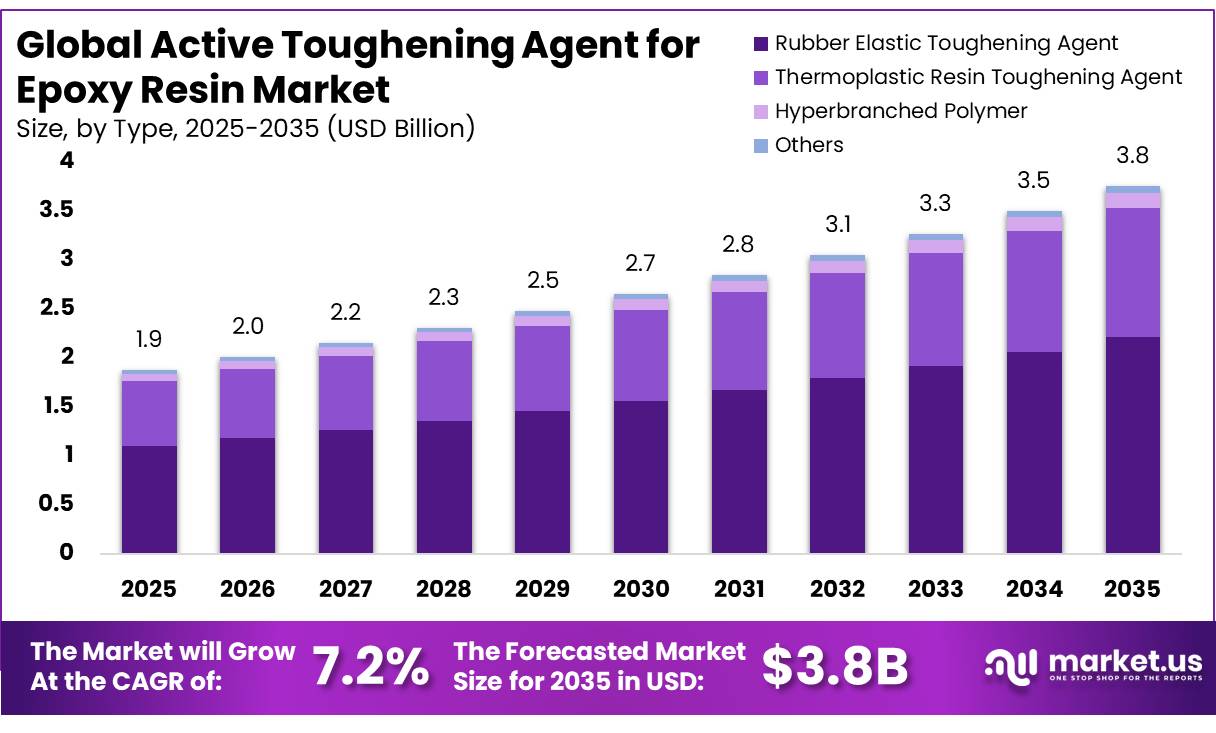
In 2025, the Global Active Toughening Agent for Epoxy Resin Market was valued at USD 1.9 billion, and between 2026 and 2035, this market is estimated to register a CAGR of 7.2%, reaching about USD 3.8 billion by 2035. In 2025, Asia Pacific led the market, achieving over 55.0% share with a revenue of USD 1.03 Billion.
The active toughening agent for epoxy resin market is driven by the need to improve the fracture toughness, impact resistance, and fatigue performance of epoxy systems used in demanding structural applications. Core-shell rubbers and liquid elastomers address this directly, chemically integrating into the epoxy network at the molecular level to intercept crack propagation before catastrophic failure occurs.
- According to the British Coatings Federation (BCF), in 2024, the United Kingdom’s paint and coatings industry was valued at approximately £3.2 billion and supplied around 703 million litres of coatings annually. In 2024, FEICA (the Association of the European Adhesive and Sealant Industry) reported that approximately 5 million tonnes of adhesives and sealants were produced and used across Europe each year, with manufacturers offering more than 250,000 product formulations.
Key Takeaways
- The Global Active Toughening Agent for Epoxy Resin Market was valued at USD1.9 billion in 2025.
- The market is projected to grow at a CAGR of 7.2% and is estimated to reach USD 3.8 billion by 2035.
- Rubber Elastic Toughening Agent accounted for a leading 58.8% share of the market in 2025, driven by its unique ability to prevent micro-crack propagation through phase separation.
- Electronics accounted for a leading 43.4% share of the market in 2025, driven by the strict reliability requirements of microelectronic packaging and underfill applications.
- Building & Construction accounted for a leading 48.5% share of the market in 2025, driven by heavy-duty volumetric usage in civil infrastructure repairs and structural anchoring.
- Asia Pacific accounted for a leading 55.0% share of the market in 2025, driven by the concentration of epoxy resin manufacturing, electronics production, and construction activity across the region.
The market spans reactive liquid rubber modifiers, rigid thermoplastics, and hyperbranched polymers each selected based on the viscosity tolerance and cross-linking architecture of the target application. Automotive manufacturing is currently the fastest-moving demand node, particularly high-pressure resin transfer molding platforms where toughened epoxy systems must cure in minutes without sacrificing structural integrity.
Market Segmentation
Type Analysis
Rubber elastic toughening agent represents the dominant Segment in the Market.
Rubber elastic toughening agents represent the dominant segment in the Active Toughening Agent for Epoxy Resin Market, accounting for a 58.8% share due to their Liquid elastomer additives like CTBN (carboxyl-terminated butadiene-acrylonitrile) and ATBN (amine-terminated butadiene-acrylonitrile), which are special rubbery modifiers that can mix into epoxy systems and then naturally separate during curing.
- According to the International Rubber Study Group (IRSG), global synthetic rubber consumption reached 291 million metric tonnes in 2024, up 1.1% from 16.107 million metric tonnes in 2023.
The continued growth in synthetic elastomer consumption supports the availability and use of butadiene-based materials, including CTBN and ATBN rubber modifiers, which are widely incorporated into epoxy resin systems to improve fracture toughness, impact resistance, and durability in demanding industrial applications.
Application Analysis
Electronics Held a Major Share of the Active Toughening Agent for Epoxy Resin Market.
Electronics, accounting for 43.4% of the market, represent the dominant technology segment due to their worldwide need to protect delicate semiconductor architectures and surface-mount components against volatile thermal-mechanical loads. Epoxy materials used in this area must handle tough environmental conditions, which means they need high-quality, strong materials to stop small cracks from forming in the structure.
- According to the World Semiconductor Trade Statistics (WSTS), as cited by the Semiconductor Industry Association (SIA), global semiconductor sales reached approximately US$630.5 billion in 2024. The strong level of chip production and sales supports demand for advanced packaging materials, epoxy encapsulants, and high-performance toughening agents used to protect electronic components from thermal and mechanical stress.
The coating segment shows a lot of potential, focused on micro-encapsulated self-healing epoxy barriers for use in offshore maritime structures. A real-world example is protective coatings that use flexible materials to stop the spread of tiny cracks and block moisture from causing corrosion. Factors influencing this development include the long-term use of these coatings to extend the life of assets by protecting them from cavitation erosion and abrasive wear.
End Use Analysis
Active Toughening Agents for Epoxy Resin Are Mostly Utilized in the Building & Construction Sector.
The Building & Construction segment, accounting for 48.5% of the active toughening agent for epoxy resin market, remains the dominant end-use category by the massive consumption of specialized epoxy systems in infrastructural retrofitting, structural concrete bonding, commercial flooring, and anchoring assemblies. Given the harsh operating environments of civil infrastructure, base materials must possess exceptional load-bearing capacity and high crack resistance.
- According to the U.S. Census Bureau, the value of construction put in place reached a seasonally adjusted annual rate of approximately US$2.20 trillion in February 2025, up 9% from February 2024, supporting demand for structural adhesives, epoxy flooring systems, and concrete repair materials.
The Marine segment is emerging rapidly, driven by the construction of massive composite blades for offshore wind and tidal turbines. These giant structures face relentless bending and dynamic wave fatigue, making active tougheners essential to prevent cracking and layer peeling. This shift is driven by the need to survive 25 years of harsh saltwater, sun exposure, and heavy mechanical stress. Standard resins absorb water easily, leading to hidden internal micro-cracks and fiber detachment.
Key Market Segments
By Type
- Rubber Elastic Toughening Agent
- Thermoplastic Resin Toughening Agent
- Hyperbranched Polymer
- Others
By Application
- Electronics
- Coating
- Adhesive
- Others
By End-use
- Building & Construction
- Automotive & Transportation
- Electrical & Electronics
- Marine
- Others
Driver Analysis
BPA-related regulation accelerates reformulation toward alternative modifier packages.
Regulation is not banning epoxy broadly, but it is forcing sharper chemistry choices in BPA-linked applications, especially food-contact and adjacent coating systems, which then cascades into reformulation work across resin and additive suppliers. The EU prohibition under Regulation (EU) 2024/3190 has applied from 20 January 2025, with transitional deadlines extending to 20 July 2026, 20 July 2028, 20 January 2028, and 20 January 2029 depending on article type, while California’s AB 1148 analysis points to a state-level food-packaging prohibition from 1 January 2027 for intentionally added bisphenols above a DTSC-set limit.
In practice, this increases R&D spending on non-BPA epoxy backbones and alternative toughening packages that preserve flexibility, adhesion, and crack resistance after backbone substitution, thereby boosting demand for reactive liquid rubbers, core-shell particles, thermoplastic modifiers, and other active toughening solutions in regulated end uses.
Drivers Impact Analysis
| Driver | (~) % Impact on CAGR | Geographic Relevance | Impact Timeline |
|---|---|---|---|
| Aerospace lightweighting raises demand for tougher epoxy matrices | +1.6% | North America core, EU aerospace belt, Japan | Medium term (2-4 years) |
| Wind blade and composite recycling pushes reformulated toughening systems | +1.2% | US, EU, China spill-over | Medium term (2-4 years) |
| BPA-related regulation accelerates reformulation toward alternative modifier packages | +1.4% | EU core, California spill-over, North America food-packaging adjacencies | Short term (≤ 2 years) |
| Infrastructure protection and FRP retrofit expands durable epoxy use | +1.0% | North America core, GCC, India, Southeast Asia | Short term (≤ 2 years) |
| EV power electronics and high-reliability electrical systems need crack-resistant epoxy | +1.3% | China, North America, EU, Korea, Japan | Medium term (2-4 years) |
| Trade and supply-chain controls on epoxy inputs favor localized high-performance formulations | +0.8% | US, EU, ASEAN export hubs | Short term (≤ 2 years) |
Restraint Analysis
TSCA New-Chemicals Review Delays Impede Qualification of Next-Gen Toughening Chemistries
EPA’s new chemicals review programme under TSCA has a well-documented history of statutory non-compliance on review timelines, and the EPA Office of Inspector General’s FY 2026 Top Management Challenges report confirms that “EPA’s reviews of new chemicals under TSCA were not being completed within the statutory time frame,” with systemic backlog conditions persisting despite process improvements; while the Trump Administration raised LVE risk assessment throughput from 15 to 53 per month a 250%+ acceleration and cleared over 3,000 TSCA backlog submissions by October 2025, the 90-day statutory window for full pre-manufacture notices (PMNs) covering novel toughening chemistries such as modified polysiloxane flexibilisers, bio-based anhydride rubber hybrids, and reactive hyperbranched modifiers frequently extends to 6–18 months when risk evaluation triggers additional data requirements.
This creates dual commercial friction for innovators: first, delayed market entry forfeits premium pricing windows in fast-moving application segments like EV battery encapsulants and high-reliability aerospace adhesives; second, regulatory uncertainty discourages R&D capital allocation, with each PMN cycle estimated to consume $200,000–$500,000 in compliance, testing, and dossier preparation before any commercial revenue, effectively raising the breakeven volume threshold and consolidating market share toward incumbent CTBN and CSR chemistries with established TSCA inventory status.
Restraint Impact Analysis
| Restraint | (~) % Impact on CAGR Forecast | Geographic Relevance | Impact Timeline |
|---|---|---|---|
| Natural rubber & elastomer feedstock price volatility constrains modifier cost economics | –1.4% | India, Southeast Asia, EU, North America spill-over | Short term (≤ 2 years) |
| Superfund excise tax on acrylonitrile-butadiene rubber raises domestic formulation costs | –1.1% | North America core (US primary) | Short term (≤ 2 years) |
| TSCA new-chemicals review delays impede qualification of next-gen toughening chemistries | –0.9% | North America core | Medium term (2–4 years) |
| EU BPA/SVHC reformulation burden increases R&D cost and extends time-to-market | –1.2% | EU core, UK, Turkey spill-over | Short term (≤ 2 years) |
| Section 301 & trade tariff uncertainty on Chinese chemical intermediates disrupts supply | –0.8% | North America, ASEAN corridors | Short term (≤ 2 years) |
| High energy intensity of chemical manufacturing compresses margins amid volatile energy prices | –0.7% | US, EU, India | Medium term (2–4 years) |
Opportunity Analysis
Formulation-as-a-service and licensing monetization
This is an opportunity rather than a driver because it depends on a business-model change, not just end-market growth: most suppliers still monetize by selling kilograms of modifier, even though formulation know-how, cure-window optimization, and qualification support increasingly carry more value than raw chemistry alone.
The upside path is to bundle modifier chemistry with paid formulation services, licensing of validated recipes, and annual technical-support retainers; that can convert one-time additive sales into recurring revenue, reduce customer time-to-approval by 3–9 months in regulated applications, and expand EBITDA margins by an estimated 4–8 points for specialty suppliers because technical service revenue is less raw-material-intensive than tonnage sales.
Opportunity Impact Analysis
| Opportunity | (~) % Potential CAGR | Geographic Relevance | Execution Window |
|---|---|---|---|
| Recyclable epoxy tougheners for circular composites | +1.7% | North America core, EU, China wind corridors | Medium term (2-4 years) |
| Bio-based tougheners for federal procurement channels | +1.3% | US core, EU green-public markets | Medium term (2-4 years) |
| EV battery and power electronics grade modifier platforms | +1.5% | China, North America, EU, Korea, Japan | Short term (≤ 2 years) |
| AAM and OOA aerospace qualification white space | +1.1% | North America core, EU aerospace belt | Medium term (2-4 years) |
| Formulation-as-a-service and licensing monetization | +0.9% | Global, led by North America and EU | Short term (≤ 2 years) |
| M&A roll-up of niche modifier and testing assets | +0.8% | North America, EU, India | Medium term (2-4 years) |
Challenges Analysis
TSCA review timeline uncertainty
TSCA is not freezing the market, but persistent review-timeline uncertainty for new chemistries creates a continuous friction drag on growth by making it harder to plan launches for advanced toughening agents that rely on novel liquid rubbers, core shell particles, or reactive networks; the EPA OIG’s FY 2026 Top Management Challenges report confirms that TSCA new chemical reviews have repeatedly failed to meet statutory deadlines, and stresses that EPA’s ability to identify chemical risks is challenged by resource constraints and inefficient processes, even after the agency cleared more than 3,000 backlogged Section submissions and accelerated selected LVE cases.
- Public statistics show that only a minority of active new-chemical cases are resolved within the mandated 90-day window, with many taking 6–12 months or more when data requests or extended risk evaluations are triggered.
For toughening-agent suppliers, this does not stop current sales of inventory-listed chemistries but slows migration to higher-performance or more sustainable variants by forcing companies to build portfolio roadmaps with 6–18 month regulatory buffers, inflating working R&D capital by perhaps 20–30% versus a frictionless scenario and stretching payback periods on innovation programs; strategic mitigation requires embedding regulatory affairs into portfolio management, staging launches in lower-friction jurisdictions first, and designing “TSCA-light” incremental modifications to existing molecules that can be reviewed faster than fully novel agents, which collectively takes 2–4 years to institutionalize across mid-size chemical producers.
Challenges Impact Analysis
| Challenge | (~) % CAGR Friction Drag | Geographic Relevance | Mitigation Horizon |
|---|---|---|---|
| TSCA review timeline uncertainty | -1.0% | North America core | Medium term (2-4 years) |
| Advanced chemical manufacturing skills gap | -0.9% | US, EU industrial hubs | Long term (≥ 4 years) |
| Global shipping route and transit volatility | -0.8% | EU, APAC logistics corridors, North America import nodes | Medium term (2-4 years) |
| Complex multi-layer regulatory compliance overhead | -0.9% | EU regulatory hubs, North America, university labs | Long term (≥ 4 years) |
| Digital and quality data infrastructure fragmentation | -0.7% | Global, more acute in emerging markets | Medium term (2-4 years) |
| Capital intensity for disruptive process scale-up | -0.8% | US, EU, selected APAC producers | Long term (≥ 4 years) |
Geopolitical Impact Analysis
Geopolitical Realignment and Supply Chain Fragmentation Reshaping the Epoxy Resin Market.
The continuing geopolitical conflicts, the Russia-Ukraine war, and growing tensions in the Middle East’s maritime areas have greatly changed the global market for active toughening agents. These conflicts have caused two major economic changes at the same time: big problems with getting raw materials and a huge increase in demand for aerospace and defense products.
Wartime trade embargoes, sanctions, and blockades in key sea lanes, such as the Black Sea and the Red Sea, have greatly disrupted the movement of chemical products. The production of advanced elastomeric and thermoplastic modifiers depends on petrochemical materials like butadiene, acrylonitrile, and benzene. Unstable oil prices and energy shortages in certain regions have led to much higher manufacturing costs. Now, ships carrying goods from Asian suppliers to Europe and North America must take longer routes around Africa. This has caused freight delays of up to 25 days and high extra shipping fees, leading to shortages of important chemical additives in local markets.
The demand for materials has shifted strongly towards high-quality, defense-grade substances due to military needs. Current military strategies focus on creating strong, lightweight drones, protective shields, and accurate missile components. These uses rely on advanced carbon fiber composites that need special treatments, such as Core-Shell Rubber or polyethersulfone, to avoid breaking apart under extreme pressure or explosions.
Regional Analysis
Asia Pacific Held the Largest Share of the Active Toughening Agent for the epoxy resin market.
In 2025, the Asia Pacific dominated the global active toughening agent for epoxy resin market, holding about 55.0% of the total global consumption, due to the region’s local economic growth and big industrial developments. Data from World Population Review, the fast-growing populations and urban areas in China, India, and Southeast Asia keep pushing demand for large amounts of products used at home. China plays a major role in this because of its huge semiconductor packaging industry and vast electronics manufacturing sectors.
North America and Europe lead the market with advanced technical innovations rather than large volumes of raw materials. North America stays strong because of its well-established aerospace, defense, and high-performance automotive manufacturing. In this region, specialized core-shell rubber (CSR) particles are in high demand.
Key Regions and Countries
- North America
- The US
- Canada
- Europe
- Germany
- France
- The UK
- Spain
- Italy
- Russia & CIS
- Rest of Europe
- APAC
- China
- Japan
- South Korea
- India
- ASEAN
- Rest of APAC
- Latin America
- Brazil
- Mexico
- Rest of Latin America
- Middle East & Africa
- GCC
- South Africa
- Rest of MEA
Key Players Analysis
DuPont de Nemours, Inc. operates across more than 70 countries and generated approximately US$12.4 billion in net sales in 2025. The company continues to strengthen its advanced materials portfolio, supplying high-performance solutions for epoxy resin applications used in electronics, automotive, and industrial sectors. It invests around US$500 million annuallY in research and development and employs nearly 24,000 people worldwide. Gabriel Performance Products is a specialized manufacturer of epoxy curing agents and performance additives serving customers in over 50 countries. The company operates multiple manufacturing and technical support facilities, with a product portfolio exceeding 300 specialty formulations.
CVC Thermoset Specialties focuses on epoxy modifiers, reactive diluents, and toughening agents for high-performance thermoset systems. The company offers more than 200 specialty products designed for adhesives, composites, coatings, and civil engineering applications. Its materials are supplied across 30+ countries through a global distribution network.
Mingtai is a Chinese specialty chemical manufacturer supplying epoxy resin additives, curing agents, and active toughening agents to domestic and international customers. The company serves clients in more than 20 countries and maintains manufacturing facilities with an annual production capacity exceeding 20,000 metric tons of specialty chemical products. Its portfolio supports applications in wind energy, electronics, construction, and automotive industries.
The Major Players In The Industry
- Kaneka Corporation
- Solvay S.A.
- Emerald Materials
- Huntsman Corporation
- Dow Inc.
- DuPont de Nemours, Inc.
- Evonik Industries AG
- Gabriel Performance Products
- Wacker Chemie AG
- CVC Thermoset Specialties
- Senmao
- Mingtai
- Qingming
- Jingyi
- Sanmu
- Qingyang
- Huaxing
- Xinyehao
- Hengchuang
- Changhuan
- Notes on
- Others
Key Development
- In May 2026, Kaneka Corporation signed a technical production agreement with advanced defense and aerospace companies to scale up the production of core-shell rubber (CSR) nanostructures. This expansion, guided by industrial scaling methods, increases the output of high-purity pre-dispersed materials to meet the requirements for impact resistance in next-generation aircraft matrix systems.
- In April 2026, The Dow Chemical Company completed a sustainable procurement and technical agreement focused on bio-based reactive polymers. This agreement was assessed based on public trade regulations and ensures the use of locally sourced, low-viscosity structural components that meet international environmental standards without lowering the glass transition temperature of the cured materials.
Report Scope
| Report Features | Description |
|---|---|
| Report Features | Description |
| Market Value (2025) | USD 1.9 Bn |
| Forecast Revenue (2035) | USD 3.8 Bn |
| CAGR (2026-2035) | 7.2% |
| Base Year for Estimation | 2025 |
| Historic Period | 2020-2024 |
| Forecast Period | 2026-2035 |
| Report Coverage | Revenue Forecast, Market Dynamics, Competitive Landscape, Recent Developments |
| Segments Covered | By Type (Rubber Elastic Toughening Agent, Thermoplastic Resin Toughening Agent, Hyperbranched Polymer, Others), By Application (Electronics, Coating, Adhesive, Others), By End-use (Building & Construction, Automotive & Transportation, Electrical & Electronics, Marine, Others) |
| Regional Analysis | North America – The US & Canada; Europe – Germany, France, The UK, Spain, Italy, Russia & CIS, Rest of Europe; APAC– China, Japan, South Korea, India, ASEAN & Rest of APAC; Latin America– Brazil, Mexico & Rest of Latin America; Middle East & Africa– GCC, South Africa, & Rest of MEA |
| Competitive Landscape | Kaneka Corporation, Solvay S.A., Emerald Materials, Huntsman Corporation, Dow Inc., DuPont de Nemours, Inc., Evonik Industries AG, Gabriel Performance Products, Wacker Chemie AG, CVC Thermoset Specialties, Senmao, Mingtai, Qingming, Jingyi, Sanmu, Qingyang, Huaxing, Xinyehao, Hengchuang, Changhuan, Notes on, Others |
| Customization Scope | Customization for segments, region/country-level will be provided. Moreover, additional customization can be done based on the requirements. |
| Purchase Options | We have three licenses to opt for: Single User License, Multi-User License (Up to 5 Users), Corporate Use License (Unlimited Users and Printable PDF) |


