


Quick Navigation
- Report Overview
- Key Takeaways
- By Product Type Analysis
- By Production Method Analysis
- By End-User Analysis
- By Packaging Analysis
- By Distribution Channel Analysis
- Key Market Segments
- Driver Analysis
- Restraint Analysis
- Opportunity Analysis
- Challenges Analysis
- Geopolitical Impact Analysis
- Regional Insights
- Key Players Analysis
- Recent Developments
- Report Scope
Report Overview
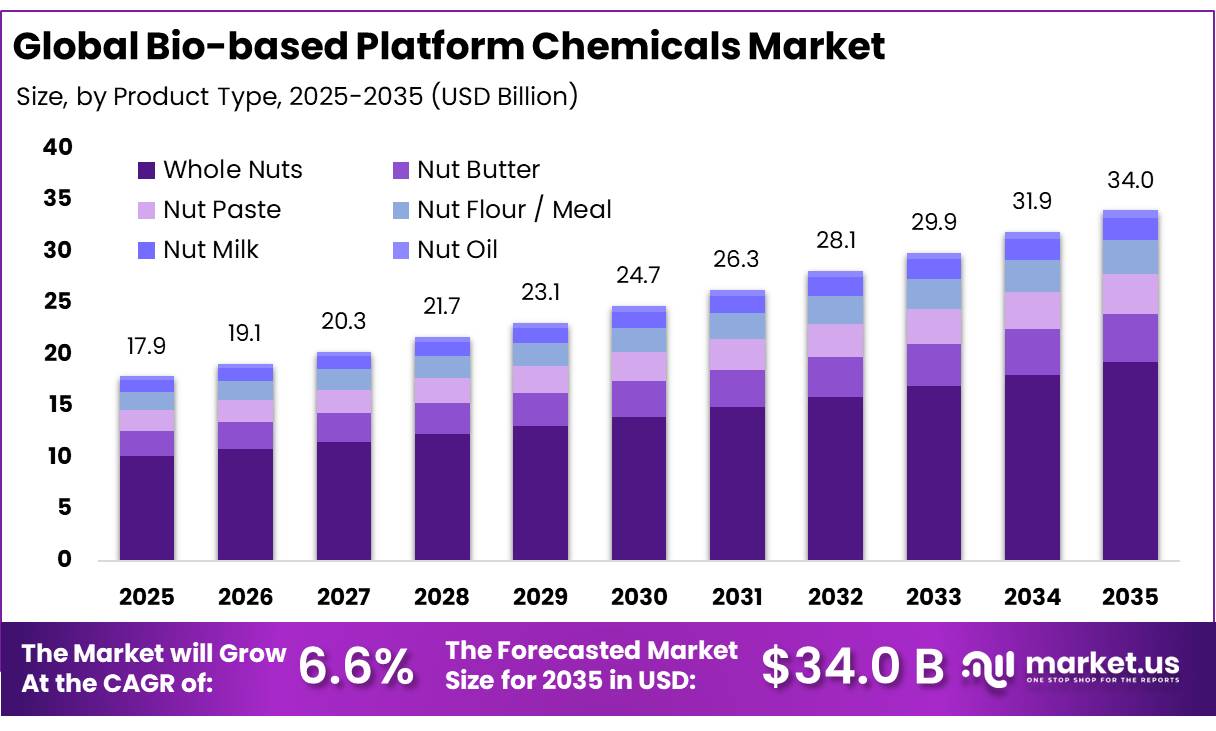
In 2025, the Global Bio-based Platform Chemicals Market was valued at USD 17.09 billion, and between 2026 and 2035, this market is estimated to register a CAGR of 6.6% reaching about USD 34.0 billion by 2035. In 2025, Asia Pacific led the market achieving over 36.0% share with a revenue of USD 6.44 Billion.
Bio-based platform chemicals are becoming a bridge between renewable feedstocks and chemical manufacturing. They include organic acids, alcohols, diols, furans and intermediates used in polymers, coatings, solvents, resins and specialty chemicals. The case is strengthened by the chemical sector’s dependence on fossil feedstocks.
- The IEA states that industry uses around 20% of global oil demand, while two-thirds of industrial oil demand is consumed as feedstock in the chemicals industry. The U.S. Department of Energy notes that more than 96% of manufactured goods rely on chemical-sector products. This creates a substitution opportunity for biomass, waste-derived carbon and fermentation routes.
Key Takeaways
- Bio-based Platform Chemicals Market was valued at USD 17.09 billion, this market is estimated to register a CAGR of 6.6% reaching about USD 34.0 billion by 2035.
- Whole Nuts held a dominant market position, capturing more than a 56.70% share.
- Conventional held a dominant market position, capturing more than a 86.00% share.
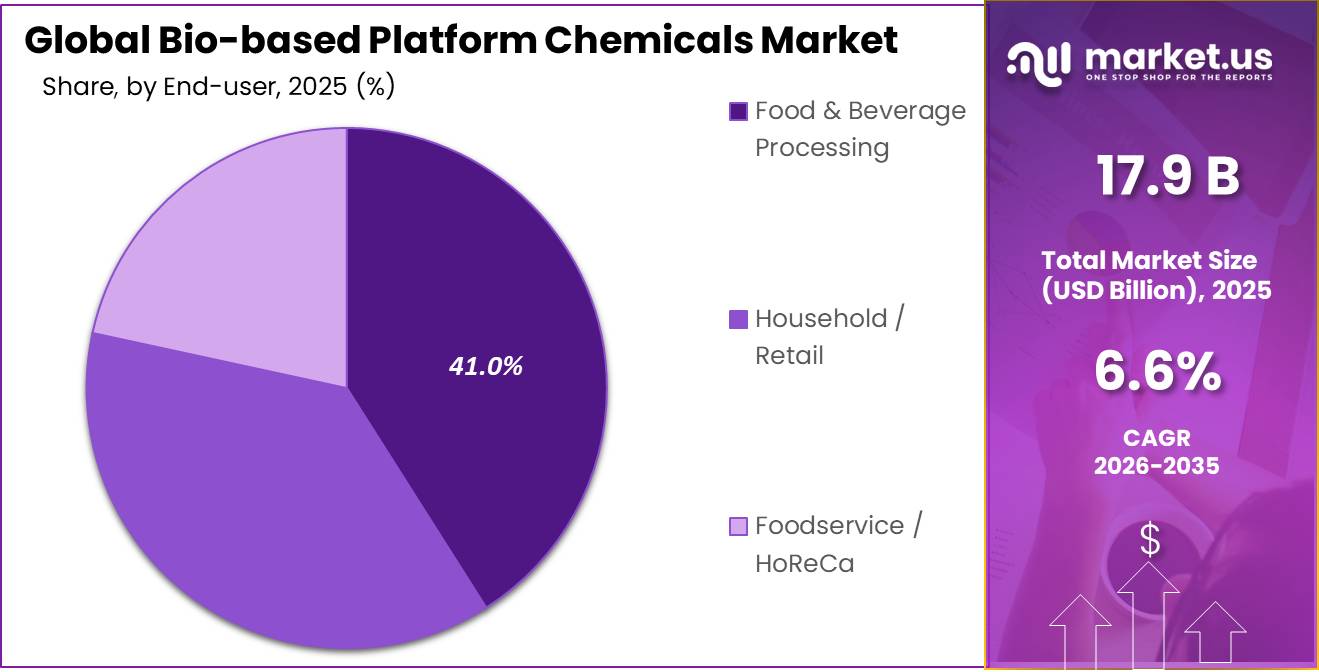
- Food & Beverage Processing held a dominant market position, capturing more than a 41.00% share.
- Pouches & Bags held a dominant market position, capturing more than a 47.00% share.
- Supermarkets & Hypermarkets held a dominant market position, capturing more than a 38.00% share.
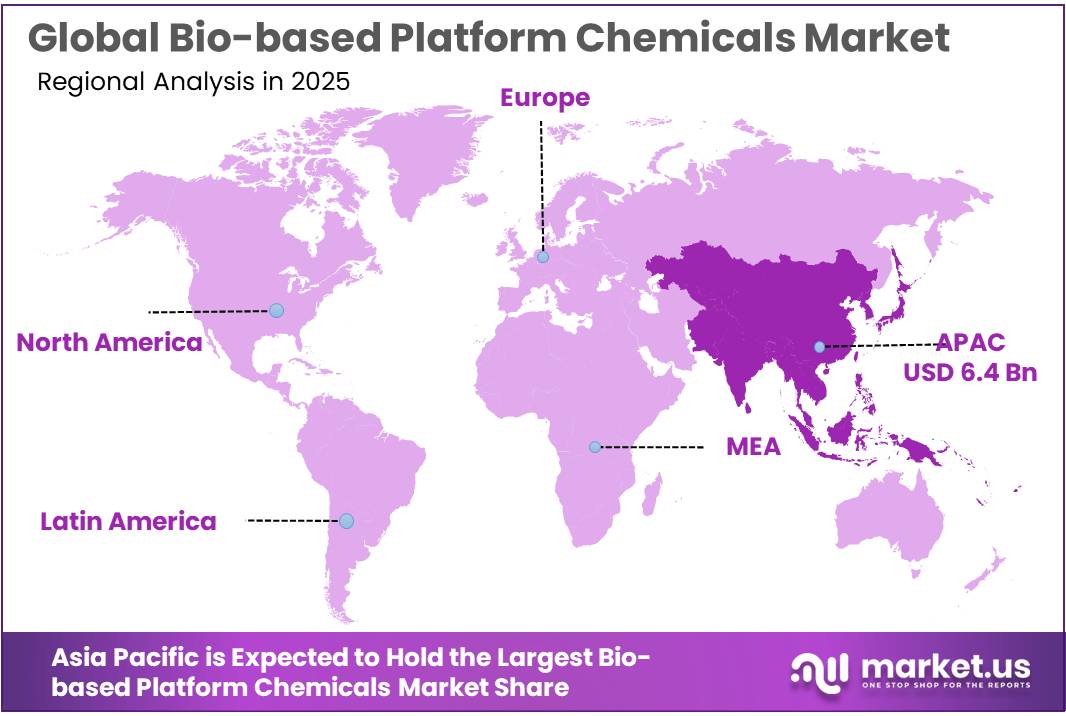
- Asia Pacific held a dominant position, capturing more than a 36.00% share and generating about USD 6.44 billion.
Commercialisation is moving from laboratory development toward pilot plants and first-of-a-kind biorefineries. Circular Bio-based Europe Joint Undertaking reported that 24 projects signed grant agreements worth €172 million to scale circular bio-based industries. Of this total, €68 million is supporting flagship innovation actions designed to build first-of-a-kind biorefineries. The direction is shifting toward facilities that process agricultural residues, food waste and lignocellulosic biomass into higher-value chemical intermediates.
Platform chemicals are receiving policy support because they can serve many downstream applications from one production base. CBE JU allocated €20 million to bio-based drop-in and smart drop-in platform chemicals using cost-effective biomass conversion. Industrial scale-up is visible in France, where the CERISEA project is developing a 5-HMF facility with planned output of 3,000 tonnes per year. The plant is expected to create about 30 direct jobs while supplying a renewable building block for resins, coatings, plastics and crop-science materials.
- The European Commission reports that biomass-producing and converting activities support 17.1 million jobs across the EU. It estimates the EU bioeconomy at €2.7 trillion in value, while the biotechnology sector is expanding at about 18% per year. These figures indicate a growing industrial base for fermentation, enzyme processing, biocatalysis, biomass fractionation and downstream purification.
The European Commission is targeting up to €10 billion in corporate offtake commitments through its Bio-based Europe Alliance, while estimated public and private investment needs for new demonstration and production capacity are around €1-2 billion. In the United States, the Department of Energy has announced an expected funding opportunity of up to $58 million for emerging chemical technologies using alternative and waste feedstocks.
By Product Type Analysis
Whole Nuts lead with 56.70% share on strong consumer preference
In 2025, Whole Nuts held a dominant market position, capturing more than a 56.70% share. The segment remained strong because whole nuts are widely consumed as snacks and are also used in bakery, confectionery, cereals, desserts, and food processing. Their natural format, convenient storage, broad availability, and growing use in protein-rich and plant-based diets continued to support demand. Strong agricultural output also provides a dependable raw-material base for this segment.
- In May 2025, the U.S. Department of Agriculture forecast U.S. almond production at 2.80 billion pounds, representing a 3% increase from the previous season. This sizable nut supply supports processors, retailers, and food manufacturers that depend on whole almonds and other tree nuts for direct consumption and further processing.
Nut Butter is developing as an important product segment as consumers increasingly prefer convenient spreads made from almonds, peanuts, cashews, and other nuts. Its use continues to expand across breakfast foods, snacks, bakery products, smoothies, nutrition products, and plant-based food preparations. Manufacturers are also widening product choices through smooth, crunchy, natural, flavored, and clean-label formulations.
By Production Method Analysis
Conventional leads with 86.00% share through established feedstocks and fermentation infrastructure
In 2025, Conventional held a dominant market position, capturing more than a 86.00% share. Its leadership was supported by established fermentation systems, readily available agricultural feedstocks, mature processing equipment, and easier integration with existing chemical production facilities. The U.S. Department of Energy highlighted whole-kernel corn as a suitable feedstock for producing bio-based chemicals such as 3-hydroxypropionic acid through existing fermentation infrastructure.
- In 2025, the Department of Energy also announced up to USD 23 million for research and development of renewable chemicals and fuels produced from biomass and waste resources. Feedstock availability further supports conventional processing, as the USDA forecast U.S. corn production at 16.8 billion bushels in 2025. Large-scale access to common biomass feedstocks helps producers maintain steady processing volumes and supports the commercial production of bio-based platform chemicals.
Organic production is developing as an emerging production method in the Bio-based Platform Chemicals Market. The segment benefits from increasing attention toward traceable agricultural inputs, cleaner supply chains, renewable raw materials, and production practices designed around sustainability. Chemical manufacturers exploring this route can use organically sourced biomass and other renewable materials for fermentation and biochemical conversion processes.
By End-User Analysis
Food & Beverage Processing leads with 41.00% share as large-scale processing supports demand
In 2025, Food & Beverage Processing held a dominant market position, capturing more than a 41.00% share. The segment remained the leading end user because bio-based platform chemicals, particularly organic acids and fermentation-derived ingredients, are widely suited to food formulation, acidity control, preservation, flavor development, and processing applications. The large size of the food manufacturing industry provides a steady consumption base for these materials.
- In May 2026, the U.S. Bureau of Labor Statistics reported about 1,776,300 employees in U.S. food manufacturing, including around 1,402,500 production and nonsupervisory workers. BLS occupational data for 2025 also recorded 144,690 food batchmakers, highlighting the scale of industrial mixing and formulation activities within the sector. This established processing infrastructure supports continued demand for bio-based acids, fermentation intermediates, and other renewable chemicals that can meet food-processing requirements.
Household / Retail is developing as an important end-user segment in the Bio-based Platform Chemicals Market. Demand is supported by the increasing use of renewable chemical ingredients in household cleaners, detergents, personal-care formulations, home-care products, packaged consumer goods, and other everyday applications. Bio-based acids, solvents, and fermentation-derived intermediates offer manufacturers options for reducing dependence on petroleum-based ingredients while maintaining product performance.
By Packaging Analysis
Pouches & Bags lead with 47.00% share through flexible and efficient packaging
In 2025, Pouches & Bags held a dominant market position, capturing more than a 47.00% share. The segment benefits from lightweight construction, easier transportation, efficient storage, and lower packaging material requirements compared with many rigid formats. These advantages make pouches and bags practical for powdered, granular, and selected solid bio-based chemical products that require convenient handling and protection during transportation. Government employment data also show the established scale of the supporting flexible-plastics industry.
- The U.S. Bureau of Labor Statistics reported that plastics packaging materials and unlaminated film and sheet manufacturing employed approximately 100,200 people in July 2025. Employment in this manufacturing category stood at about 98,900 in May 2026, indicating a sizable industrial base for producing flexible films and related packaging materials. This manufacturing capability supports the continued availability and adoption of pouch and bag formats across chemical supply chains.
Jars & Bottles remain an important packaging segment in the Bio-based Platform Chemicals Market because they provide rigid protection, controlled dispensing, product visibility, and secure closure options. These formats are particularly suitable for liquid and semi-liquid bio-based chemicals where leakage prevention and safe handling are important. Bottles can also support different closure systems and package sizes, allowing chemical suppliers to serve laboratory, commercial, and industrial customers.
By Distribution Channel Analysis
Supermarkets & Hypermarkets lead with 38.00% share through strong retail reach
In 2025, Supermarkets & Hypermarkets held a dominant market position, capturing more than a 38.00% share. Their leadership is supported by high customer traffic, broad product availability, large shelf capacity, and established distribution networks. These stores provide manufacturers with a practical channel for reaching mass-market buyers across food, household, personal-care, and other consumer applications that can incorporate bio-based ingredients and chemicals. Government employment data also show the scale of this retail infrastructure.
- In 2026, the U.S. Bureau of Labor Statistics reported approximately 2.65 million employees working in supermarkets and other grocery retailers, excluding convenience retailers. This large operating base reflects the extensive reach of supermarket networks and supports their importance as a distribution channel for products using renewable and bio-based chemical inputs.
Convenience Stores are developing as an important distribution channel in the Bio-based Platform Chemicals Market, particularly for finished consumer products that use renewable chemical ingredients. Their strength comes from easy accessibility, smaller store formats, longer operating hours, and frequent customer visits. Products containing bio-based ingredients can reach consumers through household cleaners, personal-care items, packaged foods, beverages, and other everyday goods sold through these outlets.
Key Market Segments
By Product Type
- Whole Nuts
- Nut Butter
- Nut Paste
- Nut Flour / Meal
- Nut Milk
- Nut Oil
By Production Method
- Conventional
- Organic
By End-User
- Household / Retail
- Food & Beverage Processing
- Foodservice / HoReCa
By Packaging
- Pouches & Bags
- Jars & Bottles
- Cans & Tins
- Bulk
By Distribution Channel
- Supermarkets & Hypermarkets
- Convenience Stores
- Specialty Stores
- Online Retail / E-Commerce
- B2B / Direct Industrial Supply
Driver Analysis
EU Bioeconomy Strategy 2025 and PPWR-Driven Feedstock Substitution
The European Commission’s adoption of the Bioeconomy Strategy on 27 November 2025 formally embedded bio-based plastics within the Packaging and Packaging Waste Regulation (PPWR) architecture, with binding criteria and biobased content targets scheduled for adoption in 2027, creating a defined 12-24 month runway for capital allocation decisions.
Historically, national precedents illustrate the mechanism: Italy’s biobased plastic bag mandate escalated minimum biobased carbon content from 30% in 2017 to 60% by 2025, demonstrating how regulatory floors ratchet upward over a multi-year horizon and force incumbent suppliers to re-qualify formulations against rising thresholds. For platform chemical producers of succinic acid, lactic acid, and 1,3-propanediol, this shifts customer acquisition away from price-only RFQs toward long-term supply contracts anchored to certified biobased carbon content, reducing spot-market volatility but raising the fixed cost of certification and traceability infrastructure.
Drivers Impact Analysis
| Driver | (\~) % Impact on CAGR Forecast | Geographic Relevance | Impact Timeline |
|---|---|---|---|
| EU Bioeconomy Strategy 2025 and PPWR biobased plastics targets forcing regulatory-driven feedstock substitution | +1.6% | EU core, UK spill-over, Nordics | Medium term (2-4 years) |
| Precision fermentation and biorefinery cost curves compressing unit economics toward petrochemical parity | +1.4% | North America core, EU, APAC (China, Japan, Thailand) corridors | Medium term (2-4 years) |
| Sustainable Aviation Fuel and biofuel blending mandates diverting platform-chemical co-product streams into fuel value chains | +0.9% | North America, EU, India, APAC corridors | Short term (≤2 years) |
| Capacity expansion and greenfield biorefinery investment cycle (2024-2026 announced projects) reducing supply-side bottlenecks | +1.1% | APAC (China, Thailand, India) core, North America, EU | Short term (≤2 years) |
| Corporate carbon-neutrality commitments and Scope 3 procurement mandates from FMCG/packaging brands | +0.8% | North America, EU core, APAC spill-over | Long term (≥4 years) |
| Feedstock-cost volatility and food-vs-fuel competition for sugar/corn/lignocellulosic biomass acting as a structural drag | -0.7% | Global, with acute pressure in APAC and South America corridors | Long term (≥4 years) |
Restraint Analysis
Feedstock Cost Volatility
Feedstock volatility is the largest near-term restraint because first-generation fermentation routes remain exposed to corn, sugar, starch, and glucose prices while second-generation routes still face collection, pretreatment, and yield penalties; as a directional reference point, USDA’s 2025/26 U.S. corn outlook was about USD 4.20 per bushel, versus USD 4.35 in 2024/25, yet its longer-term projection rises from USD 4.10 per bushel in 2026/27 to USD 4.40 by 2029/30, illustrating that a temporarily softer commodity cycle does not remove the structural input-cost risk for 2026 capacity planning.
For a typical sugar-based platform-chemical process, management should assume that fermentable carbon, nutrients, and utilities collectively represent roughly 45-65% of cash manufacturing cost; therefore, a 10% feedstock increase can erode gross margin by approximately 400-650 basis points where contractual selling prices lag by one or two quarters.
The risk intensifies in India, Southeast Asia, Brazil, and China because rainfall variability, export restrictions, ethanol mandates, and competition from food, animal feed, and biofuel buyers create seasonal supply discontinuities, forcing plants either to hold 60-120 days of costly buffer inventory or operate below nameplate utilization. The resulting impact is not merely higher raw-material cost: variable substrate quality lowers fermentation consistency, increases batch-failure probability, raises downstream purification consumption, and delays customer qualification, supporting an estimated -1.4 percentage-point drag on the 2026 baseline CAGR.
Restraint Impact Analysis
| Restraint | (\~) % Impact on CAGR | Geographic Relevance | Impact Timeline |
|---|---|---|---|
| Feedstock cost volatility | -1.4% | APAC, Americas, EU | Short term (≤ 2 years) |
| Scale-up and purification cost | -1.2% | North America, EU, APAC | Medium term (2-4 years) |
| Biomass logistics gaps | -0.8% | India, SE Asia, Latin America | Medium term (2-4 years) |
| Petrochemical price undercut | -1.0% | China, Middle East, US | Short term (≤ 2 years) |
| Regulatory proof burden | -0.6% | EU core, North America | Short term (≤ 2 years) |
| Financing and offtake risk | -0.9% | Global; emerging markets | Long term (≥ 4 years) |
Opportunity Analysis
Tolling and Capacity-as-a-Service
Instead of selling only tonnes of succinic acid, lactic acid, itaconic acid, 1,3-propanediol, or other intermediates, a producer can monetize idle or flexible fermenter capacity through development runs, process-transfer fees, downstream-recovery charges, quality-release services, and multi-year reservation contracts; a 10-20 million litre annual fermentation asset operating at 65% utilization could potentially recover 10-20 percentage points of otherwise unabsorbed fixed cost by raising utilization toward 80-85% through third-party campaigns.
For customers, using a shared platform can eliminate USD 20-60 million of early dedicated-plant capital and shorten the transition from pilot batch to validated industrial batch from roughly 24-36 months to 9-18 months, improving investor bankability. The opportunity is distinct from baseline demand because it expands the market’s revenue pool from chemical sales alone into recurring manufacturing services, process data, strain optimization, and downstream-development fees; executed well, this model could create +1.1 percentage points of CAGR upside in North America, Europe, and India within two years.
Opportunity Impact Analysis
| Opportunity | (\~) % Potential CAGR | Geographic Relevance | Execution Window |
|---|---|---|---|
| Lignin-to-aromatics platforms | +1.5% | EU, North America, Brazil | Medium term (2-4 years) |
| C1 gas fermentation | +1.3% | China, EU, North America | Long term (≥ 4 years) |
| Tolling and capacity-as-a-service | +1.1% | North America, EU, India | Short term (≤ 2 years) |
| Waste-carbon biorefineries | +1.4% | India, SE Asia, Latin America | Medium term (2-4 years) |
| FDCA and performance polymers | +1.2% | EU, Japan, Korea, North America | Medium term (2-4 years) |
| M&A-led integrated platforms | +0.9% | North America, EU, APAC | Short term (≤ 2 years) |
Challenges Analysis
Scale-Up Yield Variability
Industrial bioprocess scale-up is a persistent operational challenge, not a present sales restraint, because production can continue but output consistency degrades when bench-scale strain performance is transferred into 50,000-500,000 litre commercial fermenters, where oxygen-transfer limitations, heat-removal gradients, shear exposure, foaming, microbial contamination, and variable nutrient delivery alter titre, rate, and yield simultaneously.
A realistic operating model should anticipate 5-12% yield dispersion between campaigns during the first 12-24 months of a new production line, with each 1-percentage-point yield loss increasing conversion cost by roughly 1.5-2.5% when feedstock, energy, depreciation, and downstream recovery costs remain fixed; for a 50,000-tonne facility, an 8% utilization or yield deviation can defer 4,000 tonnes of saleable output and disrupt customer supply commitments.
The long-term corporate response requires digital fermentation twins, inline spectroscopy, tighter strain-bank governance, redundant seed-train capacity, predictive contamination analytics, and product portfolios designed to absorb off-spec material into secondary grades, rather than relying on one high-purity product route. These adaptations do not eliminate sales but impose an estimated -1.1 percentage-point friction drag on maximum achievable CAGR until commercial process capability is reliably normalized.
Challenges Impact Analysis
| Challenge | (\~) % CAGR Friction | Geographic Relevance | Mitigation Horizon |
|---|---|---|---|
| Scale-Up Yield Variability | -1.1% | North America, EU, APAC | Medium term (2-4 years) |
| Biomass Quality Fragmentation | -0.9% | India, SE Asia, Latin America | Long term (≥ 4 years) |
| Specialist Talent Scarcity | -0.6% | North America, EU, India | Long term (≥ 4 years) |
| Carbon-Data Traceability | -0.5% | EU hubs, global exporters | Medium term (2-4 years) |
| Maritime Network Disruption | -0.4% | APAC-EU trade corridors | Short term (≤ 2 years) |
| Process-Data Standardization | -0.7% | Global production hubs | Medium term (2-4 years) |
Geopolitical Impact Analysis
Russia-Ukraine and Red Sea Conflicts Raise Costs Across Bio-based Chemicals
The ongoing Russia-Ukraine war and conflict around the Red Sea continue to affect the Bio-based Platform Chemicals Market through energy costs, agricultural feedstock uncertainty, and longer shipping routes. Bio-based chemicals rely on corn, sugar, vegetable oils, biomass, fermentation nutrients, natural gas, and electricity, so disruption in either agricultural or energy markets can raise production costs.
- The European Commission reported in July 2026 that the EU’s average wholesale gas price reached €36/MWh in 2025, up 5% from 2024, partly reflecting the halt of Russian pipeline gas transit through Ukraine.
This matters for fermentation, distillation, drying, and purification operations that require steady heat and power. Shipping risks are also increasing procurement pressure. UNCTAD reported that by May 2025, tonnage moving through the Suez Canal remained 70% below 2023 levels as vessels continued to avoid conflict-affected routes. Longer voyages can increase freight bills and delay imported feedstocks, catalysts, enzymes, and processing equipment. At the same time, geopolitical pressure is encouraging chemical producers to diversify suppliers, use locally available biomass, and develop regional biorefineries.
Regional Insights
Asia Pacific Leads Bio-based Platform Chemicals with 36.00% Share and USD 6.44 Billion
In 2025, Asia Pacific held a dominant position in the Bio-based Platform Chemicals Market, capturing more than a 36.00% share and generating about USD 6.44 billion in revenue. The region benefits from a large chemical manufacturing base, biomass availability, fermentation expertise, and growing investment in sustainable materials.
- Singapore’s Economic Development Board reported in 2025 that more than 100 global chemical companies operate in the country, while specialty chemicals account for around 20% of its energy and chemicals output. South Korea is also strengthening biomanufacturing through a government-backed biofoundry program with KRW 126.3 billion planned over five years from 2025.
Europe, meanwhile, had supported 220 CBE JU projects by the end of 2025, involving 1,700 beneficiaries across 45 countries. These developments indicate strong opportunities for fermentation-based acids, renewable intermediates, bio-based polymers, and other platform chemicals as producers improve feedstock security, processing efficiency, purification economics, and commercial-scale manufacturing.
- In January 2026, the Circular Bio-based Europe Joint Undertaking selected 24 projects for €172 million in funding, including 4 flagship innovation actions. Its 2025 program also allocated €20 million specifically for bio-based drop-in and smart drop-in platform chemicals produced through efficient biomass conversion. Industrial capacity is expanding as well. In France, construction started in 2025 on an industrial 5-HMF facility designed to produce 3,000 tonnes annually for resins, coatings, plastics, and other applications.
Key Regions and Countries Insights
- North America
- US
- Canada
- Europe
- Germany
- France
- The UK
- Spain
- Italy
- Rest of Europe
- Asia Pacific
- China
- Japan
- South Korea
- India
- Australia
- Rest of APAC
- Latin America
- Brazil
- Mexico
- Rest of Latin America
- Middle East & Africa
- GCC
- South Africa
- Rest of MEA
Key Players Analysis
BASF SE maintains a strong position in bio-based platform chemicals through renewable feedstocks, biomass-balanced intermediates, and lower-carbon chemical solutions. In 2025, BASF generated €59.7 billion in sales and employed 108,251 people worldwide. The company purchased around 1.1 million metric tons of renewable raw materials during the year, mainly from vegetable oils, fats, grains, and sugar. BASF also offers more than 1,200 certified biomass-balanced products, supporting wider replacement of fossil feedstocks across chemical value chains.
Cargill plays an important role in bio-based chemicals through fermentation feedstocks, vegetable oils, polyols, starches, and renewable industrial ingredients. In fiscal 2025, the company generated USD 154 billion in revenue. Cargill has more than 30 years of fermentation experience and has invested over USD 2 billion in fermentation infrastructure and partnerships. Its broader operations include more than 155,000 employees across 70 countries, giving the company significant agricultural sourcing and processing capabilities for renewable chemical production.
Corbion has a strong position in fermentation-derived platform chemicals, particularly lactic acid, biochemical ingredients, and biomaterials. In 2025, the company recorded €1,267.4 million in total sales and employed 2,408 FTEs. Its Biochemicals business generated €146.9 million, while sales of lactic acid to the TotalEnergies Corbion joint venture reached €81.6 million. Corbion’s fermentation expertise and manufacturing presence across the United States, Thailand, Brazil, Mexico, the Netherlands, and Spain support its bio-based chemical supply capabilities.
Top Key Players Outlook
- BASF SE
- Cargill, Incorporated
- Braskem S.A.
- Corbion N.V.
- DuPont de Nemours, Inc.
- Archer-Daniels-Midland Company (ADM)
- Evonik Industries AG
- dsm-firmenich (Royal DSM)
- Mitsubishi Chemical Group Corporation
- LyondellBasell Industries N.V.
- Novonesis (Novozymes A/S)
- NatureWorks LLC
- Genomatica, Inc.
- Roquette Frères
- PTT Global Chemical Public Company Limited
Recent Developments
- In June 2026, DuPont expanded renewable-energy use across 12 U.S. manufacturing facilities, matching around 30,000 MWh of annual electricity consumption.
- In January 2026, ADM announced a USD 26 million expansion of its Erlanger facility to increase production and innovation capacity for naturally derived ingredients.
- In April 2026, when Evonik announced an investment of around €80 million at its Fermas biotechnology site in Slovakia to add downstream fermentation technology and create approximately 50 new jobs.
- April 2026 with Veramaris® O3 Max Pure, produced through closed-system microalgae fermentation and delivering EPA and DHA in a 3:2 ratio. Financially, dsm-firmenich reported €9.034 billion in 2025 continuing-operation sales, €1.772 billion in adjusted EBITDA, and €764 million in capital expenditure, supporting continued investment in fermentation, renewable ingredients, and bio-based chemical technologies.
Report Scope
| Report Features | Description |
|---|---|
| Market Value (2025) | USD 17.9 Bn |
| Forecast Revenue (2035) | USD 34.0 Bn |
| CAGR (2026-2035) | 6.6% |
| Base Year for Estimation | 2025 |
| Historic Period | 2020-2024 |
| Forecast Period | 2026-2035 |
| Report Coverage | Revenue Forecast, Market Dynamics, Competitive Landscape, Recent Developments |
| Segments Covered | By Product Type (Whole Nuts, Nut Butter, Nut Paste, Nut Flour / Meal, Nut Milk, Nut Oil), By Production Method (Conventional, Organic), By End-User (Household / Retail, Food And Beverage Processing, Foodservice / HoReCa), By Packaging (Pouches And Bags, Jars And Bottles, Cans And Tins, Bulk), By Distribution Channel (Supermarkets And Hypermarkets, Convenience Stores, Specialty Stores, Online Retail / E-Commerce, B2B / Direct Industrial Supply) |
| Regional Analysis | North America – US, Canada; Europe – Germany, France, The UK, Spain, Italy, Rest of Europe; Asia Pacific – China, Japan, South Korea, India, Australia, Singapore, Rest of APAC; Latin America – Brazil, Mexico, Rest of Latin America; Middle East & Africa – GCC, South Africa, Rest of MEA |
| Competitive Landscape | BASF SE, Cargill, Incorporated, Braskem S.A., Corbion N.V., DuPont de Nemours, Inc., Archer-Daniels-Midland Company (ADM), Evonik Industries AG, dsm-firmenich (Royal DSM), Mitsubishi Chemical Group Corporation, LyondellBasell Industries N.V., Novonesis (Novozymes A/S), NatureWorks LLC, Genomatica, Inc., Roquette Frères, PTT Global Chemical Public Company Limited |
| Customization Scope | Customization for segments, region/country-level will be provided. Moreover, additional customization can be done based on the requirements. |
| Purchase Options | We have three licenses to opt for: Single User License, Multi-User License (Up to 5 Users), Corporate Use License (Unlimited User and Printable PDF) |





































