
Quick Navigation
- Introduction
- Editor’s Choice
- Historical Facts
- General Social Media Marketing Statistics and Facts
- Importance of Social Media Marketing
- Regional Social Media Statistics
- Social Media Usage Statistics
- Influencer Marketing Statistics
- Social Media Advertising Statistics
- Social Media Marketing AI Statistics
- E-commerce and Online Shopping Statistics
- Social Media Platform Statistics
- B2B Social Selling Statistics
- Recent Developments
- Social Media Marketing Future Predictions
- Conclusion
Introduction
Social Media Marketing Statistics: Social media marketing involves utilising platforms such as Facebook, Instagram, and LinkedIn to promote a brand, product, or service by creating and disseminating content, engaging with audiences, and executing advertisements.
Its primary objectives include enhancing brand recognition, driving traffic to websites, generating leads, and cultivating customer relationships. This is accomplished through a blend of content publication, follower interaction, performance analysis, and the use of paid advertising.
Social media marketing serves as a potent instrument for businesses, with more than 5.4 billion individuals active on social platforms. Key statistics indicate that a considerable segment of users, particularly among younger demographics, actively engages with these platforms for product research and purchasing decisions, with Instagram serving as a notable example. Furthermore, video content proves to be highly effective, prompting many businesses to invest in it, while AI is increasingly leveraged to enhance campaign efficiency.
Editor’s Choice
- As of 2025, it is estimated that there are around 5.41 billion social media users globally.
- Data reveals that nearly 25% of LinkedIn’s user base is situated in North America.
- According to various reports, TikTok’s reach for adult advertisements across Africa is 72% greater (144 million) compared to Instagram’s (84 million).
- In 2023, 59% of the population in the EU engaged with social media. Denmark recorded the highest usage rate at 91%.
- In the United States, there are 302 million individuals who utilize social media.
- X has a total of 550 active users each month.
- There are 1 billion members on LinkedIn across more than 200 countries.
Historical Facts
- With the swift advancement of technology, the early 1970s marked the inception of social media concepts.
- By the late 1970s and early 1980s, computers became increasingly prevalent in households, and technology was advancing in complexity.
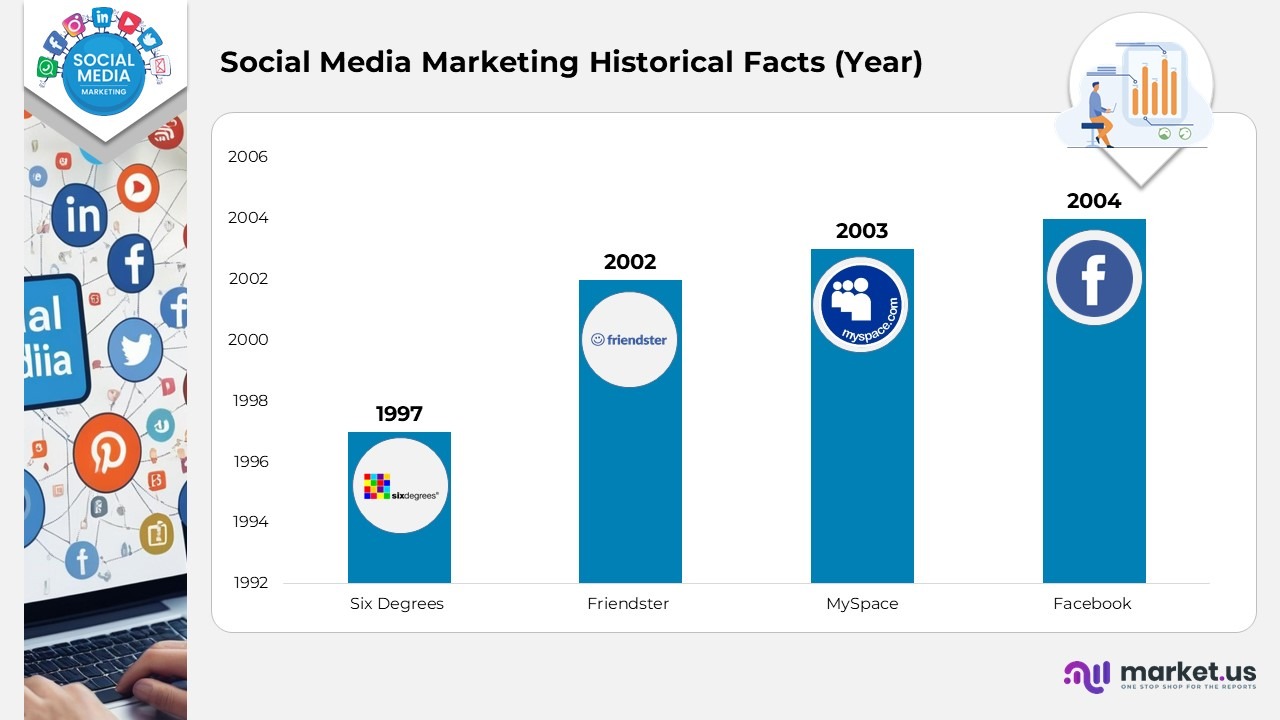
- Social media marketing progressed from initial online forums and platforms such as Six Degrees (1997) and Friendster (2002) to significant platforms like MySpace (2003) and Facebook (2004).
- Social media platforms started to emerge two decades later, in the late 1990s, and it was inevitable that social media would evolve into a formidable instrument in the realms of business and marketing.
- In 2004, Mark Zuckerberg established Facebook, as it was referred to at that time.
- In 2006, Facebook broadened its network by permitting users from outside university settings. By October, it had attracted 50 million users, and a month later, Facebook Ads was introduced.
General Social Media Marketing Statistics and Facts
- As of 2025, it is estimated that there are around 5.41 billion social media users globally.
- On average, each person interacts with 6.7 different social networks each month.
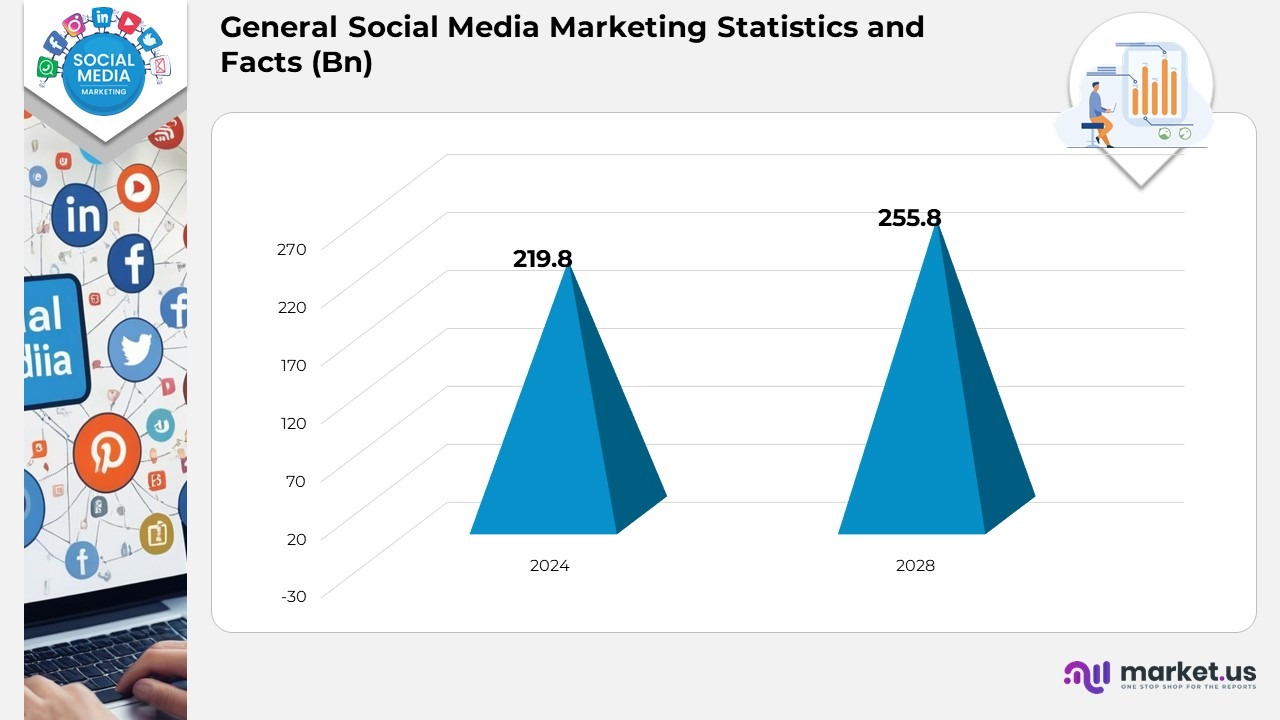
- The investment in social media advertising is projected to reach $219.8 billion in 2024. By 2028, it is expected that mobile advertising will account for $255.8 billion of this total.
- Video content remains highly favoured; 44% of consumers prefer to learn about newly launched products through short video content. Additionally, 87% of marketers have indicated an increase in sales as a result of their video marketing efforts.
- On average, internet users spend 151 minutes daily on social media and messaging applications.
- Facebook, owned by Meta, is the most widely utilized social network worldwide, with more than 3 billion monthly users.
- As of January 2024, the UAE has the highest social media penetration rate. Morocco and Brazil are also nearing the global average of 62.3%, with penetration rates of 66.3% and 55.7%, respectively.
- Data from Keywords Everywhere highlights a strong and consistent trend in “social media marketing” over the past year, emphasising its importance as a crucial marketing strategy.
- According to an analysis by Kepios, the number of internet users globally has surpassed a supermajority, with more than two-thirds of the world’s population now online.
- By 2027, it is anticipated that there will be 327 million social media users in the United States.
- The Keywords Everywhere widget shows that the cost-per-click for keywords associated with “social media marketing” typically exceeds $0.15, indicating fierce competition for advertising space.
Importance of Social Media Marketing
- Social media enhances brand visibility. By consistently and strategically sharing content, you can make your brand more recognizable to your intended audience.
- Social media enables businesses to engage directly with customers. Prompt responses to inquiries and feedback enhance customer satisfaction and foster trust.
- Social media is constantly evolving with new features and trends. Businesses can demonstrate their innovation by remaining up-to-date and adjusting to these changes.
Regional Social Media Statistics
The Americas
- As of the end of the third quarter of 2023, TikTok’s active user count in North American markets surpassed that of Instagram by a minimal margin. Conversely, Instagram maintained a lead in South American markets.
- Data reveals that nearly 25% of LinkedIn’s user base is situated in North America.
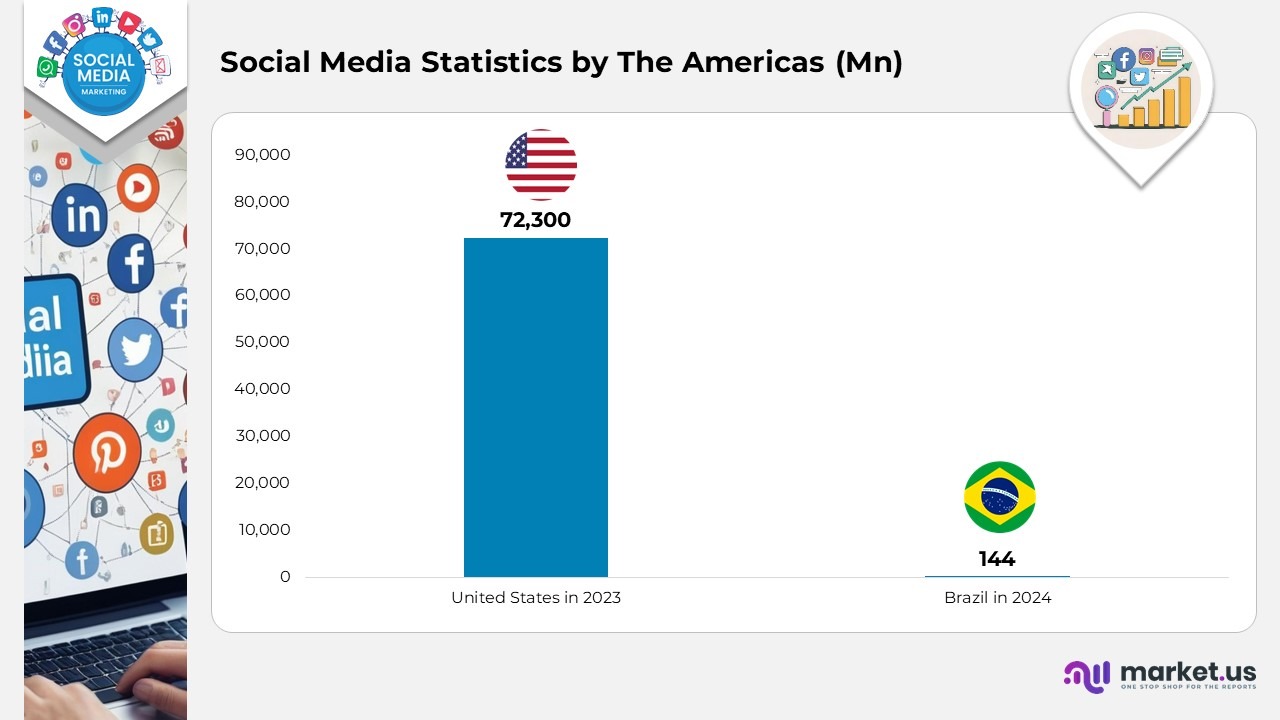
- The United States ranks among the largest social media advertising markets globally, with expenditures on social media ads totaling $72.3 billion in 2023 alone.
- Statistics indicate that as of January 2024, there were 144 million active social media users registered in Brazil.
- In Canada, the number of social media users experienced a decline of 3.6% from early 2023 to the beginning of 2024.
- From January 2023 to January 2024, Facebook’s potential advertising reach in Mexico saw an increase of 7.7%.
Africa
- According to various reports, TikTok’s reach for adult advertisements across Africa is 72% greater (144 million) compared to Instagram’s (84 million).
- As of February 2022, approximately 56% of the Northern African population engaged with social media, while 45% of Southern Africa’s population did the same. In contrast, only 8% of Central Africa’s population were users of social media.
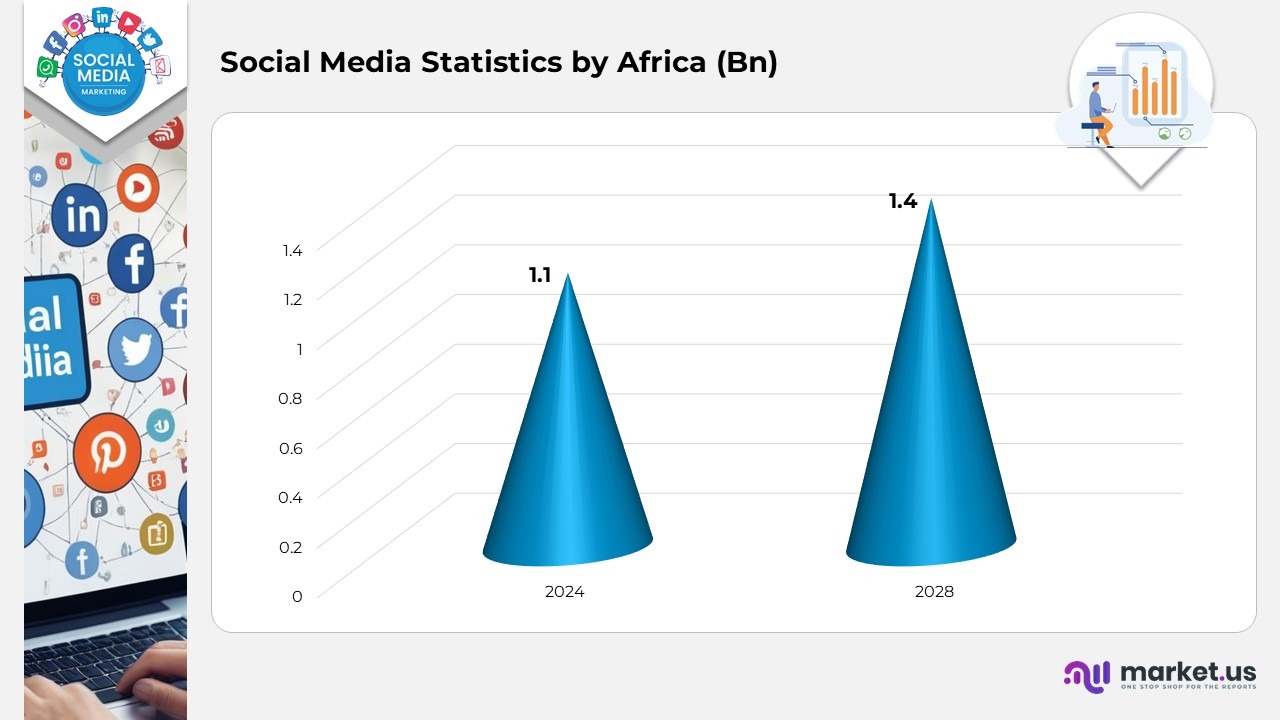
- The expenditure on advertising within the African social media market is projected to attain $1.1 billion by 2024, with an anticipated annual growth rate of 4.28% from 2024 to 2028. This growth is expected to culminate in a market value of $1.4 billion by the year 2028.
- As of September 2023, TikTok held the largest market share among social media platforms in Africa, boasting traffic generation capabilities of 79.4%.
Asia-Pacific
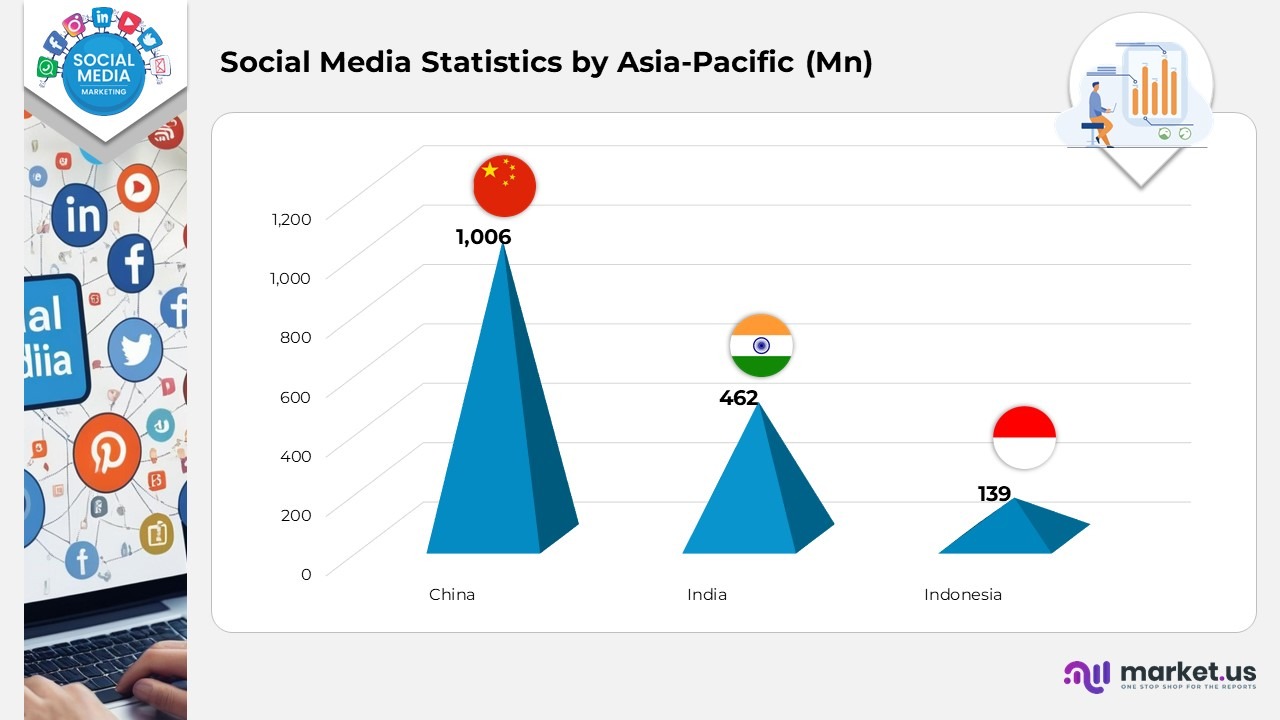
- As of January 2024, China had approximately 1.06 billion social media user accounts, establishing itself as the leading nation in terms of the total number of social media users.
- India is in second place with 462 million accounts, while Indonesia holds the third position with 139 million social media user accounts.
- In the region, 87% of marketers primarily used Facebook. Other social media platforms that were utilised include Instagram (81%), LinkedIn (81%), YouTube (64%), Twitter (50%), and TikTok (29%).
- TikTok’s adult advertising reach in West Asia is 149 million users, surpassing Instagram’s reach of 122 million by more than 20%. In Southeast Asia, TikTok has an adult ad reach of 345 million users, in contrast to Instagram’s reported 154 million.
Europe
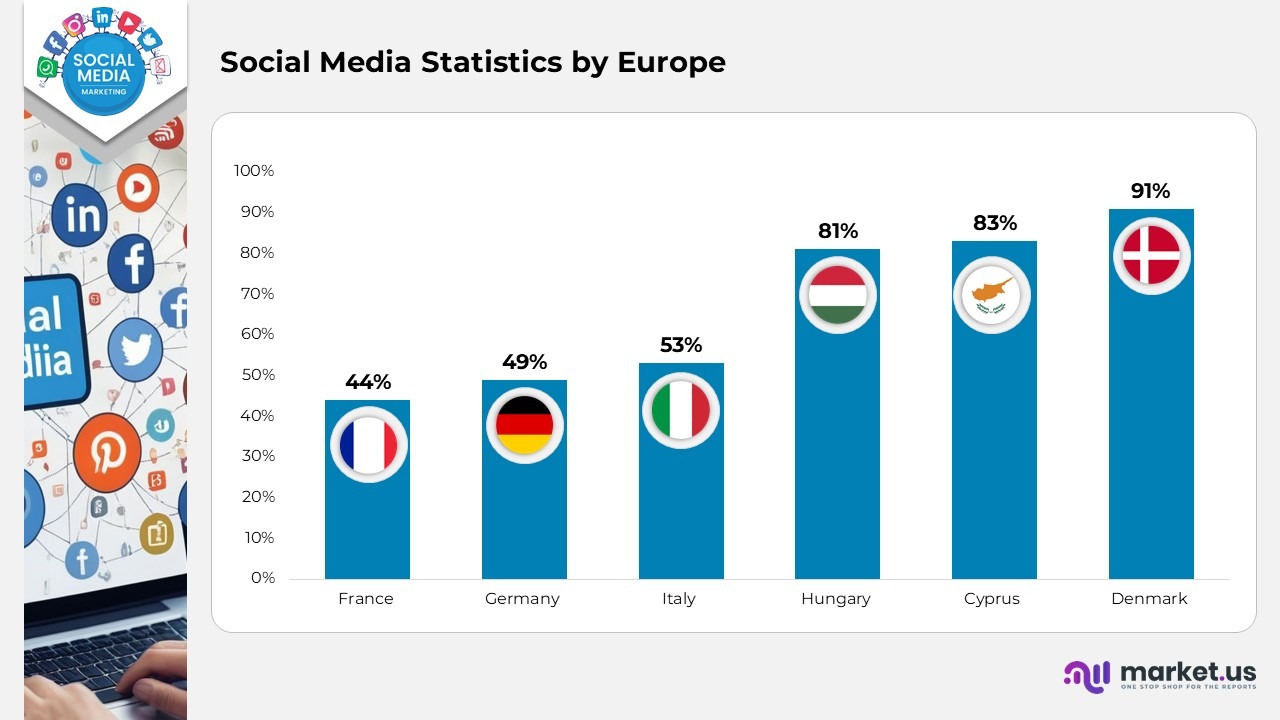
- In 2023, 59% of the population in the EU engaged with social media. Denmark recorded the highest usage rate at 91%.
- Following Denmark, Cyprus and Hungary had 83% and 81% of their populations using social media, respectively. The countries with the lowest social media usage were France (44%), Germany (49%), and Italy (53%).
- Facebook commands 79.41% of the social media market in Europe.
- The two predominant social media activities in Europe included “Sending private messages” and “Liking posts from other users or following individuals.”
- In the first quarter of 2024, 38.5% of consumers in the UK reported an inability to differentiate between virtual influencers and human influencers.
- Additionally, 63% of small and medium-sized enterprises are struggling to find the necessary talent, highlighting an increase in labor and skill shortages within the EU.
- Instagram’s total adult advertising reach in Western and Northern Europe was 126 million users, surpassing TikTok’s reported ad reach of 100 million users by a quarter.
Middle East
- The two main social media activities in the United Arab Emirates (UAE) were “Sending private messages” and “Commenting on posts”.
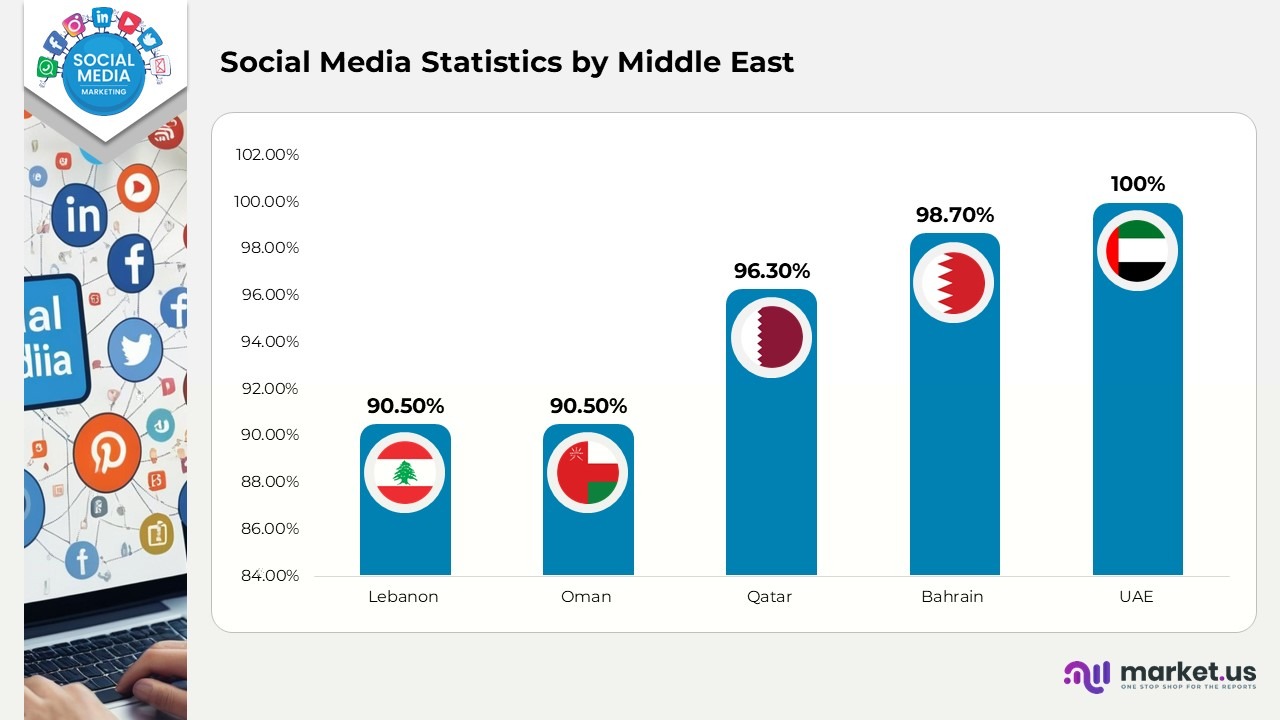
- 5 countries in the Middle East are included in the Top 10 for social media usage: Lebanon (90.5%), Oman (90.5%), Qatar (96.3%), Bahrain (98.7%), and UAE (100%).
- Egypt has 42 million Facebook users, making it the 10th largest national market for the platform.
- The average monthly number of social media platforms used by internet users aged 16 to 64 was 8.2 in the UAE, 7.9 in Saudi Arabia, 7.6 in Turkey, and 7.2 in Egypt.
- In 2024, mobile device web traffic is expected to reach 66% in Egypt, 73% in Turkey and Iran, 75% in the UAE, and 79% in Saudi Arabia
Social Media Usage Statistics
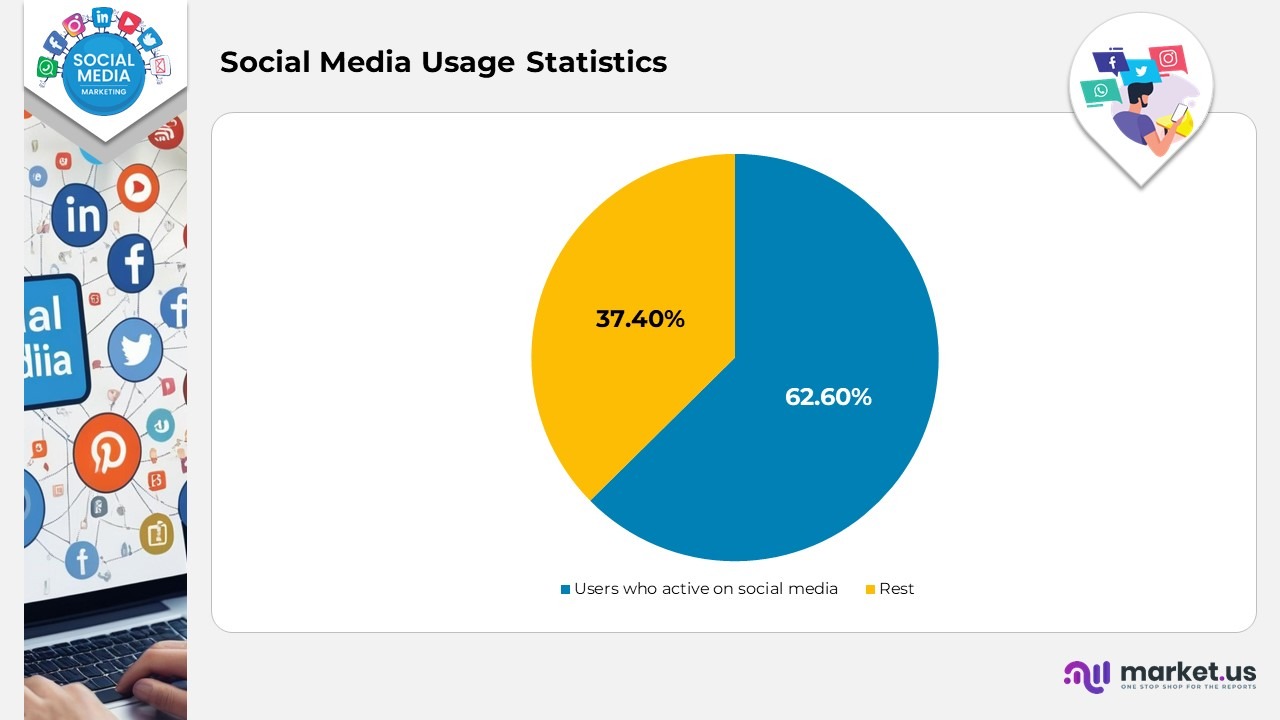
- Currently, more than half of the world’s population is active on social media, accounting for 62.6%.
- Globally, 5.07 billion people use social media, with 259 million new users having signed up in the last year.
- In the United States, there are 302 million individuals who utilize social media.
- It is projected that the total number of social media users worldwide will reach 6 billion by 2027.
- A remarkable 99% of social media users access these platforms through a tablet or smartphone, with 78% depending exclusively on their mobile devices.
- Nigeria leads the world in social media usage, with its citizens spending over four hours daily on social networks, which is significantly higher than the global average of 2 hours and 27 minutes.
- Social network penetration in North America stands at 74%, compared to a global average of 59%.
- Generation Z shows the greatest inclination to engage through digital channels, surpassing other age groups worldwide.
- For internet users aged 16 to 24, social networks have become the favored platform for researching potential purchases.
Influencer Marketing Statistics
- The Influencer Marketing Industry is projected to attain approximately $24 billion by the conclusion of 2024.
- According to reports, 63% of brands intend to incorporate AI into their influencer campaigns, with 55% employing AI for the purpose of influencer identification.
- While the majority of brands invest less than $50K in influencer marketing, nearly 15% dedicate over $500K to this area.
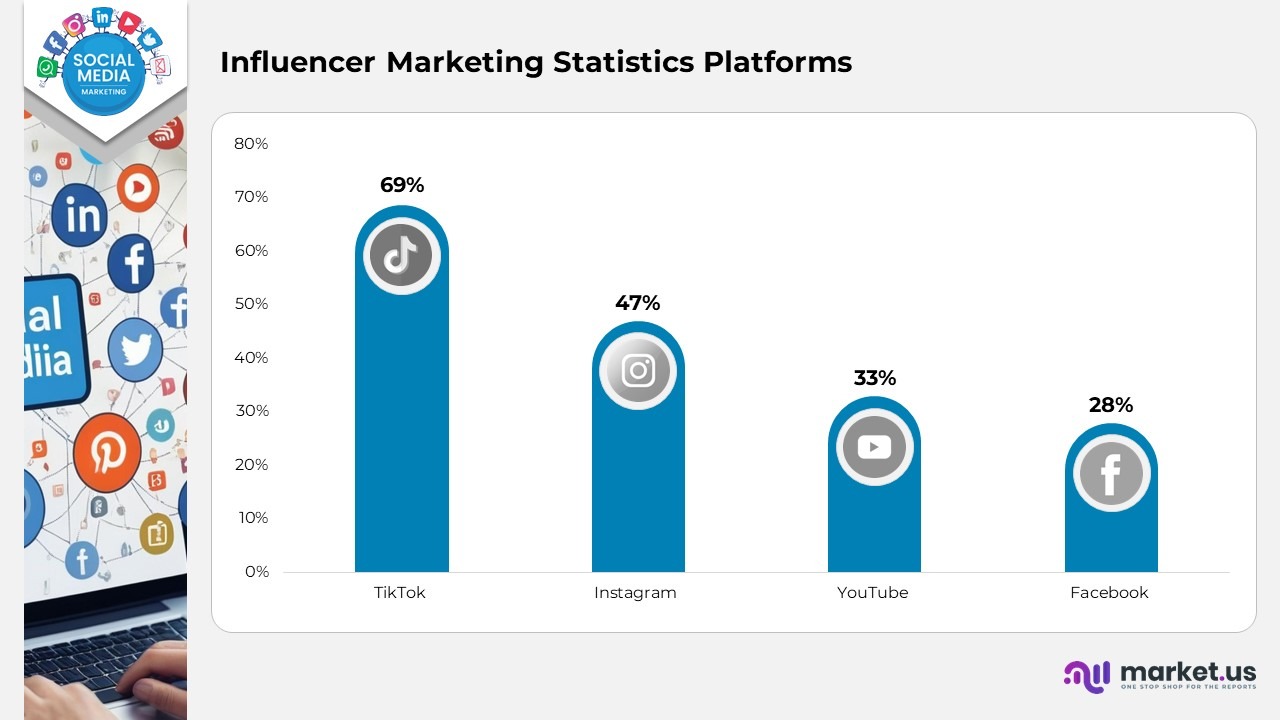
- TikTok stands out as the foremost influencer marketing platform, utilized by nearly 69% of brands, surpassing Instagram (47%), YouTube (33%), and Facebook (28%).
- The primary marketing objectives for collaborating with creators include enhancing engagement, reaching new audiences, and fortifying community ties.
- Data from Keywords Everywhere indicates a robust and consistent increase in the term “influencer marketing” over the past year, underscoring its significance as a leading marketing strategy.
Social Media Advertising Statistics
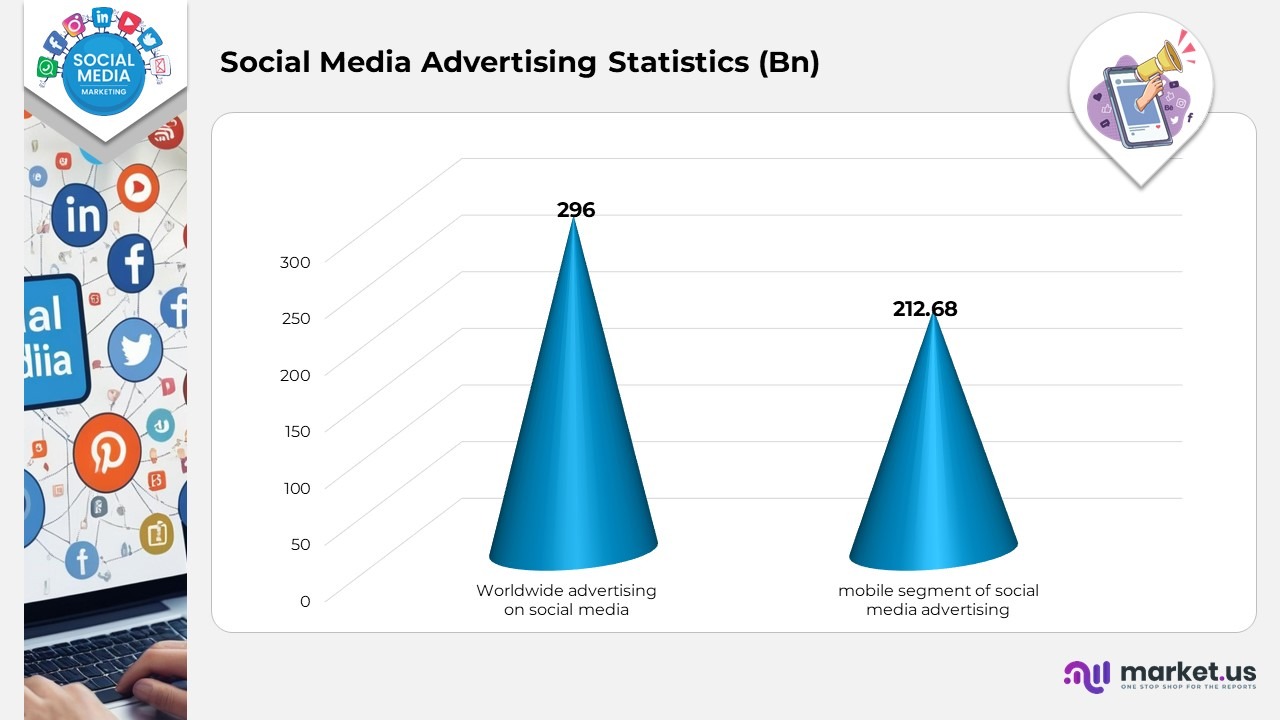
- Worldwide, more than $296 billion is allocated to advertising on social media. The mobile segment of social media advertising holds the highest value at $212.68 billion.
- By 2028, it is anticipated that social media advertising will reach 6,054 million users.
- The United States stands as the foremost market for social media advertising globally.
- Facebook is the preferred social media platform among marketers, with 89% utilizing it for advertising purposes. Instagram follows as the second most popular choice, with 80% of marketers employing it.
- The cost-per-mile (CPM), which represents the expenditure for 1,000 impressions across all social media platforms, is $6.06.
- In recent years, the volume of impressions on social media has increased by 20%. A significant portion of these impressions is attributed to passive ad formats, such as stories and videos.
- 70% of marketing teams have designated an employee to oversee social commerce management.
- 52% of marketers engage in selling products directly to consumers through social media applications, while 25% of consumers have made purchases directly via social media.
- Marketers identify enhanced exposure as the primary advantage of social media advertising, followed by increased traffic, lead generation, and customer loyalty.
- 69% of businesses utilize engagement as a key metric to evaluate the success of their social media initiatives, while 51% rely on impressions and views, 49% on follower counts, and 43% on clicks and traffic to assess return on investment (ROI).
- 22% of consumers report that they prefer using social media over search engines to discover products and brands.
- 8% of internet users turn to social media platforms to seek information regarding businesses.
- 28% of Generation Z and millennials utilize social media for brand research.
Social Media Marketing AI Statistics
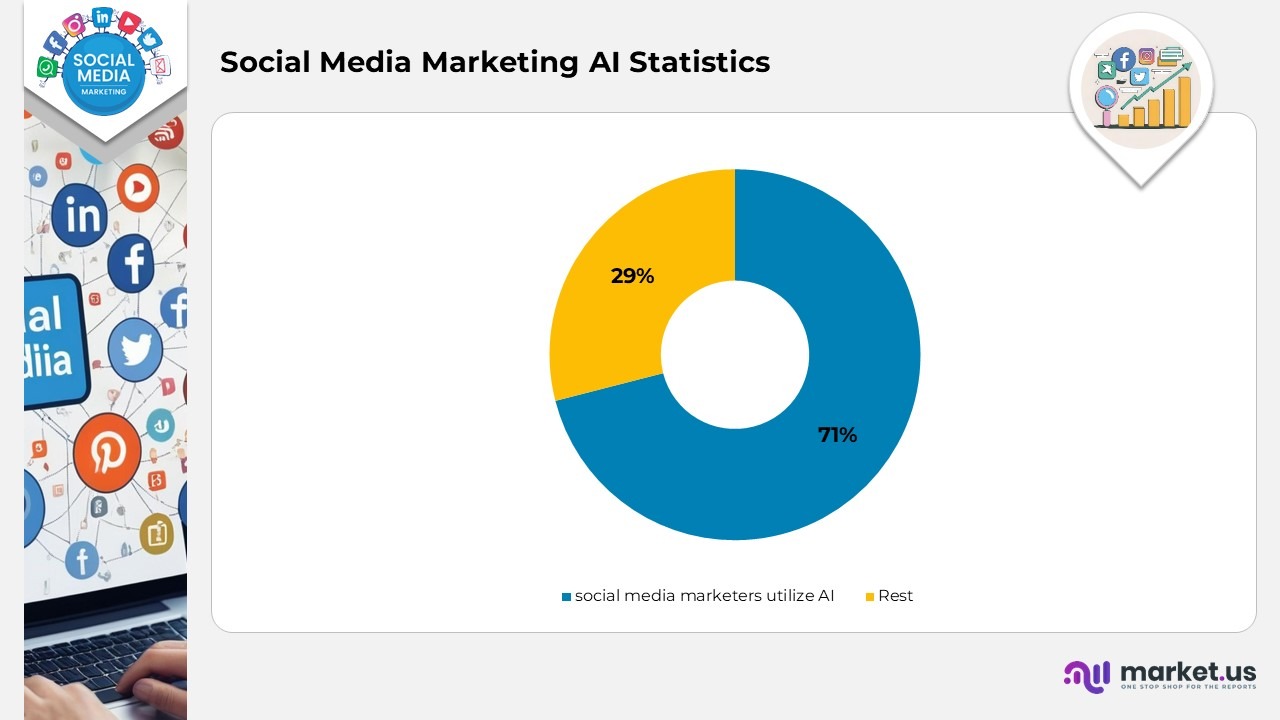
- 71% of social media marketers utilize AI in some capacity.
- 71% of marketers who have employed generative AI for content creation report that it outperforms the content they produced without AI.
- 87% of social media marketers are convinced that leveraging AI will be the key to achieving success in future social media campaigns.
- Half of US adults express a desire to understand the application of generative AI in social media. Additionally, 23% of US adults have confidence in the manner AI is utilized in social media campaigns and its role in content delivery.
- AI-driven recommendations have resulted in a 7% increase in time spent on Facebook.
- The ”shop the look” AI product recommendations on Pinterest have enhanced conversion rates by 9%.
- 86% of marketers employ AI to edit and enhance text for social media posts, 82% utilize it to generate new ideas, and 52% leverage generative AI to create images.
E-commerce and Online Shopping Statistics
- More than 2.14 billion individuals globally engage in online shopping, representing 27% of the worldwide population.
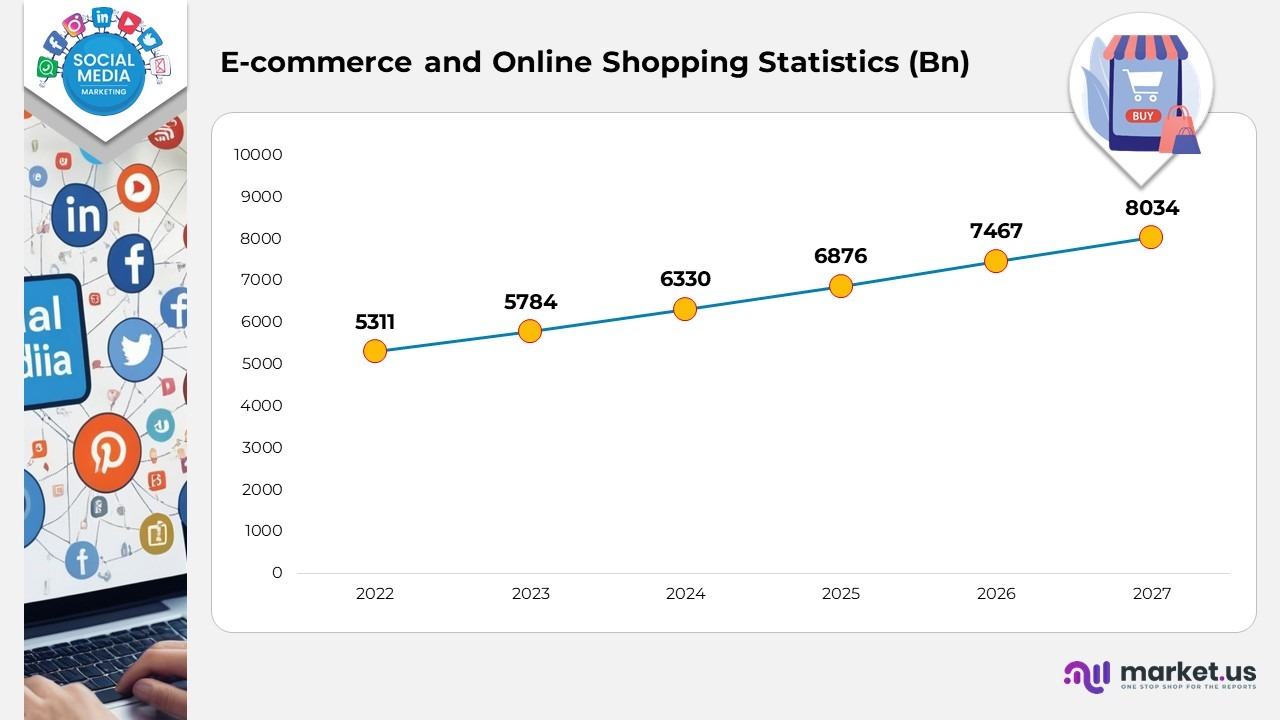
- Experts anticipate that the global eCommerce market may surpass $8 trillion by the year 2027.
- eCommerce sales are projected to increase by 10.1% annually by 2024, significantly outpacing the 2% growth rate expected for physical retail stores.
- The chart above illustrates the monthly online sales for the year 2024.
- At present, online shopping constitutes 20% of total retail sales, with expectations to rise to 25% by 2025.
- By the year 2040, it is estimated that 95% of purchases will occur online.
- According to Social Media Marketing Statistics, 56% of consumers appreciate online shopping due to its 24/7 availability.
- Rapid shipping and delivery are essential for 78% of online shoppers, followed by precise product descriptions (73%) and a seamless purchasing experience (72%).
- Nearly half of Gen Z consumers (46%) are willing to pay a premium to shop at their preferred online retailers.
- Every week, 53% of American consumers engage in shopping via social media.
- Social Media Marketing Statistics reported that nearly 46% of shoppers would change retailers to locate a desired product.
Social Media Platform Statistics
Facebook Statistics
- Facebook boasts 3 billion monthly active users.
- The largest user base of Facebook is located in India, with 378 million users, while the United States follows with 193 million users.
- The predominant demographic on Facebook consists of men aged 25 to 34, who represent 18.3% of the total user population.
- The second largest demographic on the platform is men aged 18 to 24 years.
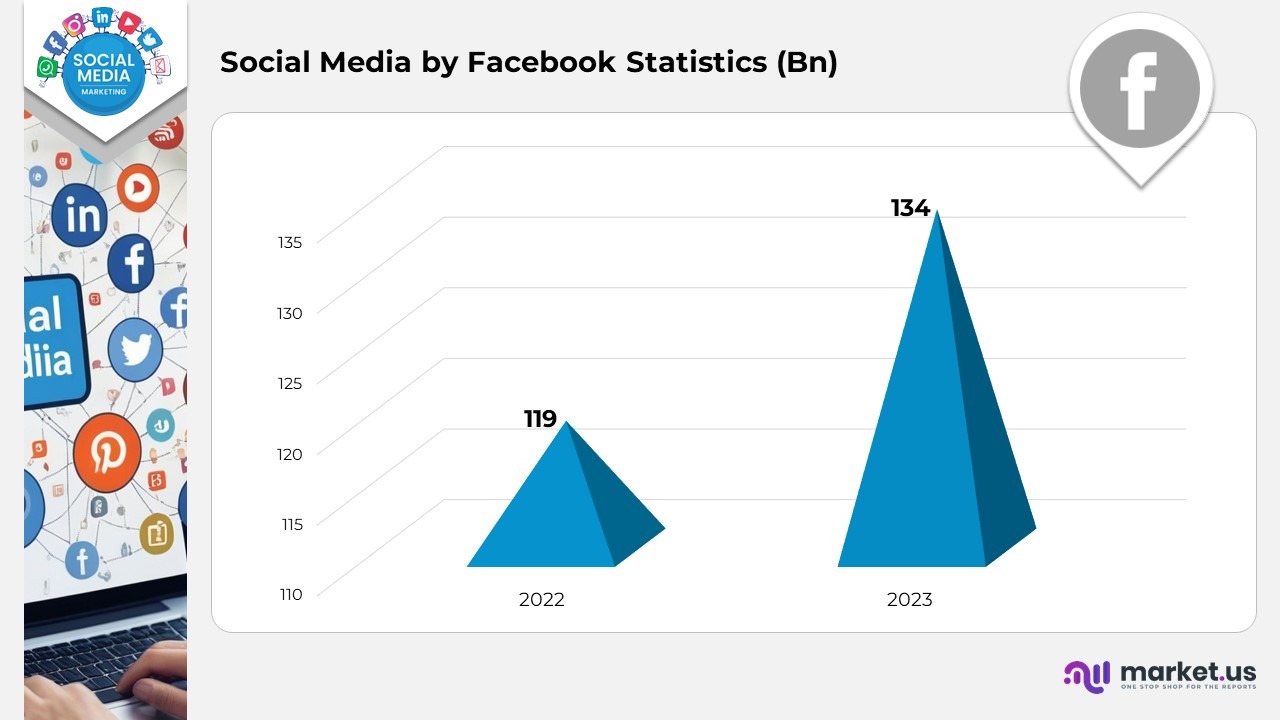
- In 2023, Meta Platforms, the parent company of Facebook, reported a revenue of $134 billion, significantly surpassing the $119 billion earned in the previous year.
- Facebook leads in generating referrals from social media to external websites, with nearly two-thirds of all social media referrals originating from Facebook, in contrast to 13.31% from Instagram and 8.75% from X.
- Approximately 37.6% of the global population utilizes Facebook.
- On average, users spend over 33 hours per month on the Facebook app.
Instagram Statistics
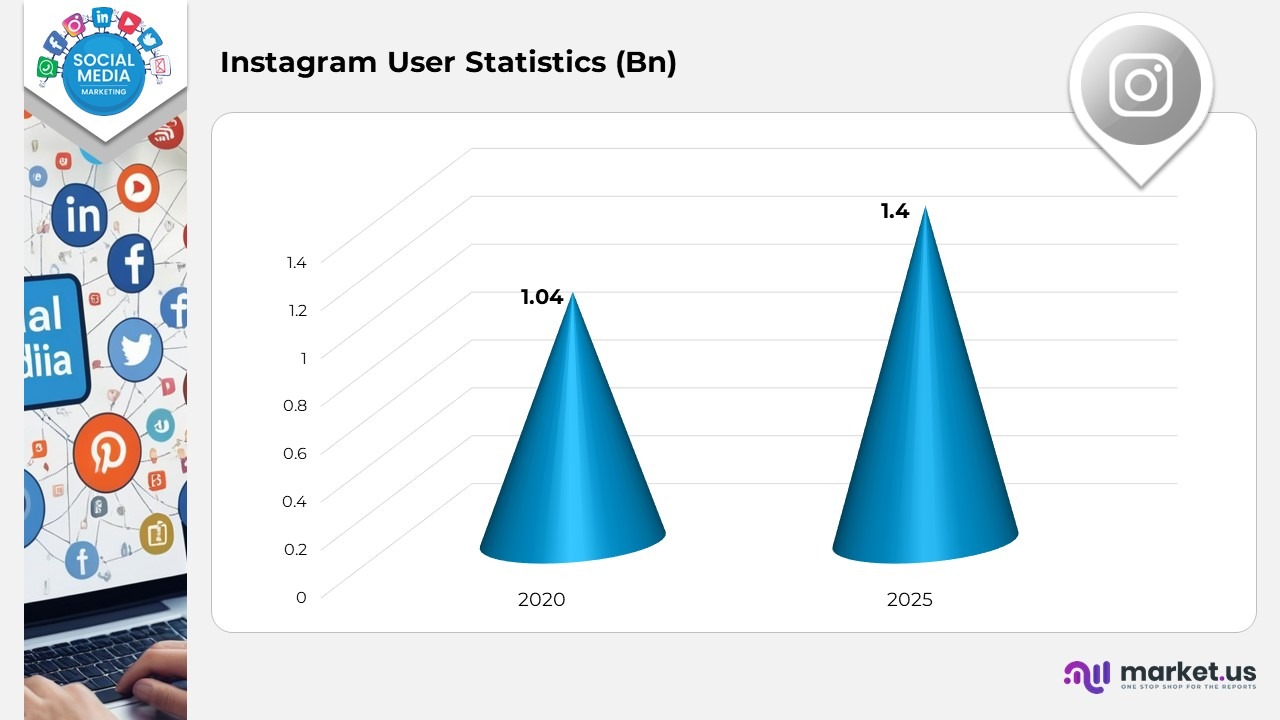
- As of now, Instagram boasts 1.4 billion users worldwide, an increase from 1.04 billion in 2020.
- Most of its user base is located in India, which has 362.9 million users.
- The United States ranks second with 169.65 million users, followed by Brazil with 134.6 million and Indonesia with 100.9 million.
- The platform is primarily used by individuals aged 18 to 24, who represent 31.7% of the total user demographic. The next largest age group is 25 to 34 years, accounting for 30.6% of users. Conversely, only 2.9% of users are aged 65 and older.
- Instagram’s official account holds the title of the most followed page on the platform, with Christiano Ronaldo’s account in second place at 628 million followers. Lionel Messi follows closely with 502 million, and Selena Gomez has 429 million followers.
- On average, users spend approximately 14 hours and 50 minutes on the app each month.
- Instagram has the potential to reach 1.64 billion people through advertising globally, which represents 27.2% of the world’s population aged 18 and over.
- The global advertising audience on the platform is composed of 50.3% males and 49.7% females.
- The average engagement rate for posts on Instagram is 0.47%. However, certain sectors experience higher engagement rates, such as higher education at 2.58%, sports teams at 1.49%, influencers at 0.81%, and nonprofits at 0.63%.
- The predominant type of posts made by Instagram business accounts are image posts, which constitute 41.7% of all posts, followed by video posts at 38.2% and carousel posts at 20.0%.
- Carousel posts achieve the highest engagement rate on Instagram at 0.73%, compared to 0.54% for photo posts and 0.63% for video posts.
- In the United States, 42% of Instagram users earn less than $75,000 annually, while 39% earn between $30,000 and $75,000.
X Statistics
- X has a total of 550 active users each month.
- 58% of the users on X are below the age of 35.
- The average engagement rate for each post on X stands at 0.035%.
- On average, brands publish 3.91 posts on X, with posting frequency differing among various industries. Media accounts typically post 70.2 times per week, sports teams post 47 times, and nonprofits post around 10 times.
- Advertisements on X have the potential to reach 10.6% of the global population aged 13 and above.
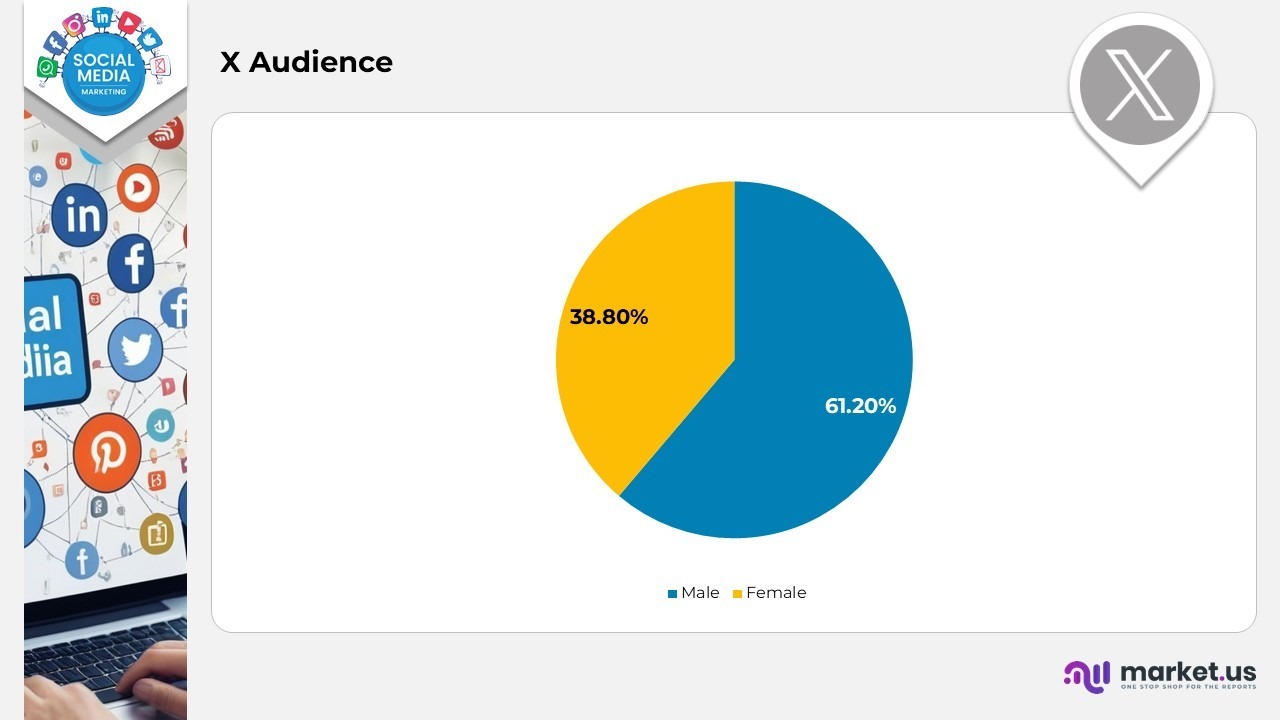
- The audience composition on X shows that 61.2% are male, while 38.8% are female.
- X achieves its highest reach in the United States, engaging with 108.55 million users. Following this, X advertisements reach 74.1 million people in Japan, 30.3 million in India, and 27.05 million in Indonesia.
- The largest demographic on X consists of users aged 25 to 34 years, representing 29.6% of the total user base. Users aged 18 to 24 years make up 28.3% of the platform’s audience.
- The account with the most followers on X is owned by Elon Musk, who has 140.55 million followers. Other prominent accounts include those of Rihanna, Barack Obama, Cristiano Ronaldo, Justin Bieber, and Katy Perry.
LinkedIn Statistics
- There are 1 billion members on LinkedIn across more than 200 countries.
- 6% of LinkedIn users fall within the age range of 25 to 34, whereas 24.5% are aged between 18 and 24 years.
- The United States contributes 230 million users to LinkedIn, with India following closely behind at 130 million users.
- LinkedIn advertisements have the capability to reach 17.5% of individuals aged 18 and older.
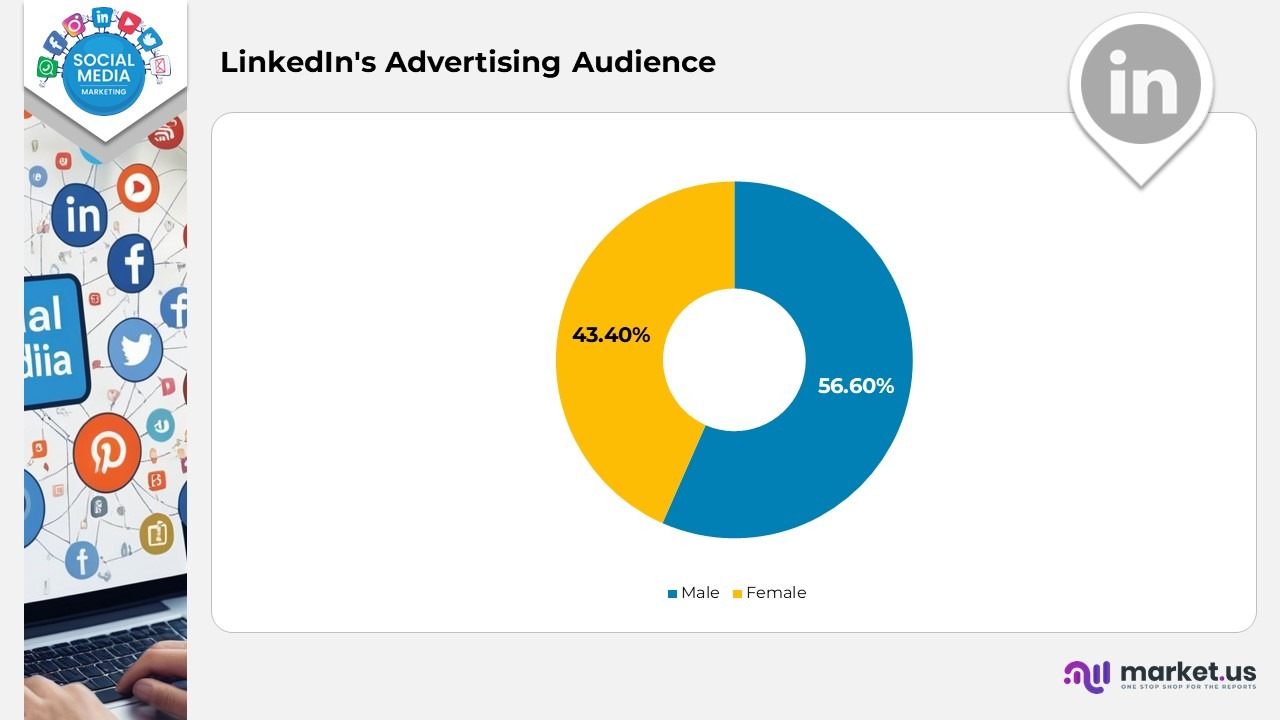
- Among LinkedIn’s advertising audience, 56.6% are men, while 43.4% are women.
- Globally, 64% of marketers incorporate LinkedIn into their marketing strategies.
- Additionally, 48% of B2B marketers consider LinkedIn to be the most significant social media platform for marketing.
YouTube Statistics
- There are 2.1 billion users of YouTube globally.
- YouTube holds a score of 78 out of 100 on the American Customer Satisfaction Index (ACSI).
- In 2023, YouTube’s revenue represented 10.25% of Google’s total revenue for the year. The platform contributed $31.5 billion to Google’s revenue, marking an increase from $29.2 billion in the previous year.
- YouTube boasts 462 million users from India, 239 million from the United States, 144 million from Brazil, 139 million from Indonesia, and 831 million from Mexico.
- The largest demographic segment for advertisements on YouTube consists of men aged 25 to 34.
- The keyword ‘YouTube’ ranks as the fourth most searched term on Google.
- Users of YouTube spend more than 27 hours on the application each month.
- YouTube advertisements have the potential to reach 37.5% of individuals aged 18 and older.
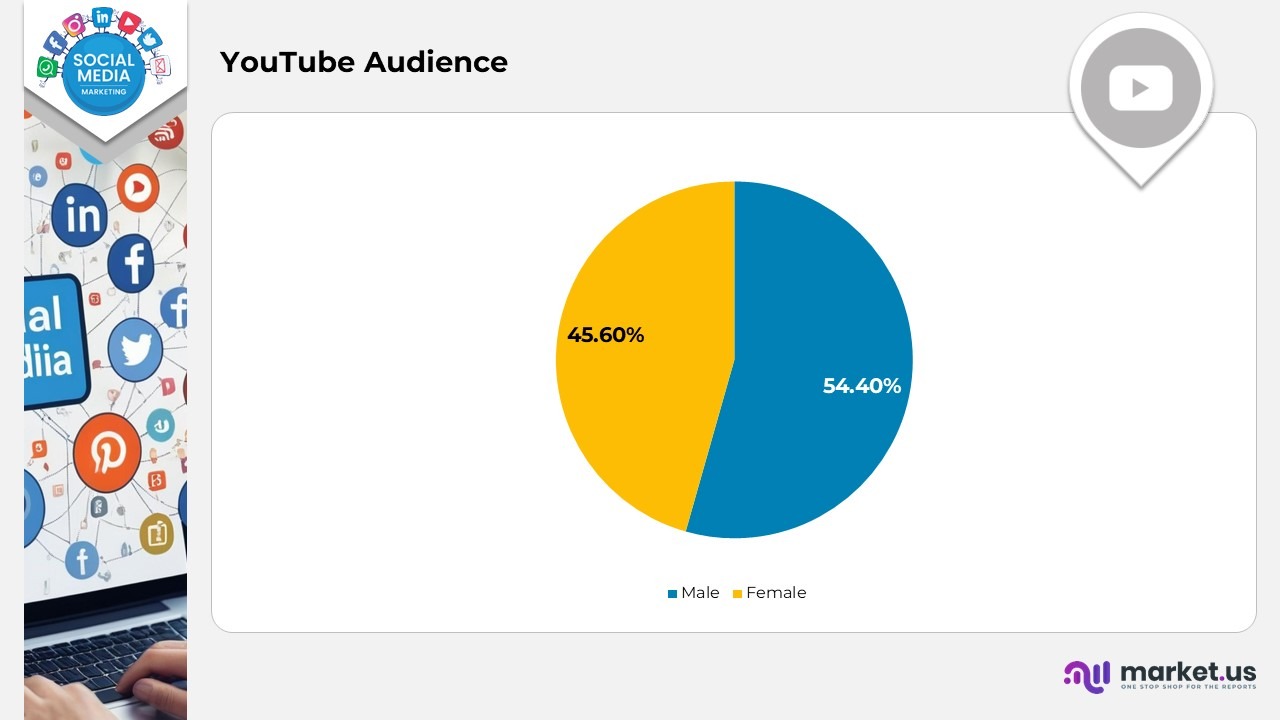
- 4% of the audience for YouTube ads is male, while 45.6% is female.
TikTok Statistics
- TikTok boasts 1.56 billion active users, with 148.9 million of these individuals residing in the United States.
- The annual consumer expenditure on TikTok has reached a total of $3.84 billion.
- In the United States, TikTok engages 55.3% of the population.
- During the fourth quarter of 2023, TikTok was downloaded 232 million times.
- The United States holds the largest number of TikTok followers, followed by Indonesia with 126 million users in second place, and Brazil in third with 99 million users.
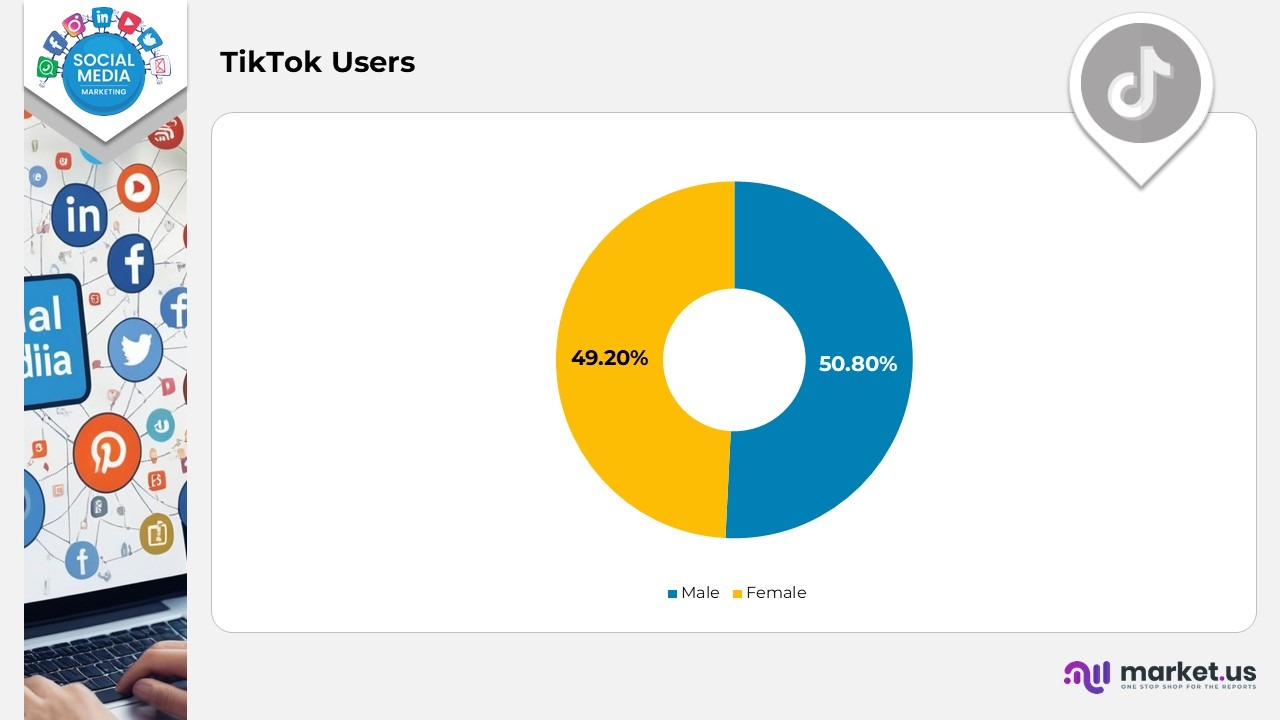
- TikTok advertisements have the capacity to reach 21.5% of the entire population aged 18 and over. Of the app’s advertising audience, 50.8% is male, while the remaining 49.2% is female.
Pinterest Statistics
- Pinterest boasts 498 million active users each month, with a majority hailing from the United States. The platform engages 30.7% of the nation’s populace.
- 4% of Pinterest’s user base consists of females, 22.6% are males, and 8% remain unspecified.
- Pinterest advertisements have the potential to reach 5% of the entire population aged 18 and above.
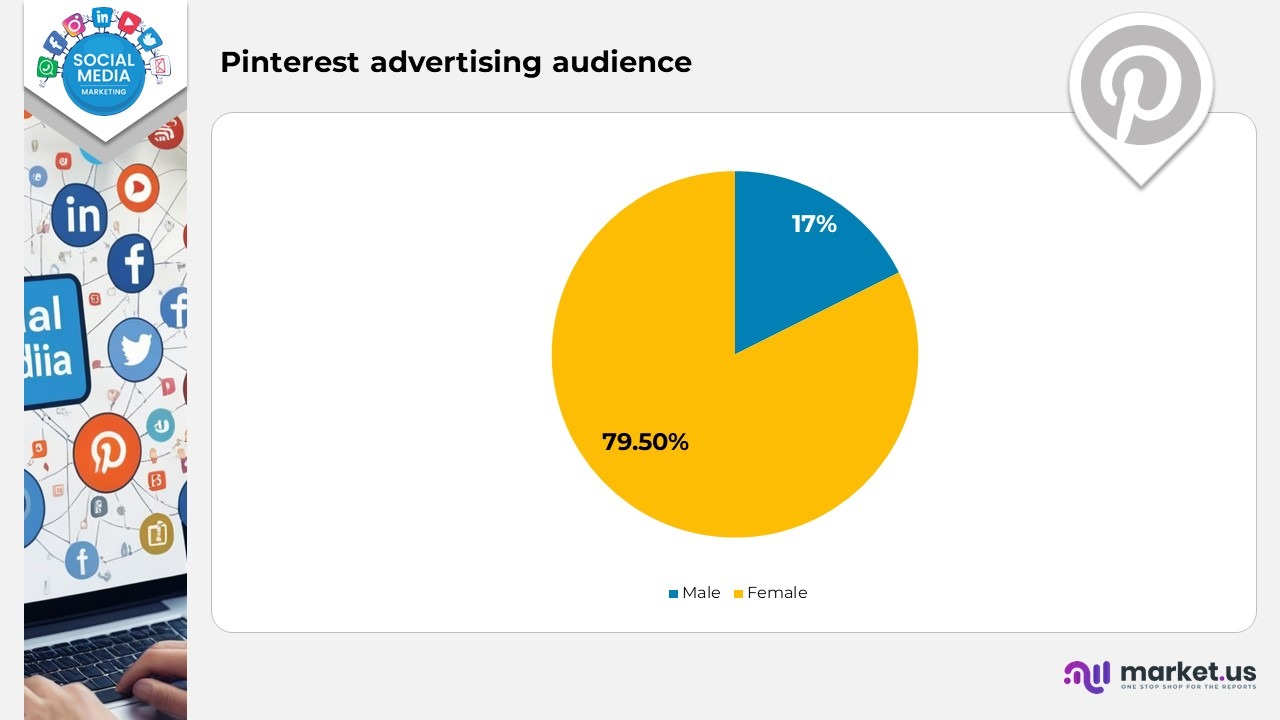
- 17% of Pinterest’s worldwide advertising audience is male, whereas 79.5% is female.
Snapchat Statistics
- Snapchat currently boasts 431 million daily active users, with projections indicating an increase of 8.35% by the year 2025.
- The largest user base of Snapchat is found in India.
- Snapchat advertisements have the capability to reach 9.7% of the entire population aged 18 and above.
- Among Snapchat’s advertising audience, 49.5% are male while 49.7% are female.
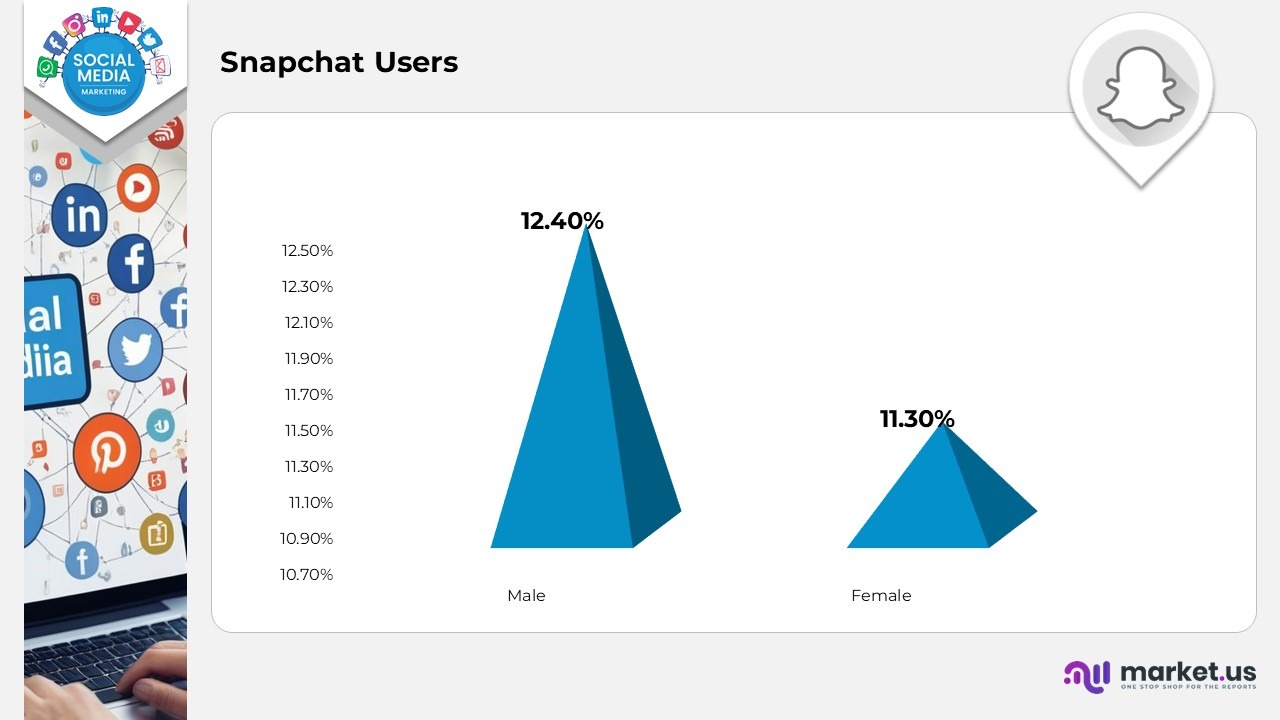
- Within the demographic of users aged 25 to 34 years, Snapchat comprises 11.3% female users and 12.4% male users.
B2B Social Selling Statistics
- 40% of B2B purchasers utilise social media for research prior to making a purchase.
- 54% of B2B marketers acquire leads through social media.
- 39% of B2B firms indicate that they generate revenue from social media.
- 31% of B2B professionals assert that social selling has enabled them to cultivate improved relationships with clients.
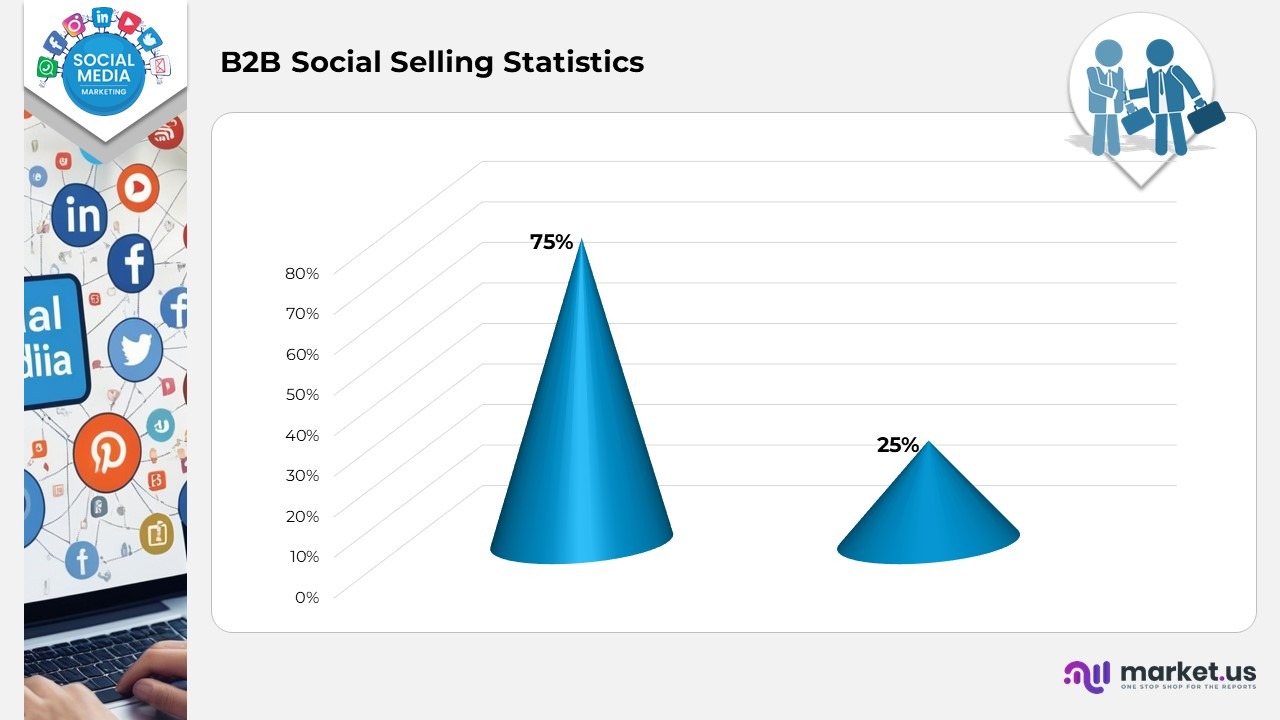
- 75% of B2B purchasers rely on social media for their buying decisions.
- 50% of B2B buyers place their trust in LinkedIn when making purchasing decisions.
- 31% of B2B prospects consider social media content to be the most engaging in comparison to other sales materials.
- 60% of B2B marketers view social media as the second most effective method for lead generation.
- 90% of decision-makers will not respond to a cold call, yet 75% of B2B buyers utilise social media for their purchasing decisions.
- 39% of B2B professionals report that social selling has reduced the time they spend identifying potential leads.
Recent Developments
- As of October 2024, YouTube Shorts can now have a maximum duration of three minutes. Furthermore, the 2025 Index revealed that YouTube ranks among the top three platforms where individuals maintain social media profiles.
- In 2025, short-form video content is expected to remain dominant, with platforms such as TikTok, Instagram Reels, YouTube Shorts, and Facebook Reels at the forefront. TikTok, being the trailblazer, currently has 2.051 billion users worldwide and is anticipated to achieve 1.8 billion monthly active users by the end of 2025.
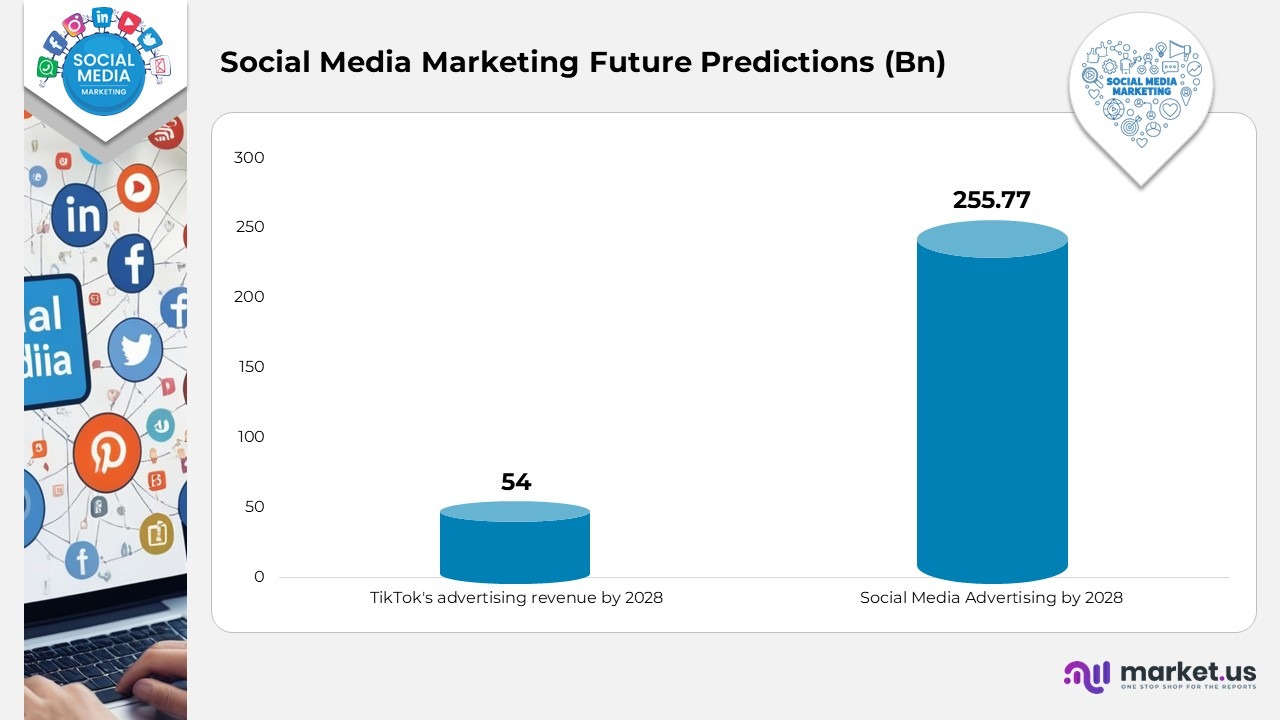
Social Media Marketing Future Predictions
- The market for social media advertising is projected to reach $255.77 billion by the year 2028.
- Additionally, TikTok’s advertising revenue is anticipated to approach nearly $54 billion globally by 2028.
Conclusion
Social media marketing plays a crucial role for businesses, as global usage and advertising expenditures are expected to rise considerably. It serves as a potent instrument for brand awareness, lead generation, and sales, with users dedicating an average of more than two hours each day on various platforms. The strategy must focus on critical aspects such as video content, user-generated content, influencer marketing, and social commerce.