


Report Overview
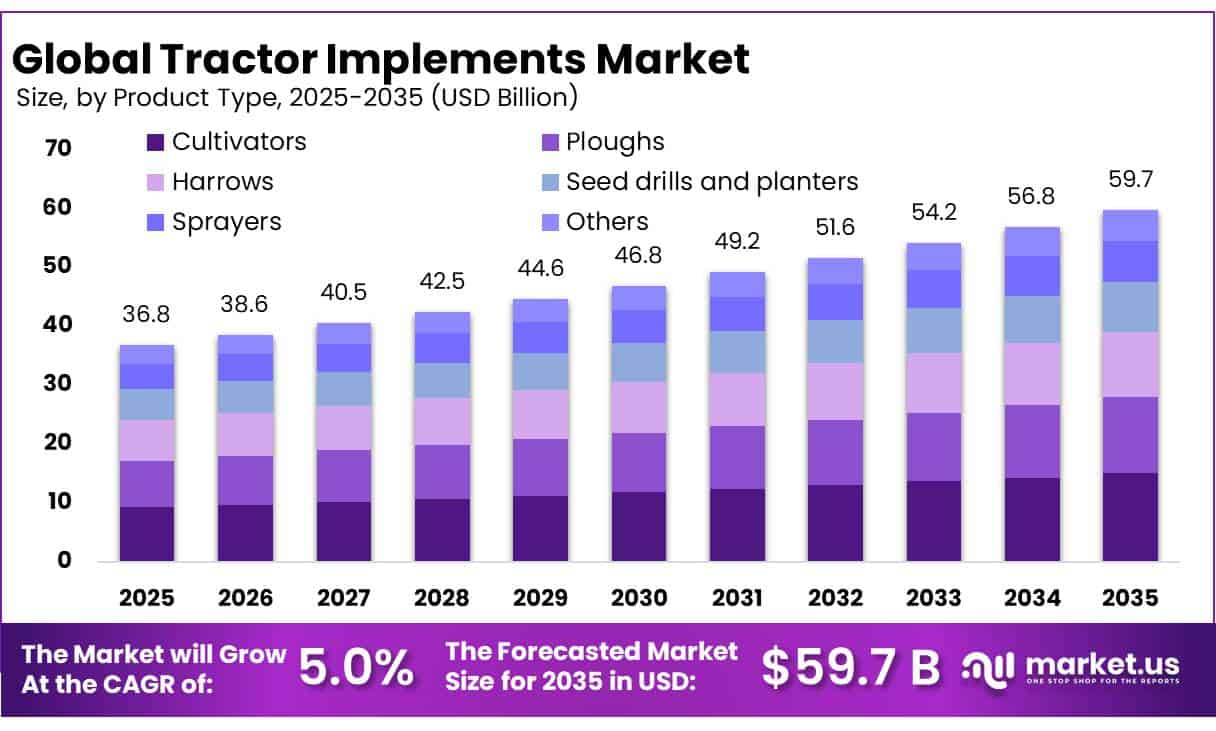
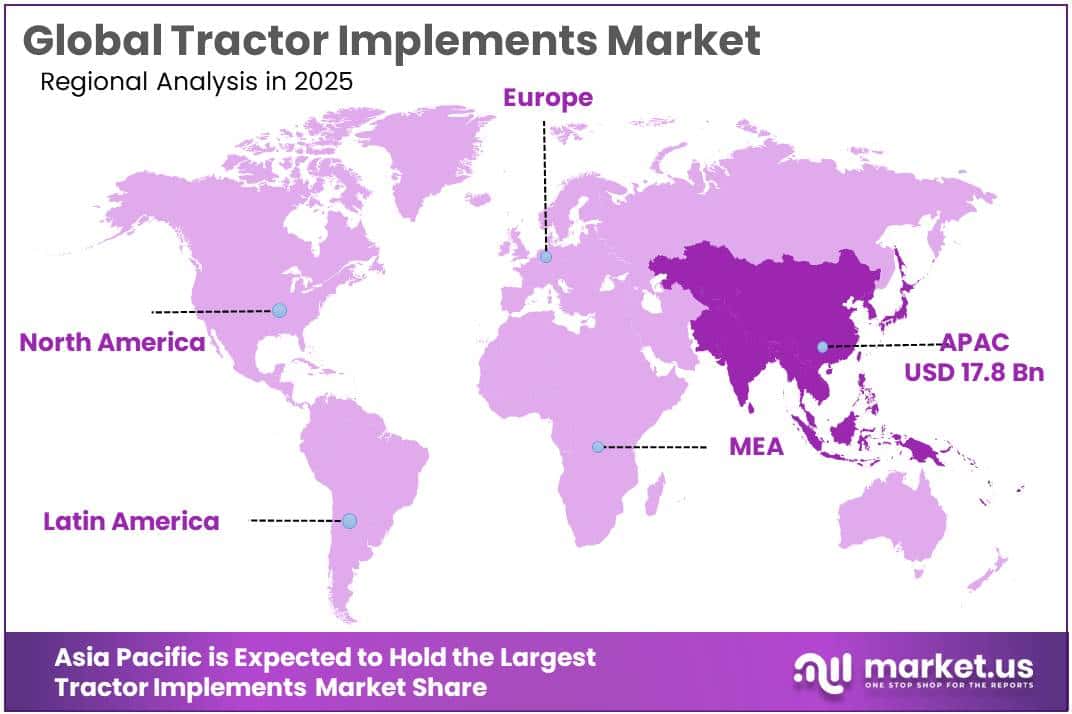
The Global Tractor Implements Market size is expected to be worth around USD 59.7 Billion by 2035, from USD 36.8 Billion in 2025, growing at a CAGR of 5.0% during the forecast period from 2026 to 2035. In 2025, Asia Pacific held a dominant market position, capturing more than a 48.60% share, holding USD 17.8 Billion revenue.
Tractor implements are agricultural tools and attachments designed to operate with tractors for activities such as soil preparation, planting, crop protection, irrigation, harvesting, and material handling. Common products include ploughs, cultivators, harrows, seed drills, planters, sprayers, rotary tillers, and trailers. These implements help farmers complete field operations more quickly, improve operational consistency, and reduce dependence on manual labour.
- The tractor implements industry is moving towards equipment that supports precision farming, better resource utilisation, and reduced field-operation time. In the European Union, 79% of farms used tractors in 2023, while approximately 65% used tillage machinery, seeders, planters, spreaders, or spraying equipment, according to Eurostat. These figures demonstrate the established role of tractor-compatible machinery in agricultural operations.
Rising labour costs, seasonal labour shortages, the need for timely cultivation, and demand for consistent crop management are supporting the adoption of tractor implements. Mechanised ploughing, seeding, spraying, and fertiliser application can help farms complete important operations within limited weather windows.
- The United States Department of Agriculture reported total farm production expenditures of USD 477.6 billion in 2024, compared with USD 481.9 billion in 2023. Although this figure covers all farm production expenses rather than tractor implements alone, it highlights the substantial operating expenditure associated with commercial agriculture.
Precision agriculture is creating opportunities for tractor implements equipped with GPS guidance, electronic controls, variable-rate application systems, and sensor-based monitoring. Eurostat reported that nearly 18% of EU farms with utilised agricultural area adopted some form of precision farming in 2023. Soil analysis was used by approximately 11% of farms, while variable-rate techniques were adopted by around 5%. These developments support demand for implements that can apply agricultural inputs more accurately and reduce unnecessary usage.
Further growth opportunities include lightweight implements, equipment designed for reduced soil disturbance, modular attachments, and smart implements compatible with existing tractor fleets. Rental services and shared machinery models can also improve access for farms that cannot justify high upfront investment.
Eurostat found that approximately 21% of EU farms relied exclusively on rented or shared conventional machinery in 2023, indicating the importance of alternative equipment-access models. However, high purchase costs, maintenance expenses, fluctuating farm income, and compatibility issues may limit adoption. Manufacturers that combine durable designs, easier servicing, operator-friendly controls, and precision technology are positioned to address changing agricultural requirements.
Key Takeaways
- Tractor Implements Market size is expected to be worth around USD 59.7 Billion by 2035, from USD 36.8 Billion in 2025, growing at a CAGR of 5.0%.
- Cultivators held a dominant market position, capturing more than a 25.00% share.
- Below 40 HP held a dominant market position, capturing more than a 43.00% share.
- Powered implements held a dominant market position, capturing more than a 58.00% share.
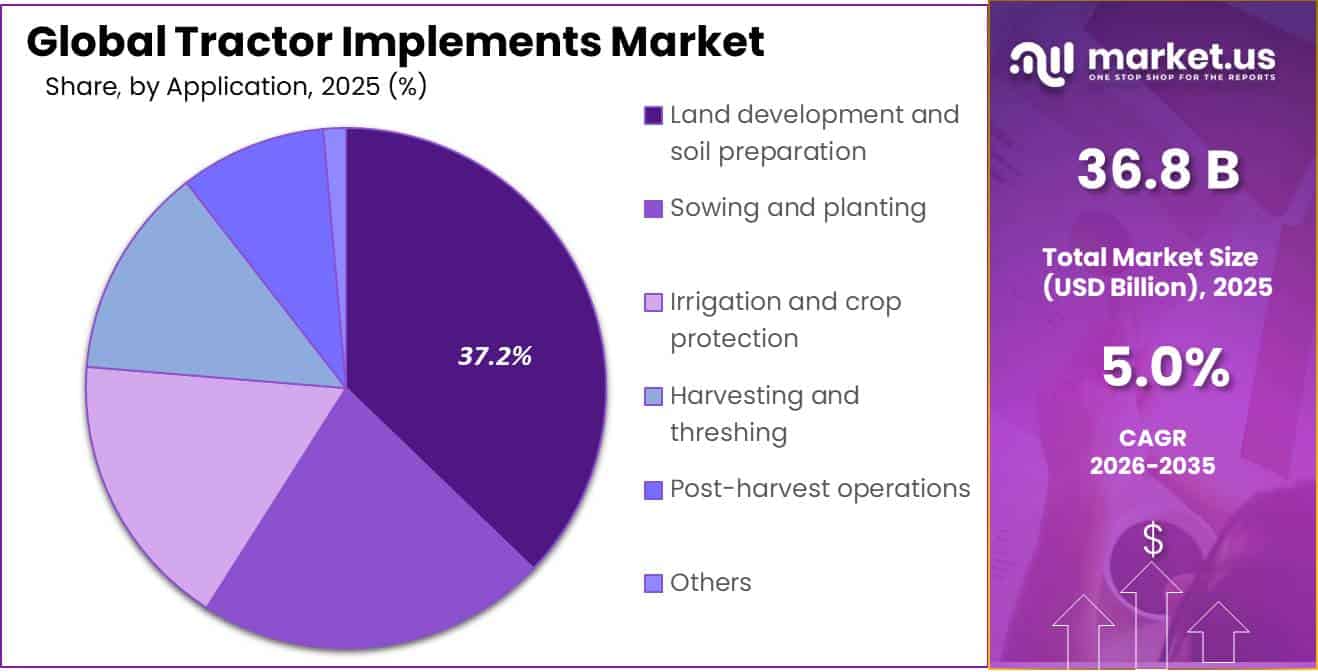
- Land development and soil preparation held a dominant market position, capturing more than a 37.00% share.
- OEM held a dominant market position, capturing more than a 65.00% share.
- Asia-Pacific held a dominant position in the Tractor Implements Market, accounting for 48.60% of the market, with a reported value of USD 17.8 billion.
By Product Type Analysis
Cultivators: Demand Supported by Efficient Soil Preparation
In 2025, “Cultivators” held a dominant market position, capturing more than a 25.00% share of the Tractor Implements Market. Cultivators play an important role in breaking up and loosening soil, controlling weeds, and preparing fields for planting. Their use across different farming operations makes them a practical choice for farms seeking timely soil preparation and improved field efficiency. Demand is supported by their compatibility with tractors and their usefulness in routine cultivation activities. The segment’s 25.00% share in 2025 represents the supplied market figure; no independent government source has been identified here that verifies this specific share.
Ploughs remain important in the Tractor Implements Market because they help turn and loosen soil before planting, incorporate crop residues, and prepare fields for cultivation. In 2025, demand for ploughs was supported by their use in conventional farming and their compatibility with different tractor models. Their selection depends on soil type, field conditions, tractor power, and the required depth of tillage.
According to, approximately 79% of farms in the European Union used tractors in 2023, while around 65% used tillage, seeding, planting, fertilising, or spraying machinery. These figures demonstrate the broad use of mechanised agricultural equipment, although they do not represent plough-specific adoption or market share. Demand for ploughs is expected to remain linked to soil preparation needs, equipment replacement, and farming practices.
By Power Rating Analysis
Below 40 HP: Compact Tractors Support Demand for Smaller Implements
In 2025, “Below 40 HP” held a dominant market position, capturing more than a 43.00% share of the Tractor Implements Market. This segment benefits from demand for compact tractors used on small farms, orchards, gardens, and specialised agricultural land. Implements designed for lower-horsepower tractors are generally suitable for lighter fieldwork, including shallow cultivation, weed control, and routine soil preparation. Their suitability for smaller plots and everyday farming tasks supports their adoption among farmers seeking practical and manageable equipment.
The 40–70 HP segment serves farms requiring a balance between operating power and versatility. In 2025, tractors in this power range were suitable for operating a variety of implements used in cultivation, ploughing, planting, and other routine field activities, depending on soil conditions and equipment requirements.
This flexibility makes the segment relevant to farms that need to perform several agricultural tasks without relying on multiple specialised tractors. Demand is influenced by farm size, crop type, implement compatibility, and the need to complete seasonal work efficiently. The provides official agricultural census data on farms, machinery, and equipment ownership that can help assess mechanisation trends. However, no verified government statistic is provided here for the specific market share of the 40–70 HP segment.
By Operation Analysis
Powered Implements: Mechanised Operations Support Market Demand
In 2025, “Powered implements” held a dominant market position, capturing more than a 58.00% share of the Tractor Implements Market. Powered implements support agricultural tasks that require active mechanical operation, including rotary tilling, spraying, planting, and other field activities. Their ability to improve work efficiency and reduce manual effort makes them useful for farms managing demanding seasonal operations. Demand is supported by the need for timely fieldwork, consistent performance, and compatibility with modern tractors.
Unpowered implements remain useful for agricultural operations that rely on tractor movement and pulling force rather than a separate powered mechanism. These implements include conventional ploughs, harrows, trailers, and certain cultivators. Their relatively simple design can make maintenance and operation easier, depending on the equipment type and field conditions. In 2025, demand for unpowered implements was linked to routine soil preparation, field levelling, and material transport. Farmers may prefer these tools where straightforward operation and lower equipment complexity are important considerations.
By Application Analysis
Land Development and Soil Preparation: Essential for Efficient Field Readiness
In 2025, “Land development and soil preparation” held a dominant market position, capturing more than a 37.00% share of the Tractor Implements Market. This segment benefits from the need to prepare farmland before sowing by loosening soil, removing weeds, levelling fields, and improving planting conditions.
Implements such as ploughs, cultivators, and harrows support these activities and help farmers complete fieldwork within suitable seasonal periods. Demand is influenced by soil conditions, farm size, and the need for efficient land management. The 37.00% share in 2025 is based on the supplied market figure and has not been independently verified by a government source.
Sowing and planting implements help farmers place seeds at suitable depths and spacing, supporting more consistent crop establishment. In 2025, demand for this segment was associated with the need to complete planting on time, reduce manual work, and improve field-operation efficiency. Tractor-mounted seed drills and planters can help maintain regular seed placement across larger areas, depending on crop requirements and soil conditions. Adoption is influenced by crop type, tractor compatibility, equipment cost, and farm size.
By Sales Channel Analysis
OEM: Direct Supply Supports Demand for Tractor Implements
In 2025, “OEM” held a dominant market position, capturing more than a 65.00% share of the Tractor Implements Market. Original equipment manufacturers benefit from supplying implements through established tractor manufacturing and distribution networks. This channel allows farmers to purchase compatible equipment alongside new tractors, with product specifications matched to tractor power and operating requirements. OEM sales are also supported by warranty coverage, technical guidance, and access to authorised service facilities. The 65.00% share in 2025 is based on the supplied market figure and has not been independently verified through government statistics.
The aftermarket segment serves farmers who purchase implements separately from new tractors or replace existing equipment as farming needs change. In 2025, demand was supported by equipment wear, repair requirements, changing crop practices, and the need to add specialised attachments to existing tractor fleets. Independent dealers, agricultural equipment retailers, and repair providers help farmers access replacement parts and suitable implements. The aftermarket also gives farm operators flexibility to upgrade equipment without replacing their tractors.
Key Market Segments
By Product Type
- Ploughs
- Harrows
- Cultivators
- Seed drills and planters
- Sprayers
- Others
By Power Rating
- Below 40 HP
- 40–70 HP
- Above 70 HP
By Operation
- Powered implements
- Unpowered implements
By Application
- Land development and soil preparation
- Sowing and planting
- Irrigation and crop protection
- Harvesting and threshing
- Post-harvest operations
- Others
By Sales Channel
- OEM
- Aftermarket
Driver Analysis
Farm-Labor Substitution
Farm-labor scarcity raises the economic value of tractor-mounted and trailed implements because a mechanized pass can replace repetitive manual work in land preparation, sowing, fertiliser placement, spraying, inter-row cultivation, residue handling, haymaking, and harvesting support, while also compressing field operations into narrower weather windows. In the United States, guidance/autosteering systems were used on tractors, harvesters, and other equipment by 52% of midsize crop farms and 70% of large crop farms in 2023, up from single-digit rates in the early 2000s, indicating that mechanized field operations are already becoming digitally optimized rather than solely labor-replacing.
An original 50-hectare cereal farm requiring three manual operations at 12 labor-hours per hectare would consume about 1,800 labor-hours; a tractor-plus-implement workflow operating at 1.5-2.5 hours per hectare can reduce direct field time to 225-375 machine-hours, releasing 1,400-1,600 labor-hours while enabling more consistent depth, seed placement, and timing.
This changes dealer economics from tractor sales to implement matching, maintenance plans, financing, and operator training, because the implement determines the crop-specific productivity obtained from tractor horsepower. Demand is strongest where seasonal-worker availability is constrained or wages rise faster than farm-gate prices, supporting an estimated +2.0 percentage-point short-term CAGR contribution in North America, Europe, India, and Japan.
Drivers Impact Analysis
| Driver | (~) % Impact on CAGR Forecast | Geographic Relevance | Impact Timeline |
|---|---|---|---|
| Farm-Labor Substitution | +2.0% | North America, EU, India, Japan | Short term (≤ 2 years) |
| Subsidized Mechanization Access | +1.8% | India, ASEAN, Africa, Latin America | Medium term (2-4 years) |
| Precision Attachment Upgrades | +1.5% | North America, EU, Brazil, Australia | Medium term (2-4 years) |
| Residue-Management Mandates | +1.3% | India, China, EU, North America | Short term (≤ 2 years) |
| Multi-Crop Implement Demand | +1.1% | India, ASEAN, Africa, Latin America | Medium term (2-4 years) |
| Conservation-Tillage Adoption | +0.9% | Americas, EU, Australia, Kazakhstan | Long term (≥ 4 years) |
Restraint Analysis
Small-Farm Ownership Economics
Small and fragmented landholdings suppress private ownership of specialized implements because the annual utilization of a rotavator, planter, baler, precision seeder, laser leveler, mulcher, or residue-management tool can be too low to amortize its acquisition, maintenance, storage, and financing cost. An original 1-hectare farm needing 8-15 machine-hours per year for field preparation and seeding cannot economically justify a USD 2,500 implement that requires USD 450-650 in annualized capital recovery, insurance, maintenance, and storage, equivalent to USD 30-80 per machine-hour before tractor fuel and operator cost; the same tool becomes viable when a custom-hiring center uses it 400-700 hours annually at USD 12-20 per hour.
India’s farm-mechanization framework explicitly targets Custom Hiring Centres, Farm Machinery Banks, and group ownership because individual ownership is structurally weak for marginal farmers; 2025 SMAM guidelines allow 40% support for CHCs in general areas and 50% in hilly or northeastern areas, while Farm Machinery Banks may receive 80% assistance up to INR 1 million. This dependence on shared-access models slows direct unit sales, makes demand seasonal and geographically concentrated, and shifts suppliers toward dealer-owned fleets, rentals, and service contracts rather than traditional retail margins; it produces an estimated -2.0 percentage-point long-term CAGR restraint across India, ASEAN, Africa, and Latin America.
Restraint Impact Analysis
| Restraint | (~) % Impact on CAGR Forecast | Geographic Relevance | Impact Timeline |
|---|---|---|---|
| Small-Farm Ownership Economics | -2.0% | India, ASEAN, Africa, Latin America | Long term (≥ 4 years) |
| Steel And Component Inflation | -1.5% | North America, EU, import-dependent APAC | Short term (≤ 2 years) |
| Farm Credit Constraints | -1.3% | India, Africa, Latin America, ASEAN | Medium term (2-4 years) |
| Tractor-Implement Mismatch | -1.0% | India, Africa, ASEAN, Latin America | Medium term (2-4 years) |
| Seasonal Utilization Limits | -0.9% | Global cereal regions | Long term (≥ 4 years) |
| Subsidy Approval Delays | -0.7% | India, EU, Africa, developing APAC | Medium term (2-4 years) |
Opportunity Analysis
Pay-Per-Acre Fleets
Pay-per-acre fleets are an untapped monetization pivot rather than a current mechanization driver because most implement OEMs still recognize revenue at equipment delivery, while millions of smaller farms need field capacity but cannot justify low-utilization ownership; India’s policy architecture already treats Custom Hiring Centres (CHCs), machinery banks, cooperatives, FPOs, self-help groups, and rural entrepreneurs as access channels, and its 2025 SMAM revision provides the operating framework for subsidized machinery deployment.
An analyst scenario for a seven-implement fleet costing USD 70,000 and serving 1,500 hectares annually at USD 35-55 per hectare produces USD 52,500-82,500 of yearly billings; at 60% utilization, 25% direct operating cost, 10% maintenance, and 8% dispatch/administration, EBITDA can reach roughly USD 14,000-28,000 before financing, while telematics, dynamic routing, prepaid acreage, and harvest-linked repayment could lower contractor customer-acquisition cost by 15-25% and raise attachment utilization from an ownership-model norm of 100-200 hours to 500-900 hours per year.
India’s DBT portal already supports digital registration, permits, physical verification, CHC approvals, back-ended subsidies, and payment-file generation, reducing the platform infrastructure an OEM must build independently. OEMs can capture the white space through franchise fleets, guaranteed uptime, seasonal swaps, per-acre billing, operator certification, embedded credit, and parts subscriptions, shifting gross profit from a single 10-18% equipment margin toward multi-year service economics; successful replication across India, ASEAN, Africa, and Latin America could add about 2.0 percentage points to CAGR within two years, but only if manufacturers solve dispatch density, operator quality, working capital, and monsoon-linked utilization risk.
Opportunity Impact Analysis
| Opportunity | (~) % Potential CAGR Upside | Geographic Relevance | Execution Window |
|---|---|---|---|
| Pay-Per-Acre Fleets | +2.0% | India, ASEAN, Africa, LatAm | Short term (≤ 2 years) |
| Autonomous Retrofit Kits | +1.7% | North America, EU, Australia, Japan | Medium term (2-4 years) |
| Residue Supply-Chain Fleets | +1.5% | India, China, EU, Americas | Short term (≤ 2 years) |
| Carbon-MRV Implements | +1.2% | EU, North America, Australia | Medium term (2-4 years) |
| Open-Data Service Platforms | +1.0% | EU, North America, Brazil | Medium term (2-4 years) |
| Remanufactured Implement Networks | +0.9% | India, Africa, LatAm, Eastern Europe | Short term (≤ 2 years) |
Challenges Analysis
Operator Skills Gap
Operator capability is a long-cycle constraint because implement productivity depends on calibration, hitching, PTO-speed selection, depth control, ballast, overlap management, row alignment, residue settings, preventive maintenance, and safe transport—not only on tractor horsepower or attachment availability. A 6-row planter operating at 10% seed-metering error can over- or under-place seed across 10 hectares out of every 100 hectares worked; at a USD 120-250 per hectare seed-and-establishment cost, this implies USD 1,200-2,500 of avoidable value loss before uneven emergence and yield penalties, while incorrect tiller depth can increase fuel consumption by 10-20% and accelerate blade wear by 15-30%.
The constraint is systemic in contractor-led regions because one undertrained operator managing 600-1,000 seasonal machine-hours can expose 50-100 farms to inconsistent field outcomes and warranty claims. FAO’s sustainable-mechanization curriculum specifically treats selection, assessment, purchase, operation, maintenance, local-market assessment, and hire-service management as separate skills, with training modules ranging from 20 minutes to more than two hours—an indication that farm mechanization requires layered technical and business competency rather than a single machine handover.
OEMs must embed dealer academies, multilingual digital work instructions, simulator-based certification, telematics-led coaching, and pay-for-quality contractor scorecards, but upgrading a dispersed rural operator base takes multiple crop cycles, creating an estimated -1.4 percentage-point long-term drag across India, Africa, ASEAN, and Latin America.
Challenges Impact Analysis
| Challenge | (~) % CAGR Friction Drag | Geographic Relevance | Mitigation Horizon |
|---|---|---|---|
| Operator Skills Gap | -1.4% | India, Africa, ASEAN, LatAm | Long term (≥ 4 years) |
| Mixed-Fleet Compatibility | -1.2% | Global farm machinery hubs | Medium term (2-4 years) |
| Parts-Service Coverage | -1.1% | Africa, LatAm, rural APAC | Medium term (2-4 years) |
| Digital Data Interoperability | -0.9% | EU, North America, Australia | Medium term (2-4 years) |
| Variable Field Conditions | -0.8% | India, Africa, ASEAN, LatAm | Long term (≥ 4 years) |
| Rental-Fleet Utilization | -0.7% | India, China, Africa, LatAm | Medium term (2-4 years) |
Geopolitical Impact Analysis
Geopolitical Impact of Ongoing Wars on the Tractor Implements Market
The ongoing Russia–Ukraine war and the 2026 conflict affecting Iran and the wider Gulf region are placing pressure on the Tractor Implements Market through higher energy costs, shipping disruptions, and uncertain raw material supplies. These pressures can increase manufacturing and transportation costs for implements made from steel and other industrial materials. The World Trade Organization reported that urea prices rose from around USD 400 per metric tonne to more than USD 850 in April 2026, before falling to USD 453 in June 2026, highlighting the volatility caused by Gulf supply disruptions.
Higher fuel, freight, and insurance expenses may also increase distribution costs for ploughs, cultivators, seeders, and other tractor attachments. Farmers facing higher fertiliser and operating expenses may delay equipment purchases, particularly when farm income is uncertain. However, the need to complete seasonal fieldwork can sustain demand for essential implements. Manufacturers may respond by diversifying suppliers, improving inventory planning, and strengthening local distribution networks. The overall impact will depend on conflict duration, shipping route stability, and the cost of industrial inputs.
Regional Insights
Dominating Region: Asia-Pacific
In 2025, Asia-Pacific held a dominant position in the Tractor Implements Market, accounting for 48.60% of the market, with a reported value of USD 17.8 billion. Regional demand is supported by extensive agricultural activity, diverse crop production, and the need for efficient soil preparation, cultivation, and planting. China, Japan, and Southeast Asian countries contribute to demand through established agricultural machinery industries and the gradual adoption of mechanised farming. The Food and Agriculture Organization (FAO) identifies mechanisation as an important way to improve farm productivity, reduce physical labour, and support timely agricultural operations.
Asia-Pacific also presents strong growth opportunities as farmers increasingly seek implements that improve operating efficiency and reduce manual work. Demand is expected to benefit from greater use of tractor-mounted seeders, cultivators, sprayers, and specialised attachments. Precision agriculture, equipment rental services, and access to affordable machinery may further support adoption among farms with different operating budgets.
Key Regions and Countries Insights
- North America
- US
- Canada
- Europe
- Germany
- France
- The UK
- Spain
- Italy
- Rest of Europe
- Asia Pacific
- China
- Japan
- South Korea
- India
- Australia
- Rest of APAC
- Latin America
- Brazil
- Mexico
- Rest of Latin America
- Middle East & Africa
- GCC
- South Africa
- Rest of MEA
Key Players Analysis
Deere & Company is a major agricultural equipment manufacturer offering tractors, tillage equipment, planting machinery, and precision farming technologies. In fiscal year 2025, the company reported total net sales and revenues of USD 45.684 billion, while equipment operations generated USD 38.917 billion. Its product range and established dealer network support farmers seeking compatible implements and machinery for different field operations. Investment in precision agriculture and connected equipment strengthens its position in mechanised farming.
CNH Industrial N.V. serves the agricultural equipment industry through its Case IH and New Holland brands, offering tractors, tillage machinery, planting equipment, and related farming solutions. In 2025, its agriculture business generated net revenues of USD 12.405 billion, down 11.4% from 2024. The company focuses on equipment innovation, farming productivity, and supporting farmers through its product and dealer networks. Its agricultural machinery portfolio strengthens its role in supplying equipment for land preparation and crop production.
AGCO Corporation manufactures agricultural machinery and precision farming technologies through brands including Fendt, Massey Ferguson, Valtra, and PTx. In 2025, the company recorded net sales of USD 10.082 billion, while research and development expenditure reached USD 487.7 million. AGCO’s equipment portfolio and investment in smart farming technologies support demand for efficient agricultural operations. Its global distribution network also helps farmers access machinery, technical assistance, and precision agriculture solutions. These capabilities support its position in the wider tractor and implements industry.
Top Key Players Outlook
- Deere & Company
- CNH Industrial N.V.
- AGCO Corporation
- CLAAS KGaA mbH
- Kubota Corporation
- Mahindra & Mahindra Limited
- KUHN Group
- Bucher Industries AG
- Alamo Group Inc.
- Kverneland Group
- AMAZONEN-WERKE H. Dreyer SE & Co. KG
- Maschio Gaspardo S.p.A.
- LEMKEN GmbH & Co. KG
- HORSCH Maschinen GmbH
- Väderstad AB
Recent Developments
- In February 2026, Kubota led a €6.5 million funding round for Norwegian agricultural technology company Kilter and announced a distribution partnership to offer its precision spraying technology through Kubota dealers in Germany and the Netherlands
- In February 2026, Mahindra announced a planned investment of ₹15,000 crore over 10 years in Maharashtra, including a new integrated manufacturing facility spread across 1,500 acres in Nagpur and a 150-acre supplier park in Sambhajinagar.
Report Scope
| Report Features | Description |
|---|---|
| Market Value (2025) | USD 36.8 Bn |
| Forecast Revenue (2035) | USD 59.7 Bn |
| CAGR (2026-2035) | 5.0% |
| Base Year for Estimation | 2025 |
| Historic Period | 2020-2024 |
| Forecast Period | 2026-2035 |
| Report Coverage | Revenue Forecast, Market Dynamics, Competitive Landscape, Recent Developments |
| Segments Covered | By Product Type (Ploughs, Harrows, Cultivators, Seed drills and planters, Sprayers, Others), By Power Rating (Below 40 HP, 40–70 HP, Above 70 HP), By Operation (Powered implements, Unpowered implements), By Application (Land development and soil preparation, Sowing and planting, Irrigation and crop protection, Harvesting and threshing, Post-harvest operations, Others), By Sales Channel (OEM, Aftermarket) |
| Regional Analysis | North America – US, Canada; Europe – Germany, France, The UK, Spain, Italy, Rest of Europe; Asia Pacific – China, Japan, South Korea, India, Australia, Singapore, Rest of APAC; Latin America – Brazil, Mexico, Rest of Latin America; Middle East & Africa – GCC, South Africa, Rest of MEA |
| Competitive Landscape | Deere & Company, CNH Industrial N.V., AGCO Corporation, CLAAS KGaA mbH, Kubota Corporation, Mahindra & Mahindra Limited, KUHN Group, Bucher Industries AG, Alamo Group Inc., Kverneland Group, AMAZONEN-WERKE H. Dreyer SE & Co. KG, Maschio Gaspardo S.p.A., LEMKEN GmbH & Co. KG, HORSCH Maschinen GmbH, Väderstad AB |
| Customization Scope | Customization for segments, region/country-level will be provided. Moreover, additional customization can be done based on the requirements. |
| Purchase Options | We have three licenses to opt for: Single User License, Multi-User License (Up to 5 Users), Corporate Use License (Unlimited User and Printable PDF) |








