
Quick Navigation
- Ship to Ship Transfer Service Market Size and Forecast – 2026-2033
- Ship to Ship Transfer Service Market Key Takeaways
- Ship to Ship Transfer Service Market Overview
- Type Analysis
- Ship Type Analysis
- Fit Analysis
- Connectivity Analysis
- Application Analysis
- Ship to Ship Transfer Service Market Segments
- Ship-to-Ship Transfer Service Cost Structure by Cargo and Operation Type
- Ship to Ship Transfer Service Market Drivers
- Ship to Ship Transfer Service Market Restraints
- Expert Commentary: The STS Market’s Structural Tension in 2025–2026
- Ship to Ship Transfer Service Market Emerging Trends
- Ship to Ship Transfer Service Market Growth Factors
- Ship to Ship Transfer Service Market Regional Analysis
- Key Regions and Countries
- Key Ship to Ship Transfer Service Market Company Insights
- Recent Developments
- Report Scope
Ship to Ship Transfer Service Market Size and Forecast – 2026-2033
The global Ship to Ship Transfer Service market will reach USD 2.5 billion by 2034 from USD 1.5 billion in 2025, growing at a CAGR of 5.9% during 2026 to 2035. This growth reflects locked-in demand from the 60% of containership capacity ordered on dual-fuel LNG propulsion in the first 10 months of 2025, per Global Maritime Hub. South Korean and Chinese shipyards contracted 35 new LNG carrier orders in Q1 2026 alone — nearly matching the 37 contracted across all of 2025 — signaling accelerating fleet growth that will sustain STS service volumes well into the next decade.

Ship to Ship Transfer Service Market Key Takeaways
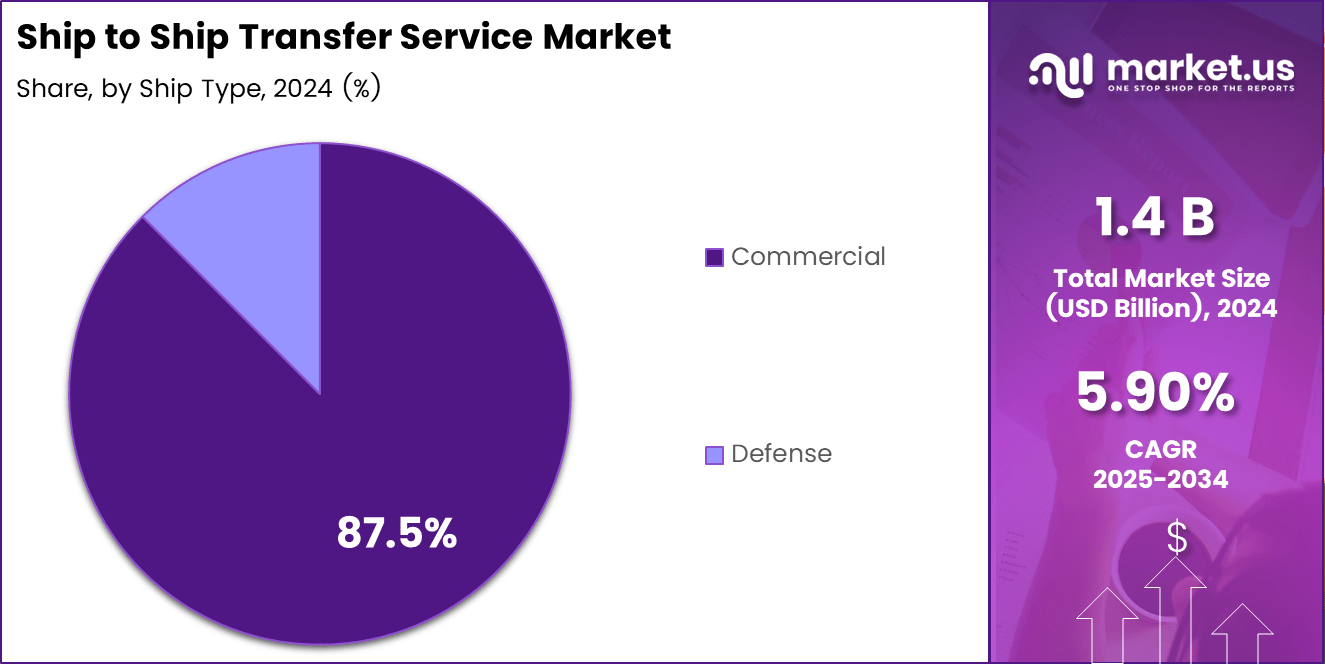
- The global Ship to Ship Transfer Service market was valued at USD 1.5 billion in 2025 and will reach USD 2.5 billion by 2034, growing at a CAGR of 5.9%
- By Type: Stationary leads with a 57.2% share in 2025
- By Ship Type: Commercial ships lead the segment
- By Fit: Line Fit dominates with a 67.7% share in 2025
- By Connectivity: Ship-to-Shore leads with a 59.9% share in 2025
- By Application: Crude Oil leads with a 51.4% share in 2025
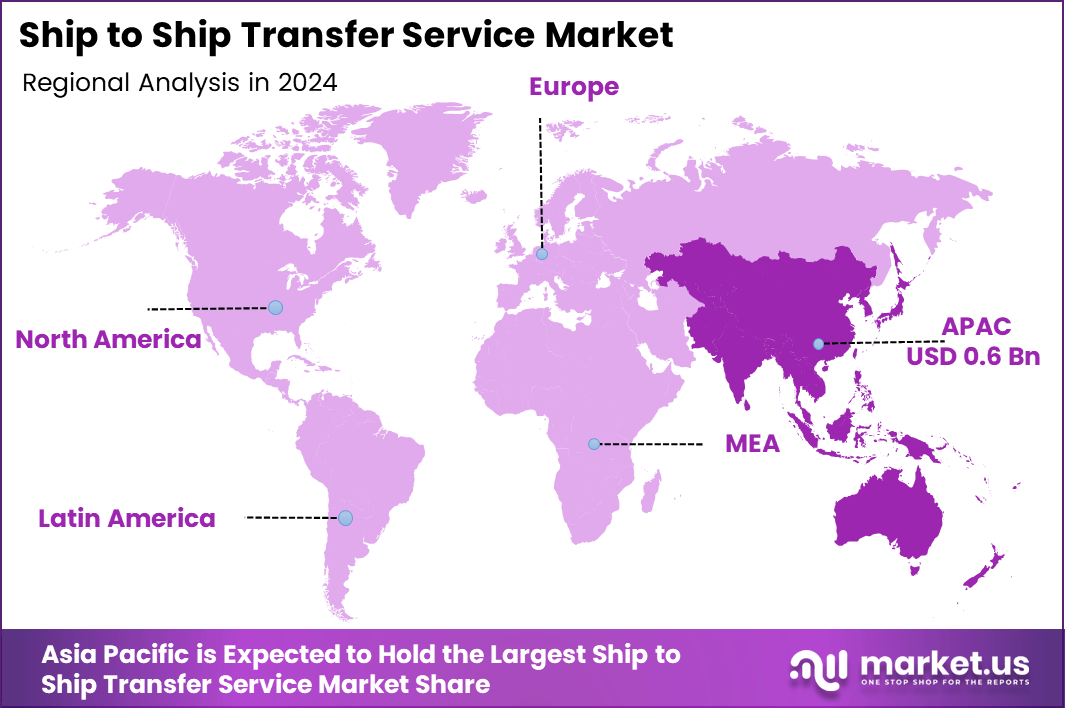
- Asia Pacific leads all regions with a 49.9% share valued at USD 0.6 billion in 2025
Ship to Ship Transfer Service Market Overview
The ship to ship transfer service market covers the full range of at-sea cargo transfer operations between two vessels, including crude oil lightering, LNG bunkering, LPG transshipment, bulk cargo transfers, and defense replenishment-at-sea. This market serves energy majors, independent tanker operators, naval procurement agencies, LNG importers, and commodity traders who require port-independent cargo movement across global shipping corridors.
Ship to ship transfers solve a structurally critical problem: vessels too large to berth at port terminals — or operating in sanctions-sensitive or infrastructure-light zones — require offshore cargo exchange to move product efficiently. The offshore oil ship to ship transfer and FSRU ship to ship transfer segments now serve as primary supply-chain infrastructure for emerging-market LNG importers, energy traders routing around port congestion, and naval ship to ship replenishment operations that cannot rely on fixed basing.
Scale and velocity define the 2025 market context. The Strait of Hormuz averaged 144 ship transits per day by mid-June 2025, with 37% tankers and 13% gas carriers, per UNCTAD RMT 2025. Alongside this, around 800 LNG-fuelled ships operated globally by mid-2025, with nearly 1,000 additional vessels on order, per SEA-LNG. India’s LNG imports reached approximately 25.5 million metric tonnes in 2025, with 2026 imports forecast at 28–29 million metric tonnes per Petronet LNG, expanding FSRU-dependent STS volumes across South Asia.
Type Analysis
Stationary STS dominates with 57.2% due to superior operational control and cargo safety.
In 2025, Stationary ship to ship transfer held a dominant position in the By Type segment with a 57.2% share. Stationary operations — where both vessels anchor or hold position at a designated offshore location — allow mooring masters to control fender placement, hose connection sequencing, and manifold pressure without the compounding variables introduced by vessel motion. This means energy majors and LNG importers running high-value cargoes consistently prefer stationary STS.
Sailing STS captures the minority share in the By Type segment. However, sailing operations — where both vessels steam in parallel during transfer — serve open-ocean corridors where anchoring is impractical. Operators across West African offshore crude zones and North Sea gas carrier routes rely on sailing STS to maintain schedule velocity when anchorages are congested, making this sub-segment operationally critical even at a lower share.
Ship Type Analysis
Commercial vessels dominate due to extensive global fuel and cargo transfer requirements.
In 2025, Commercial ships held a leading position in the By Ship Type segment. Commercial vessels — spanning VLCCs, Aframax tankers, LNG carriers, LPG carriers, and container ships — account for the overwhelming majority of global STS transfer activity because energy trade, commodity flows, and LNG supply chains all operate on commercial tonnage. This means STS service providers design their equipment specifications, crew certifications, and insurance frameworks almost entirely around commercial vessel parameters.
Defense vessels represent a distinct and growing STS demand category. Naval ship to ship replenishment operations — including underway replenishment of fuel, stores, and munitions — require specialized STS rigs, high-strength transfer hoses, and mooring systems rated for higher sea states than commercial lightering. Beyond this, navy procurement agencies in the US, UK, and Indo-Pacific are expanding replenishment-at-sea fleets, building a consistent institutional demand stream.
Fit Analysis
Line Fit dominates with 67.7% due to factory-integrated STS systems reducing total installation cost.
In 2025, Line Fit held a dominant position in the By Fit segment with a 67.7% share. Line Fit refers to STS transfer systems — fender attachment points, manifold configurations, mooring equipment foundations, and hydraulic hose handling gear — installed during original vessel construction. Shipowners consistently select Line Fit because integrating STS capacity at the build stage costs significantly less than post-delivery modification, reducing lifecycle STS operating expenses.
Retrofit STS fit captures the remaining share in the By Fit segment. Retrofit installations — where STS-capable fender systems, quick-release couplings, and manifold adapters are added to vessels already in service — serve fleet operators who face charter contracts or trade route changes requiring STS certification after original build. Retrofit demand tracks geopolitical disruptions and unexpected trade route shifts.
Connectivity Analysis
Ship-to-Shore connectivity dominates with 59.9% due to FSRU terminal and port-feeder transfer demand.
In 2025, Ship-to-Shore connectivity held a dominant position in the By Connectivity segment with a 59.9% share. Ship-to-Shore STS operations — where a seagoing vessel transfers cargo to a fixed or floating terminal such as an FSRU, FSO, or nearshore storage unit — represent the structural backbone of LNG import infrastructure in emerging markets. This explains why the FSRU buildout is directly expanding Ship-to-Shore STS service volumes.
Ship-to-Ship direct connectivity captures the remaining share in the By Connectivity segment. Ship-to-Ship operations — where two mobile vessels transfer cargo in open water without any fixed infrastructure — serve crude oil lightering, LNG transshipment, shadow fleet crude transfers, and naval replenishment scenarios. This segment is more geopolitically sensitive than Ship-to-Shore, as dark fleet crude routing inflates demand beyond terminal-based models.
Application Analysis
Crude oil STS transfers dominate with 51.4% due to VLCC draft limits and offshore lightering economics.
In 2025, Crude oil ship to ship transfer held a dominant position in the By Application segment with a 51.4% share. VLCCs carrying 2 million barrels or more routinely exceed the draft limits of shallow-approach terminals, requiring offshore lightering to Aframax-class vessels before port entry. This structural constraint means crude STS demand is largely independent of spot market volatility — terminal depth limitations exist regardless of oil price.
LPG ship to ship transfer operations hold a material share in the By Application segment. LPG transshipment — covering propane, butane, and ammonia precursor cargoes — requires cryogenic-rated hoses, vapor-return systems, and gas-detection protocols that differ substantively from crude STS. In May 2025, MOL took delivery of the Energia Grandeur, an LPG-powered newbuilding carrier serving TotalEnergies, directly expanding LPG STS capacity under MOL’s BLUE series program.
Bulk Cargo STS applications serve dry commodity flows including grain, coal, and mineral concentrates. Bulk STS transfers — typically conducted via conveyor-equipped floating transfer units or grab-crane barges — address port draft restrictions and transshipment hub economics in Southeast Asia and West Africa. However, bulk cargo STS commands lower per-tonne service margins than crude or LNG because cargo value density is lower, which means bulk STS operators compete primarily on transfer rate efficiency.
Others in the By Application segment capture chemical tanker STS, methanol bunkering, and emerging green fuel transfers. Chemical ship to ship transfer requires compatibility verification between chemical-grade hoses and cargo manifolds for each transfer, adding complexity that supports premium service pricing. More importantly, in February 2026, MOL completed Japan’s first ship-to-ship methanol bunkering at a Yokohama anchorage per MOL — signaling that the Others category will grow as alternative marine fuels reach commercial scale.
Ship to Ship Transfer Service Market Segments
By Type
- Stationary
- Sailing
By Ship Type
- Commercial
- Defense
By Fit
- Line Fit
- Retrofit
By Connectivity
- Ship-to-Shore
- Ship-to-Ship
By Application
- Crude Oil
- LPG
- Bulk Cargo
- Others
Ship-to-Ship Transfer Service Cost Structure by Cargo and Operation Type
STS service costs vary considerably based on cargo hazard level, vessel size, equipment mobilization distance, and mooring master certification requirements. The table below reflects indicative fee ranges drawn from operator disclosures and industry rate benchmarks.
| Cargo / Operation Type | Key Cost Drivers | Indicative Fee Range (USD) |
|---|---|---|
| Crude Oil Lightering (VLCC offshore) | Fender hire, mooring master, hose string, pilot vessel | $80,000 – $150,000 per operation |
| Refined Products (in-port, smaller tankers) | Shorter setup, sheltered water, lower equipment grade | $25,000 – $50,000 per operation |
| LNG / LPG Cryogenic Transfer | Insulated hoses, vapor-return systems, gas-detection rigs, specialist crew | $120,000 – $250,000 per operation |
| Bunkering via STS (fuel between vessels) | Smaller volumes, standard hose configuration | $10,000 – $30,000 per operation |
| Chemical Tanker STS | Cargo compatibility checks, IBC Code compliance, chemical-grade hose sets | $40,000 – $90,000 per operation |
| Ammonia / Alternative Fuel STS (pilot stage) | Cryogenic protocols, hazmat crew certification, emergency response staging | $150,000 – $300,000+ per operation |
LNG and ammonia operations command the highest per-transfer fees because cryogenic hose systems, vapor-return infrastructure, and specialist gas handling crews represent fixed mobilization costs that do not scale proportionally with cargo volume. Crude oil lightering fees, by contrast, reflect a mature, competitive service market where VLCC draft constraints create consistent recurring demand regardless of oil price cycles. For operators evaluating STS procurement, total cost of transfer extends beyond the service fee to include war-risk insurance surcharges — which increased materially across Strait of Hormuz and Red Sea corridors from 2024 onward — and EU ETS carbon allowance surrender costs for transfers involving vessels calling at European ports.
Ship to Ship Transfer Service Market Drivers
LNG Fleet Expansion Drives 27% More Carriers in 2026
Global seaborne LNG trade expansion accelerates STS transfer demand as the global LNG carrier fleet reaches around 700 vessels handling about 400 million tonnes of annual trade, with 100 new LNG carriers scheduled for delivery in 2026 — up 27% from 79 in 2025 — per OilPrice.com. Each additional carrier entering service creates new STS bunkering and transshipment touchpoints across global trade lanes. In our view, Maersk’s February 2026 order for 8 LNG dual-fuel 18,600 TEU container ships per Maersk confirms that fleet investment is locking in STS LNG bunker demand for the decade ahead.
LNG Bunkering Demand Hits 3.8M Tonnes in 2025
Worldwide LNG bunkering volume growth fuels global STS bunker service demand as LNG bunkering demand reached 3.8 million tonnes in 2025, a 46% year-on-year increase, per Ship & Bunker. Singapore supplied 570 kt, Rotterdam supplied 440 kt, and China recorded 125% year-on-year growth across Shanghai, Shenzhen, and Ningbo. This geographic spread confirms that LNG ship to ship transfer services are no longer concentrated in a single hub — operators deploying bunker vessels across all three corridors simultaneously hold a decisive market position.
Dark Fleet Operations Fuel Crude STS Demand
Global sanctions-evasion shadow fleet operations drive worldwide dark fleet ship-to-ship transfer crude transshipment, with the IMO identifying 1,300–1,400 dark fleet vessels in 2025 — nearly half of them crude oil tankers operating across the Strait of Hormuz, Malacca Strait, and Gulf of Oman, per IMO. These vessels conduct covert STS transfers to obscure cargo origin and disrupt AIS tracking. As a result, specialist STS monitoring and compliance service providers face structurally higher demand even as sanctions enforcement intensifies.
68% of 2025 Alt-Fuel Newbuilds Were LNG-Propelled
Global alternative-fuel newbuild ordering locks in long-term STS demand — 68% of 275 alternative-capable vessels ordered in 2025 were LNG-propelled per DNV, with MSC (92), Maersk (62), CMA CGM (34), and Hapag-Lloyd (24) LNG dual-fuel vessels on order. MSC ordered 8 × 11,500 TEU LNG dual-fuel containerships from Jinglu Shipyard for approximately USD 1.12 billion in February 2026 per Jinglu Shipyard, while CMA CGM confirmed a 6-vessel order with India’s Cochin Shipyard at USD 187 million per Cochin Shipyard. STS operators with multi-corridor LNG bunker capacity are positioned to capture this demand wave as these vessels enter service from 2028 onward.
Ship to Ship Transfer Service Market Restraints
Sanctions Tighten Compliance on STS Operators
Worldwide sanctions enforcement tightens the compliance burden on global STS operators as the UK, EU, and US collectively sanction dark fleet vessels tied to Russian-origin STS transfers — including tanker Mersin listed in the IMO Current Awareness Bulletin of December 2025, per IMO. Sanctions designation exposes STS service providers and P&I clubs to secondary liability if they service listed vessels. As a result, compliant operators face rising due-diligence costs that widen the cost gap with shadow fleet competitors.
MARPOL STS Compliance Adds Cost and Training Burden
Global cost escalation for cryogenic STS equipment limits emerging-market adoption as the OCIMF/ICS/CDI/SIGTTO STS Transfer Guide 2nd Edition (2025) imposes stricter safety, training, and documentation standards across oil, chemical, LPG, and LNG operations, per OCIMF. Smaller independent STS providers in Southeast Asia and West Africa face disproportionate compliance costs relative to fleet size. Critically, this dynamic accelerates consolidation toward large certified operators who can absorb training and documentation overhead at scale.
Geopolitical instability across key STS corridors — including the Strait of Hormuz, the Red Sea, and the Gulf of Aden — introduces operational risk that raises insurance premiums and forces route deviations for STS-service vessels. War risk surcharges applied by Lloyd’s of London and P&I clubs increased materially since 2024, compressing margins for operators unable to pass these costs to charterers. This explains why STS operators with diversified corridor coverage — spanning both Atlantic and Indo-Pacific zones — command premium service rates over single-corridor specialists.
Expert Commentary: The STS Market’s Structural Tension in 2025–2026
The most acute operational challenge facing STS service providers in 2025 is not volume — seaborne crude flows and LNG bunkering demand are both growing — but the speed at which regulatory and fuel transition requirements are outpacing infrastructure and crew readiness. Philippos Ioulianou, Managing Director of EmissionLink, summarized the broader maritime predicament in December 2025: “Regulation is running ahead of infrastructure and fuel availability. That gap is what owners are being forced to manage.”
This gap is particularly acute for STS operators. The OCIMF/ICS/CDI/SIGTTO STS Transfer Guide 2nd Edition, published in 2025, introduced stricter training and documentation requirements across oil, LNG, LPG, and chemical operations simultaneously. For smaller independent STS providers across Southeast Asia and West Africa, absorbing compliance overhead across four cargo categories at once stretches both capital and crew certification timelines beyond what spot-market pricing can recover.
On the alternative fuel side, the readiness gap is structural rather than transitional. The development of technical standards and application specifications for clean alternative marine fuels continues to lag behind technological advancements. For STS operators, this means that LNG transfer protocols are maturing while ammonia and methanol STS standards remain in pilot-stage development — creating a two-tier market where established LNG STS operators hold a durable advantage over entrants attempting to position for green fuel transfers without a certified operational track record.
The result is a consolidation dynamic: large certified STS providers with multi-corridor coverage and multi-cargo capability are absorbing compliance costs at scale, while mid-tier operators face margin compression from rising insurance premiums, equipment certification cycles, and crew retraining requirements that they cannot pass through to charterers in a competitive spot market.
Ship to Ship Transfer Service Market Emerging Trends
OCIMF 2025 STS Guide Sets Global Safety Benchmark
Global standardization of STS safety governance accelerates as OCIMF, ICS, CDI, and SIGTTO jointly published the 2nd Edition STS Transfer Guide in 2025 — the first major update in over a decade — covering oil, chemical, LPG, and LNG cargoes for worldwide application, per OCIMF. This consolidation reduces operator training fragmentation across cargo types. Operators aligned to the 2025 edition gain a charterer-preference advantage as compliance verification becomes a standard pre-contract requirement.
STS Audit Standardization Takes Hold Globally
Worldwide shift toward independent STS audit platforms takes hold as Dynamarine and James Fisher Fendercare formed a global partnership in June 2025 to standardize STS audit criteria across international operators, per James Fisher and Sons. This partnership applies consistent audit methodology to vessel suitability, mooring master qualifications, and transfer equipment condition assessments. For investors, standardized audit infrastructure increases transparency and reduces due-diligence costs for STS service acquisitions and charter negotiations.
EU ETS Ship-to-Ship Impact and Dark Fleet Evasion
Shadow fleet tanker M/V TRUST changed MMSI six times before reflagging to Russia in December 2025, reshaping global STS monitoring practices, per the IMO Current Awareness Bulletin. In February 2026, MOL completed Japan’s first ship-to-ship methanol bunkering at Yokohama per MOL, signaling STS operations will diversify beyond LNG. Operators with both AIS-monitoring integration and multi-fuel STS transfer capacity are emerging as the dominant service tier.
Ship to Ship Transfer Service Market Growth Factors
52 FSRUs Operational in 2025, 18 More Under Build
Global FSRU fleet expansion creates recurring STS transfer opportunities as the worldwide FSRU fleet reached 52 active units in 2025 with 18 additional units under construction, per GIIGNL. Synergy Marine Group and Karpowership completed conversion of a 125,000 m³ LNG carrier into the Karadeniz LNGT Powership Americas FSRU, providing regasification capacity up to 150 mmscfd, in September 2025 per Marine Link. Each FSRU commissioned creates a permanent, recurring STS transfer point that fixed terminal infrastructure cannot replace.
LBV Fleet to Deliver Over 19M Tonnes LNG by 2029
Global LNG bunker vessel capacity buildout opens cross-regional STS service markets as nearly 20 additional LNG bunker vessels were ordered at shipyards in 2025, with the worldwide LBV fleet projected to deliver more than 19 million tonnes of LNG by 2029 — up from approximately 6.5 million tonnes in 2025 per SEA-LNG. LNG-fuelled vessel growth has averaged 20–40% per annum since 2010 per SEA-LNG, compounding the addressable bunker STS market annually. LBV operators building multi-port STS coverage now will lock in service agreements before delivery peaks tighten spot capacity.
India and Poland Open New STS LNG Import Corridors
Global emerging-market LNG import infrastructure unlocks new STS transfer corridors as Adani Ports and BPCL launched India’s first STS LNG bunkering at Vizhinjam in October 2025 per PortNews, while GAZ-SYSTEM advanced a 6.1 bcm/year FSRU project in Poland’s Gulf of Gdańsk. Both projects create greenfield STS transfer demand in markets previously dependent on fixed terminal infrastructure. Critically, early-mover operators establishing STS service contracts at both terminals will be difficult to displace once cargo volumes and operator relationships are entrenched.
Offshore Crude STS Expands in West Africa and Brazil
Global offshore crude STS service expansion captures rising seaborne flows as Fendercare Marine supports large-scale crude STS operations off Malaysia and West Africa for Petrobras and Shell, and AET Tankers expands STS operations in the US Gulf of Mexico and Brazilian offshore zones — both confirmed in 2024 operator disclosures. West Africa and Brazil represent the two fastest-growing offshore crude STS corridors outside the Middle East. Service providers with certified offshore crude STS capacity in these regions are positioned to capture rising incremental barrel flows through 2030.
Ship to Ship Transfer Service Market Regional Analysis
Asia Pacific Holds 49.9% Share at USD 0.6B
Asia Pacific leads the ship to ship transfer service market with a 49.9% share valued at USD 0.6 billion in 2025, anchored by the region’s role as the world’s largest LNG import zone. Asia’s share of global LNG bunkering grew from 45% in 2024 to 47% in Q1–Q3 2025, with China accounting for nearly a quarter of global LNG bunker volumes in 2025, per Lloyd’s List. Singapore’s full-year 2025 LNG bunker sales rose 23.9% to a record per Lloyd’s List, deepening STS bunker concentration in this corridor.
North America STS Transfer Market Analysis and Trends
North America STS transfer market activity centers on the US Gulf of Mexico, the world’s most established offshore crude lightering corridor. AET Tankers completed 16,000 cumulative STS transfers in the US Gulf as of its 2024–2025 Annual Review, per AET Tankers. US Gulf Coast lightering infrastructure — built around Galveston Offshore Lightering Area and Louisiana Offshore Oil Port approaches — supports VLCC discharge operations that cannot reach shallow draft terminals.
Europe Ship to Ship Transfer Market Analysis and Trends
Europe ship to ship transfer market demand accelerated sharply in 2025 as the continent replaced pipeline gas with imported LNG at record pace. EU LNG imports rose 30% year-on-year in 2025, with the US share of European LNG imports rising to 77.53% from 57.64% in 2024, per S&P Global. Poland’s GAZ-SYSTEM is advancing a Gulf of Gdańsk FSRU with 6.1 bcm/year capacity, fully booked by Orlen for 2028 operations, per LNG Prime.
Middle East STS Transfer Market Analysis and Trends
The Middle East STS transfer market is expanding rapidly as regional producers scale LNG export and tanker fleet capacity. Qatar is set to add up to 80 new LNG carrier builds over four years, while ADNOC is doubling its LNG vessel fleet to 18 units within 36 months, per Baird Maritime — together anchoring sustained STS service demand across the Fujairah STS transfer zone and Gulf of Oman.
Latin America STS Transfer Market Analysis and Trends
Latin America is building FSRU-dependent STS infrastructure at pace, driven by Brazil’s LNG import buildout. Latin America added three new FSRU terminals in Brazil in 2024 totaling 1.74 billion ft³/d of regasification capacity, with the Suape terminal adding 0.7 Bcf/d of additional capacity scheduled for early 2026, per the U.S. EIA, opening a new STS-dependent receiving corridor in northeast Brazil.
Malaysia STS Transfer Market Analysis and Trends
Malaysia’s STS market is anchored by the Strait of Malacca corridor, one of the world’s highest-density tanker transit routes. KA Petra Energy has positioned itself specifically around LNG and clean fuel STS operations across Malaysian waters and the broader Southeast Asian corridor, targeting the segment of the market where cryogenic transfer protocols differentiate service providers from commodity crude operators. Petronas’s ongoing offshore production expansion in the South China Sea sustains consistent demand for offshore crude STS as a port-independent logistics solution for fields too distant from shallow-draft terminals.
Singapore STS Transfer Market Analysis and Trends
Singapore remains the most concentrated single-location LNG bunkering market globally. The port’s full-year 2025 LNG bunker sales rose 23.9% to a record high per Lloyd’s List, with the STL Marine Services-operated offshore STS hub handling thousands of crude and product transfers annually. Singapore’s dominance reflects its position at the intersection of the Asia-Pacific LNG import corridor and the major tanker route connecting the Middle East to Northeast Asian buyers — making it the de facto benchmark for STS service pricing and operational standards across the region.
Brazil STS Transfer Market Analysis and Trends
Brazil’s STS market is expanding on two separate demand tracks. AET Tankers completed more than 750 lightering operations off Uruguay and Brazil, building a cumulative data and process advantage in South Atlantic crude STS that new entrants cannot replicate quickly. Separately, Brazil’s FSRU buildout added three new terminals in 2024 with a combined regasification capacity of 1.74 billion ft³/d per U.S. EIA, with the Suape terminal adding a further 0.7 Bcf/d in early 2026 — each terminal creating a recurring Ship-to-Shore STS demand point in a market previously dependent on fixed infrastructure.
Qatar STS Transfer Market Analysis and Trends
Qatar’s STS market is entering a sustained expansion phase tied directly to LNG fleet growth. Qatar is adding up to 80 new LNG carrier builds over four years per Baird Maritime, creating both direct STS bunkering demand as new carriers enter service and indirect demand as expanded LNG export volumes increase transshipment activity across the Fujairah STS transfer zone and the Gulf of Oman. ADNOC is simultaneously doubling its LNG vessel fleet to 18 units within 36 months, reinforcing the Middle East as the fastest-growing LNG STS corridor outside Asia Pacific.
Key Regions and Countries
North America
- US
- Canada
Europe
- Germany
- France
- The UK
- Spain
- Italy
- Rest of Europe
Asia Pacific
- China
- Japan
- South Korea
- India
- Australia
- Rest of APAC
Latin America
- Brazil
- Mexico
- Rest of Latin America
Middle East & Africa
- GCC
- South Africa
- Rest of MEA
Key Ship to Ship Transfer Service Market Company Insights
Excelerate Energy leads the LNG-focused STS transfer segment with a cumulative record of more than 3,800 ship-to-ship transfers of LNG with over 50 operators since inception, per Excelerate Energy’s FY2025 10-K. Its FSRU-centric model converts each new terminal contract into a recurring STS revenue stream, driving FY2025 revenues of USD 1,228.3 million from USD 851.4 million in FY2024, per Yahoo Finance. Our forecast suggests this revenue trajectory will accelerate as 18 additional FSRUs under construction reach commissioning between 2026 and 2029.
Hapag-Lloyd anchors STS LNG bunker demand from the carrier side, with Fendercare Marine STS operations and competing providers needing to align with its deployment schedule. The company operated 13 high-pressure LNG dual-fuel vessels as of December 31, 2025, as transport volume grew 8% to 13.5 million TEU in 2025, per Hapag-Lloyd’s FY2025 Annual Report. Its USD 4 billion green financing package secured in February 2025 funds 24 LNG dual-fuel newbuild boxships per Hapag-Lloyd, locking in STS LNG bunker demand through the early 2030s.
AET Tankers holds the deepest record in offshore crude STS services, having completed more than 16,000 STS transfers in the US Gulf of Mexico and more than 750 lightering operations off Uruguay and Brazil, per AET Tankers’ 2024–2025 Annual Review. This cumulative transfer volume creates a data and process advantage that competitors entering the US Gulf lightering market cannot replicate quickly. SPT Marine Services and other specialist providers must differentiate on equipment condition and response time rather than volume credentials to compete effectively against AET in established corridors.
James Fisher and Sons plc (Fendercare Marine) reported Maritime Transport revenue of £150.1 million in FY2025, with Tankships achieving 89% fleet utilization across STS-adjacent services — despite a 4.5% revenue decline from the prior year — per James Fisher and Sons FY2025 Results. Its June 2025 global audit partnership with Dynamarine positions Fendercare to define industry audit standards rather than merely comply with them. For operators benchmarking STS service procurement, Fendercare’s audit-setter role means its pricing and contract terms will increasingly function as the market reference point.
Top Key Players in the Market
- MariFlex
- Fendercare Marine (James Fisher and Sons plc)
- Pro Liquid
- Fairtex Integrated Services
- SafeSTS
- KA Petra
- EXMAR
- Rochem
- Gulf Offshore NS
- GAC Group
- West African Fenders
- Reference Marine International
- Seamaster Maritime
- Amathus Aegeas
- Graypen
- AET Tankers
- NYK Line
- Maersk
- Hapag-Lloyd
- STL Group
- SPT Marine Services
- Wilhelmsen Ship Management
- Vopak
- SMIT Lamnalco
- Knutsen OAS Shipping
- Tschudi Group
- Kanoo Terminal Services
- Lianyungang Xinyihai
- Excelerate Energy
- Teekay Tankers
- TORM PLC
- Mitsui O.S.K. Lines (MOL)
Recent Developments
- February 2026 — MOL completed Japan’s first ship-to-ship methanol bunkering operation at a Yokohama anchorage, executed through a five-way public-private partnership to advance alternative marine fuel adoption.
- February 2026 — Maersk ordered 8 LNG dual-fuel 18,600 TEU container ships from New Times Shipbuilding, with first deliveries scheduled for 2028, reinforcing STS LNG bunker pipeline demand.
- February 2026 — MSC ordered 8 × 11,500 TEU LNG dual-fuel containerships from Jinglu Shipyard at approximately USD 140 million per vessel (~USD 1.12 billion total), with deliveries from 2029.
- February 2026 — CMA CGM confirmed a 6-vessel LNG dual-fuel order with India’s Cochin Shipyard valued at ₹17 billion (USD 187 million), the first major international LNG-fuelled order at an Indian yard.
- November 2025 — James Fisher Fendercare published a technical whitepaper on STS solutions for the physical movement of green ammonia, positioning the firm at the forefront of emerging alternative-cargo STS transfer infrastructure.
- June 2025 — Dynamarine and James Fisher Fendercare formed a global partnership to standardize STS audit criteria across international operators, establishing a unified audit framework for vessel suitability and mooring master qualifications.
Report Scope
| Report Features | Description |
|---|---|
| Market Value (2025) | USD 1.5 Billion |
| Forecast Revenue (2034) | USD 2.5 Billion |
| CAGR (2025-2034) | 5.9% |
| Base Year for Estimation | 2024 |
| Historic Period | 2020-2023 |
| Forecast Period | 2025-2034 |
| Report Coverage | Revenue Forecast, Market Dynamics, Competitive Landscape, Recent Developments |
| Segments Covered | By Type (Stationary, Sailing), By Ship Type (Commercial, Defense), By Fit (Line Fit, Retrofit), By Connectivity (Ship-to-Shore, Ship-to-Ship), By Application (Crude Oil, LPG, Bulk Cargo, Others) |
| Regional Analysis | North America (US and Canada), Europe (Germany, France, The UK, Spain, Italy, and Rest of Europe), Asia Pacific (China, Japan, South Korea, India, Australia, and Rest of APAC), Latin America (Brazil, Mexico, and Rest of Latin America), Middle East & Africa (GCC, South Africa, and Rest of MEA) |
| Competitive Landscape | ABL Group, MariFlex, Fendercare Marine, Pro Liquid, Fairtex Integrated Services, SafeSTS, KA Petra, EXMAR, Rochem, Gulf Offshore NS |
| Customization Scope | Customization for segments, region/country-level will be provided. Moreover, additional customization can be done based on the requirements. |
| Purchase Options | We have three licenses to opt for: Single User License, Multi-User License (Up to 5 Users), Corporate Use License (Unlimited Users and Printable PDF) |
Frequently Asked Questions (FAQ)
The ship to ship transfer service market was valued at USD 1.4 billion in 2025 and will reach USD 2.5 billion by 2035, growing at a CAGR of 5.9%. LNG fleet expansion and offshore crude lightering demand are the primary growth anchors.
Stationary STS leads the By Type segment with a 57.2% share in 2025, driven by superior operational control for high-value cargo transfers. Crude oil leads By Application at 51.4%, anchored by structural VLCC draft constraints at terminal approaches.
Asia Pacific leads with a 49.9% share valued at USD 0.6 billion in 2025, driven by the region's FSRU import buildout and the world's fastest-growing LNG bunkering corridors across Singapore, China, and Indonesia.
Key drivers include 100 new LNG carrier deliveries scheduled in 2026 (up 27% from 79 in 2025) and global LNG bunkering demand hitting 3.8 million tonnes in 2025, a 46% year-on-year increase per Ship & Bunker.
Major players include Fendercare Marine, AET Tankers, SPT Marine Services, Excelerate Energy, and Teekay Tankers. These firms lead across LNG STS bunkering, offshore crude lightering, and FSRU-linked transfer operations across global corridors.


