Report Overview
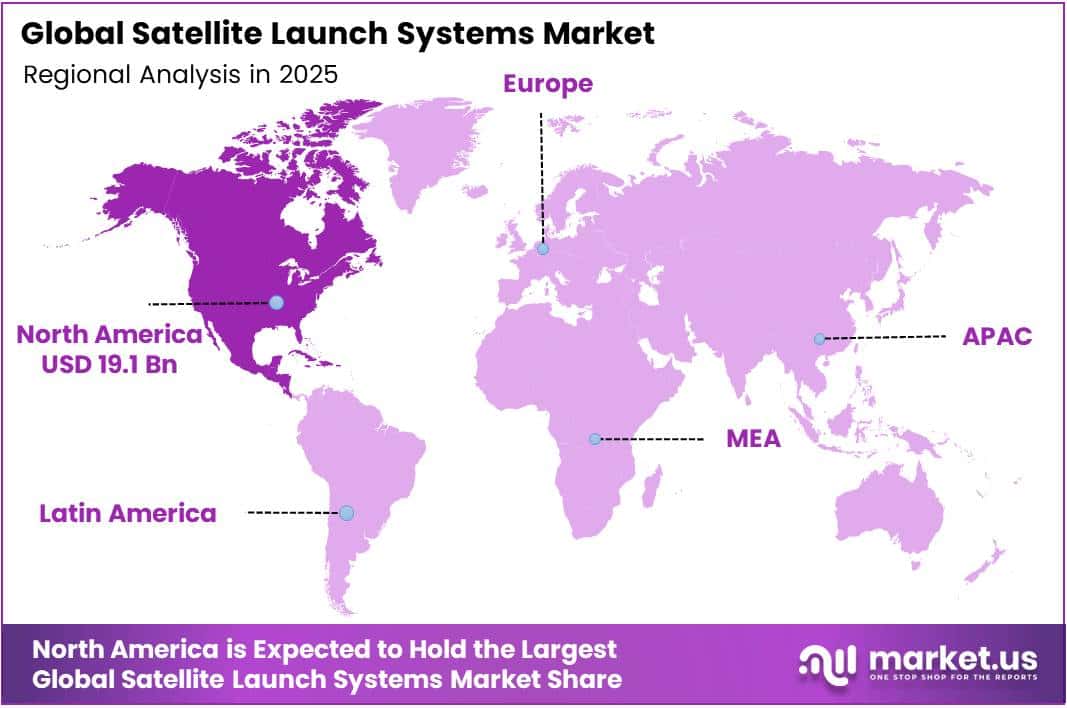
In 2025, the Global Satellite Launch Systems Market was valued at USD 30.6 billion. The market is projected to grow at a CAGR of 16.3% during 2026–2035, reaching approximately USD 137.3 billion by 2035. North America dominated the global market in 2025, accounting for more than 62.3% of the total market share and generating approximately USD 19.1 billion in revenue.
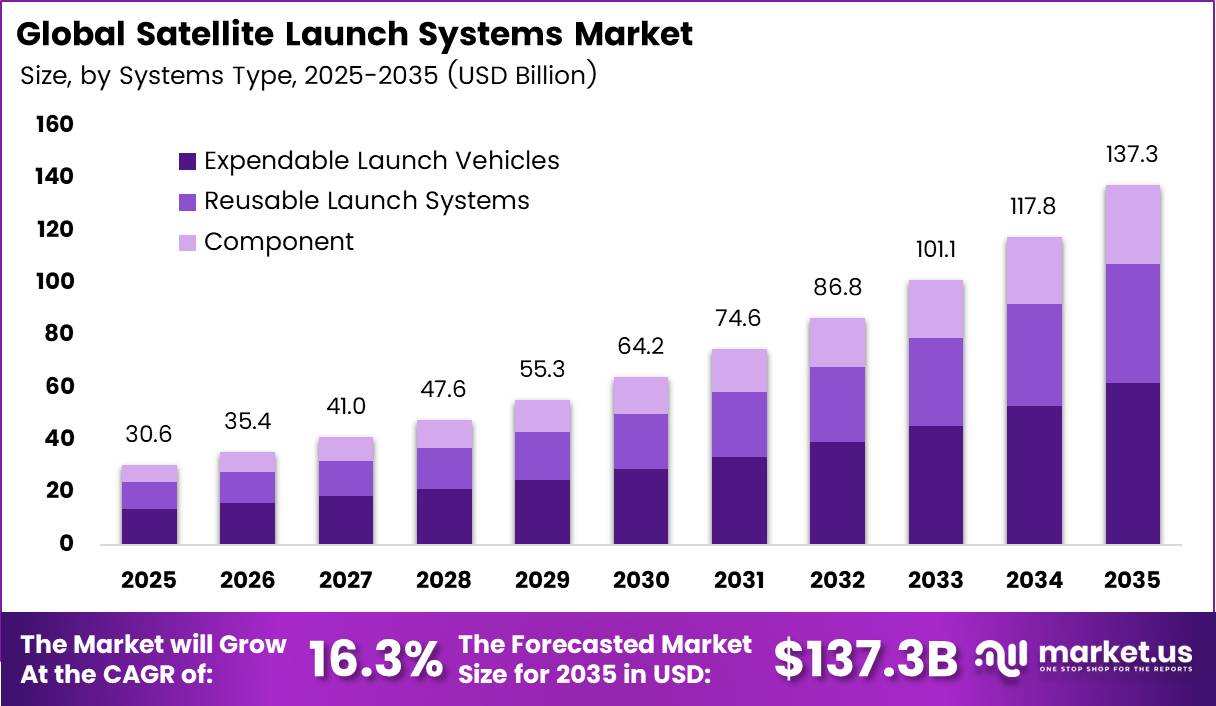
Strong demand from satellite operators drives this growth. The Space Foundation reported that the global space economy reached USD 613 billion in 2024, up 7.8% from the year before. It then climbed to USD 686 billion in 2025. The commercial sector made up 78% of that economy.
Launch activity is rising just as fast. In the first half of 2025, the world saw 149 launches. That works out to one liftoff to orbit every 28 hours, which is 6 hours faster than the 2024 record pace. Every new broadband constellation, Earth imaging fleet, and defense network needs rockets, so each one adds direct demand for launch vehicles, avionics, and guidance systems.
Key Takeaways
- The Satellite Launch Systems Market will grow from USD 30.6 billion in 2025 to USD 137.3 billion by 2035. grow at a CAGR of 16.3% from 2026 to 2035.
- Expendable Launch Vehicles lead the Systems Type segment with a 74.3% share.
- Small Satellite Launch Vehicles lead the Payload Capacity segment with a 42.8% share.
- Low Earth Orbit (LEO) leads the Orbit segment with a 38.7% share.
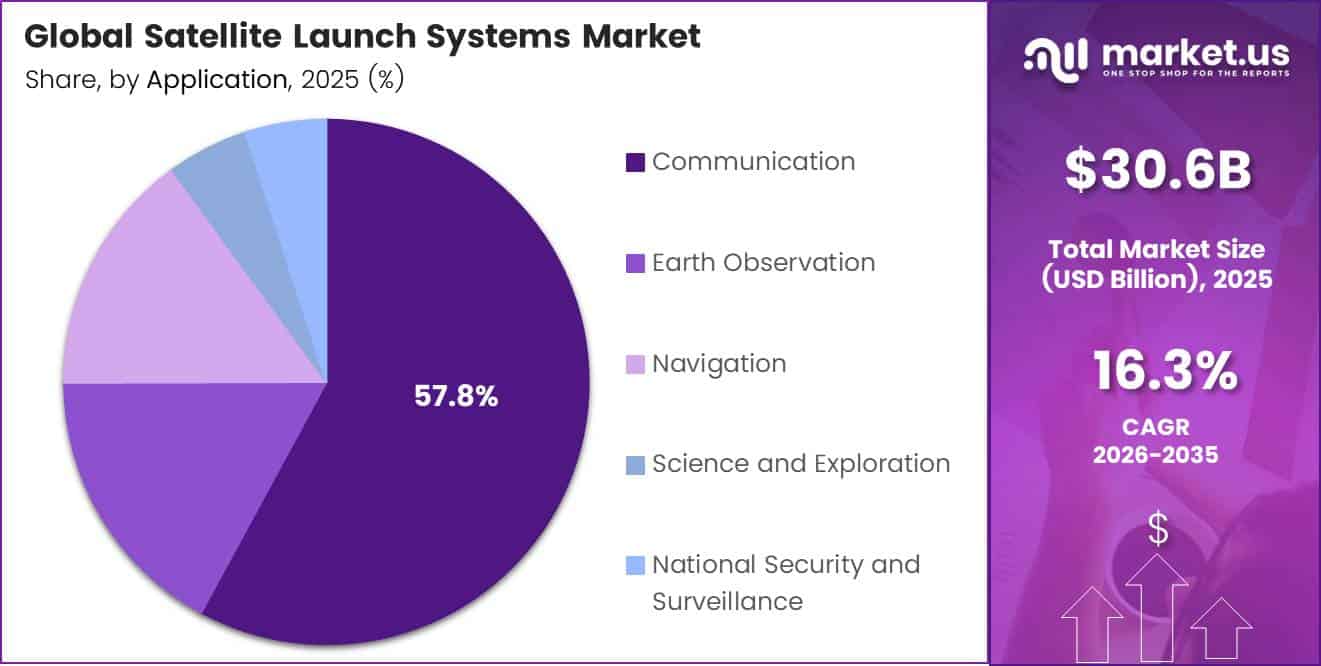
- Communication leads the Application segment with a 57.8% share.
- Government and Civil users lead the End User segment with a 42.8% share.
- North America leads with a 62.3% share and USD 19.1 billion in revenue.
By Systems Type
Expendable Launch Vehicles dominate with 74.3% due to proven flight heritage and lower upfront costs.
Expendable Launch Vehicles hold the largest share because most government and commercial buyers still trust rockets with long flight records. In FY2025, the FAA licensed 195 launches, and 163 of them took place at just four main sites. This shows that launch activity stays focused on a few proven rockets and pads, which favors well-known expendable designs. Buyers also value fixed pricing and simple mission planning.
Component demand is growing fastest as launch rates climb and every new rocket needs guidance and control systems, avionics, and structures. The Satellite Industry Association reports that worldwide commercial launch revenue rose to $12.4 billion in 2025, up 33% from 2024. Higher revenue gives rocket builders the cash to buy more flight computers, sensors, and lightweight frames.
By Payload Capacity
Small Satellite Launch Vehicles dominate with 42.8% due to high demand for dedicated constellation deployment.
Small Satellite Launch Vehicles lead because many operators now build small, low-cost satellites that need flexible rides to orbit. Startups, universities, and Earth-imaging firms prefer dedicated small rockets since they can pick their own launch date and exact orbit, instead of waiting for space on a larger mission. This control matters for firms racing to start services and earn revenue quickly.
Medium-to-Heavy Lift Vehicles are growing fastest because large constellation builders want to place dozens of satellites in a single flight. According to the Satellite Industry Association, 296 launches placed a record 4,434 satellites into Earth orbit in 2025, a 65% increase over 2024. That works out to roughly 15 satellites per launch, which points to heavier, shared missions.
Satellite manufacturing revenue also reached $20.4 billion in 2025, so builders keep producing spacecraft in large batches and keep orders steady. Bigger rockets cut the cost per satellite, and that saving pushes operators toward medium and heavy lift options for full constellation rollouts. Launch firms that offer both rideshare seats and full-rocket bookings can serve both buyer groups.
By Orbit
Low Earth Orbit (LEO) dominates with 38.7% due to low latency and lower launch costs.
Low Earth Orbit (LEO) holds the largest share because satellites at this height send data with very little delay and cost less to reach. Broadband, imaging, and science missions all gain from being close to Earth. Rockets also need less fuel to reach LEO, so operators can fly more often and replace older satellites faster. This makes LEO the default choice for new commercial projects.
LEO is also the fastest-growing orbit, driven by mega-constellations. UNOOSA data shows that 4,510 objects went into space in 2025, and the United States alone launched 3,708 of them, mostly LEO broadband satellites. The total number of objects launched since 1957 reached 24,865, which means a large share of all space activity in history has happened in recent years.
By Application
Communication dominates with 57.8% due to rising global demand for satellite broadband.
Communication leads the application segment because satellites now deliver internet, mobile backhaul, TV, and data links to homes, ships, aircraft, and remote areas. Telecom operators need large fleets to cover the whole planet, so they book more launches than any other user group. Coverage gaps in poorer regions add more pressure. Earth Observation, Navigation, and Science missions need far fewer satellites per program.
Communication is also the fastest-growing application. The Satellite Industry Association reports that global satellite broadband subscribers rose 62% over 2024, while broadband revenue grew 17%. Rural households and small businesses in areas without fiber are among the fastest new adopters. This rapid user growth pushes operators to add capacity, which means more satellites and more launches each year.
The wider space economy reached $429 billion in 2025, and the commercial satellite industry made up 71% of it. Since most of that commercial business comes from communication services, launch providers see telecom firms as their most reliable buyers. Direct-to-phone links and in-flight connectivity add new demand on top of home broadband, keeping order books full.
By End User
Government and Civil dominate with 42.8% due to steady public funding for national missions.
Government and Civil users hold the largest share because space agencies fund science, weather, navigation, and crewed missions with long-term public budgets. These programs often run for many years and require high-reliability rockets, which gives launch firms stable anchor contracts. Public agencies also pay for new launch sites and safety systems that later help private users.
Commercial users form the fastest-growing group. The US Department of Transportation reports that the United States carried out 217 of the 329 commercial launches worldwide in 2025. The FAA also plans for about 1,000 launches a year by 2030 and has proposed new rules to speed up licensing. Faster approvals mean shorter wait times for paying customers.
FAA records show 603 of its 982 licensed launches and reentries since 1989 happened in just the past five years, about 61.0% of all activity. This sharp rise shows how quickly private firms are moving from test flights to regular service. Defense users also buy launches for secure communication and tracking satellites, but commercial demand is rising much faster as private capital and lower launch prices open space to more businesses.
Key Market Segments
By Systems Type
- Expendable Launch Vehicles
- Reusable Launch Systems
- Component
- Guidance and Control System
- Avionics
- Structure
- Others
By Payload Capacity
- Small Satellite Launch Vehicles
- Medium-to-Heavy Lift Vehicles
- Super-Heavy Lift Vehicles
By Orbit
- Low Earth Orbit (LEO)
- Medium Earth Orbit (MEO)
- Geostationary Orbit (GEO)
By Application
- Communication
- Earth Observation
- Navigation
- Science and Exploration
- National Security and Surveillance
By End User
- Government and Civil
- Commercial
- Defense
Geopolitical Impact Analysis
Trade tensions now drive up the cost of building rockets. In June 2025, the United States raised Section 232 tariffs on steel and aluminum imports to 50%, up from 25%. Aluminum-lithium alloys, stainless steel tanks, and engine casings make up a large share of launch vehicle structure costs. Suppliers that import plate and forgings now pay more per stage.
Shipping disruptions slow down how parts reach launch sites. UNCTAD reported that Red Sea attacks pushed Suez Canal transits down by more than 50% in early 2024. Ships rerouted around the Cape of Good Hope, adding about 10 to 14 days to Asia-to-Europe voyages. European launch programs that rely on Asian electronics and composite fibers face longer lead times and higher freight bills.
Export controls are splitting the market into separate blocs. Since 2022, Western sanctions have locked Russian Soyuz rockets out of most commercial deals. This pushed Western satellite operators toward US and European launchers. The shift tightens available launch slots and gives US providers stronger pricing power. ITAR rules also stop many US-built satellites from flying on Chinese or Indian rockets.
Energy and critical mineral prices add more cost pressure. The IEA warns that a handful of countries control most refining capacity for critical minerals. China refines most of the world’s gallium and germanium, and it placed export curbs on both in 2023. These elements go into the solar cells and chips used in avionics and guidance systems, so the curbs raise sourcing risk for every launch program.
Regional Analysis
North America dominates the Satellite Launch Systems Market, holding a 62.3% share and generating USD 19.1 billion in revenue. The US runs the busiest launch economy in the world. SpaceX flew about 165 orbital missions in 2025, or roughly 50.8% of the 325 orbital launches worldwide. Reusable Falcon 9 boosters keep cutting the cost per flight.
This lets operators deploy large LEO constellations at a pace no other region matches. Rocket Lab adds depth in the small launch class. It flew 21 Electron and HASTE missions in 2025 with a 100% success rate. Federal spending gives the region a stable base. NASA’s budget sits near USD 25 billion a year, and the Department of Defense funds a growing pipeline of national security launches.
Asia Pacific is the fastest-growing region in the Satellite Launch Systems Market. China flew close to 90 orbital launches in 2025 and keeps building out its Guowang and Qianfan megaconstellations, each planned at more than 10,000 satellites. India’s space agency, ISRO, runs on a yearly budget of about USD 1.5 billion, and the country now allows private launch firms such as Skyroot.
Europe holds a strong position through Arianespace and Airbus. Ariane 6 returned Europe to independent heavy launch in 2024. ESA members approved record funding at recent ministerial councils, with budgets above EUR 20 billion. Germany, France, and the UK back small launcher startups such as Isar Aerospace and Rocket Factory Augsburg. Europe also funds the IRIS2 constellation, which will need many launches over the next decade.
Key Regions and Countries
North America
- US
- Canada
Europe
- Germany
- France
- The UK
- Spain
- Italy
- Rest of Europe
Asia Pacific
- China
- Japan
- South Korea
- India
- Australia
- Rest of APAC
Latin America
- Brazil
- Mexico
- Rest of Latin America
Middle East and Africa
- GCC
- South Africa
- Rest of MEA
Market Dynamics
Drivers
| Driver | (~) % Impact on CAGR Forecast | Geographic Relevance | Impact Timeline |
|---|---|---|---|
| LEO Mega-Constellation Deployment Cadence | +2.8% | Global, led by North America and China | Short term (2 years or less) |
| Reusable First-Stage Cost Compression | +2.1% | North America, Europe, China | Medium term (2 to 4 years) |
| Defense Space Architecture Procurement | +1.6% | North America, Europe, Asia Pacific | Short term (2 years or less) |
| Sovereign Launch Capability Programs | +1.2% | India, Japan, Europe, Middle East | Medium term (2 to 4 years) |
| Rideshare & Small-Launcher Demand | +0.9% | Global | Short term (2 years or less) |
| Earth Observation Data Commercialization | +0.7% | Global | Medium term (2 to 4 years) |
LEO Mega-Constellation Deployment Cadence
The root cause is the move from single geostationary satellites to replenishable low-Earth-orbit constellations. FAA Office of Commercial Space Transportation licensing records show U.S. commercial launch operations went past 140 in 2024, and SpaceX operational disclosures put Falcon 9 cadence at more than 130 missions that year. Most of those flights carried Starlink batches of roughly 20 to 24 satellites each.
The quantitative mechanism is the replenishment cycle. ITU filing databases list constellation proposals totaling more than 1,000,000 satellites, and the FCC’s post-mission disposal rule, adopted in 2022 and in force from 2024, limits deorbit timelines to 5 years. Combined with design lives of about 5 to 7 years, that creates steady, annuity-like launch demand.
This changes the business model. Launch is moving from per-mission bespoke contracting to vertically integrated, capacity-reserved manifests. Constellation owners lock in multi-year block buys covering 50+ launches, while Amazon’s Project Kuiper procurement disclosures show more than 80 heavy-lift launches booked across several providers.
Restraints
| Restraint | (~) % Impact on CAGR Forecast | Geographic Relevance | Impact Timeline |
|---|---|---|---|
| Export Control & ITAR Restrictions | -1.4% | North America, China, Russia | Long term (4 years or more) |
| Venture Capital Tightening for Launch Startups | -1.1% | North America, Europe | Short term (2 years or less) |
| Launch Failure & Insurance Premium Spikes | -0.7% | Global | Short term (2 years or less) |
| Sanctions-Driven Russian Market Exclusion | -0.5% | Europe, Russia, CIS | Medium term (2 to 4 years) |
| Range & Licensing Approval Backlogs | -0.4% | North America, Europe | Short term (2 years or less) |
Export Control & ITAR Restrictions
The root cause is that launch vehicles are dual-use technology: they share propulsion, guidance, and staging architecture with ballistic missiles. Under the U.S. Department of State’s International Traffic in Arms Regulations and the 35-member Missile Technology Control Regime, Category I systems, which cover rockets able to carry 500 kg over 300 km, face a strong presumption of export denial.
The quantitative bottleneck is the payload market that cannot move across borders. U.S. Department of Commerce Bureau of Industry and Security licensing data show export authorizations for space hardware often take 60 to 120 days, and satellites containing U.S.-origin components are effectively barred from Chinese launchers.
Strategically, providers cannot pool demand across blocs, so vehicle utilization falls and fixed-cost absorption suffers. Non-U.S. launchers can lose an estimated 15% to 20% of their addressable commercial payloads. Duplicate compliance teams and ITAR-free component redesigns also lift program costs by roughly 5% to 8%, which delays CapEx for emerging providers.
Challenges
| Challenge | (~) % CAGR Friction Drag | Geographic Relevance | Mitigation Horizon |
|---|---|---|---|
| Propulsion Supply Chain Constraints | -1.2% | North America, Europe | Medium term (2 to 4 years) |
| Orbital Debris Congestion Risk | -0.8% | Global | Long term (4 years or more) |
| Aerospace Engineering Talent Shortage | -0.7% | North America, Europe, India | Long term (4 years or more) |
| Heavy-Lift Vehicle Maturation Delays | -0.6% | North America, Europe, Japan | Medium term (2 to 4 years) |
| Spectrum Coordination Complexity | -0.4% | Global | Medium term (2 to 4 years) |
Propulsion Supply Chain Constraints
The structural weakness is concentration. Solid rocket motors, specialty alloys, and rad-hard avionics each come from a small number of suppliers. U.S. Government Accountability Office reviews found that solid rocket motor production consolidated into essentially 2 domestic sources, and Department of Defense industrial base assessments flagged single points of failure across more than 10 propulsion sub-tiers.
The quantitative friction appears as longer lead times. Aerospace Industries Association supply-chain surveys show castings, forgings, and electronic components arriving after 40 to 60 weeks, against 20 to 26 weeks before 2020. European Space Agency Ariane 6 program updates also show solid booster sourcing pacing early cadence ramp-up to fewer than 10 flights a year.
Over the long term, providers will have to vertically integrate engine and avionics production, a path visible in SpaceX and Rocket Lab investor disclosures. They will also need to carry higher safety stock, which raises working-capital needs by an estimated 10% to 15%. Dual-sourcing qualification programs add a further 12 to 18 months before cost relief arrives.
Opportunities
| Opportunity | (~) % Potential CAGR Upside | Geographic Relevance | Execution Window |
|---|---|---|---|
| Fully Reusable Super-Heavy Launch Economics | +1.9% | North America, China | Long term (4 years or more) |
| In-Space Servicing & Orbital Transfer Vehicles | +1.2% | North America, Europe, Japan | Medium term (2 to 4 years) |
| Launch-as-a-Service Bundled Offerings | +0.8% | Global | Medium term (2 to 4 years) |
| Emerging Spaceport Infrastructure | +0.7% | Middle East, Australia, Nordics, Africa | Long term (4 years or more) |
| Lunar & Cislunar Cargo Delivery | +0.6% | North America, Europe, India | Long term (4 years or more) |
Fully Reusable Super-Heavy Launch Economics
This is still white space, not a current driver. Today’s reuse covers only first stages, while fully reusable super-heavy systems remain in flight-test campaigns. FAA licensing records for Starship show several integrated test flights since 2023, but no routine commercial payload service yet. Blue Origin’s New Glenn and China Academy of Launch Vehicle Technology reusable programs are also in early operational or test phases.
The unit-economic shift would be dramatic. NASA cost-benchmarking studies put Falcon 9 cost-to-orbit near $2,700 per kg, and SpaceX executive statements target well below $200 per kg for fully reused vehicles at 100+ tonnes of payload. That would be a reduction of more than 90%, opening great untapped demand in space manufacturing, large-aperture observation, and orbital data centers.
Margins could widen as refurbishment replaces expendable hardware. Upper-stage recovery could lift gross margins by an estimated 15 to 25 percentage points, while marginal cost per flight falls toward propellant and operations, which run about $2 million to $10 million per sortie according to U.S. Space Force launch-cost assessments.
Key Players Analysis
Tier 1 leaders include SpaceX, Boeing, Lockheed Martin, Northrop Grumman, and Airbus. SpaceX sets the pace on volume with more than 330 launches in 2025. Boeing and Lockheed Martin run United Launch Alliance through a 50/50 joint venture. Northrop Grumman supplies solid rocket motors and runs the Minotaur and Antares lines. Airbus is the prime contractor for Ariane 6 through its ArianeGroup joint venture with Safran.
Rocket Lab leads the Tier 2 group on growth. It posted record revenue of USD 602 million in 2025, up 38% from USD 436 million in 2024. Its backlog rose 73% to USD 1.85 billion. In Q2 2026, revenue hit USD 234 million, up 62% from the prior year, and the backlog grew to USD 2.36 billion.
Rocket Lab uses deals to build a full space business. It closed its purchase of Geost for USD 275 million in August 2025, with a possible earnout of up to USD 50 million. It also agreed to buy Mynaric for an initial USD 75 million. Mynaric already supplies optical terminals for Rocket Lab’s USD 515 million SDA satellite contract.
Other Tier 2 players hold strong regional positions. Arianespace serves European institutional customers. Mitsubishi Heavy Industries runs Japan’s H3 program. ISRO flies PSLV and LVM3 rockets at low cost. Blue Origin joined the heavy lift class with New Glenn, which first flew in January 2025.
Top Key Players in the Market
- Airbus S.A.S
- Arianespace
- The Boeing Company
- Rocket Lab
- Mitsubishi Heavy Industries, Ltd.
- Northrop Grumman
- Lockheed Martin Corporation
- Blue Origin Enterprises, L.P.
- SpaceX
- ISRO
Recent Developments
- In March 2025, Rocket Lab signed a term sheet to buy Mynaric for an initial USD 75 million. Rocket Lab won a spot for its Neutron rocket on the Department of Defense’s USD 5.6 billion NSSL Phase 3 Lane 1 program.
- In August 2025, Rocket Lab closed its USD 275 million purchase of Geost, which included about USD 125 million in cash and 3,057,588 shares. Rocket Lab reported record 2025 revenue of USD 602 million and 21 missions with a 100% success rate.
Report Scope
| Report Features | Description |
|---|---|
| Market Value (2025) | USD 30.6 billion |
| Forecast Revenue (2035) | USD 137.3 billion |
| CAGR (2026-2035) | 16.3% |
| Base Year for Estimation | 2025 |
| Historic Period | 2020-2024 |
| Forecast Period | 2026-2035 |
| Report Coverage | Revenue Forecast, Market Dynamics, Competitive Landscape, Recent Developments |
| Segments Covered | By Systems Type (Expendable Launch Vehicles, Reusable Launch Systems); By Component (Guidance and Control System, Avionics, Structure, Others); By Payload Capacity (Small Satellite Launch Vehicles, Medium-to-Heavy Lift Vehicles, Super-Heavy Lift Vehicles); By Orbit (Low Earth Orbit (LEO), Medium Earth Orbit (MEO), Geostationary Orbit (GEO)); By Application (Communication, Earth Observation, Navigation, Science and Exploration, National Security and Surveillance); By End User (Government and Civil, Commercial, Defense) |
| Regional Analysis | North America – US, Canada; Europe – Germany, France, The UK, Spain, Italy, Rest of Europe; Asia Pacific – China, Japan, South Korea, India, Australia, Singapore, Rest of APAC; Latin America – Brazil, Mexico, Rest of Latin America; Middle East & Africa – GCC, South Africa, Rest of MEA |
| Competitive Landscape | Airbus S.A.S, Arianespace, The Boeing Company, Rocket Lab, Mitsubishi Heavy Industries, Ltd., Northrop Grumman, Lockheed Martin Corporation, Blue Origin Enterprises, L.P., SpaceX, ISRO |
| Customization Scope | Customization for segments and region/country-level will be provided. Moreover, additional customization can be done based on the requirements. |
| Purchase Options | We have three licenses to opt for: Single User License, Multi-User License (Up to 5 Users), Corporate Use License (Unlimited Users and Printable PDF) |