


Report Overview
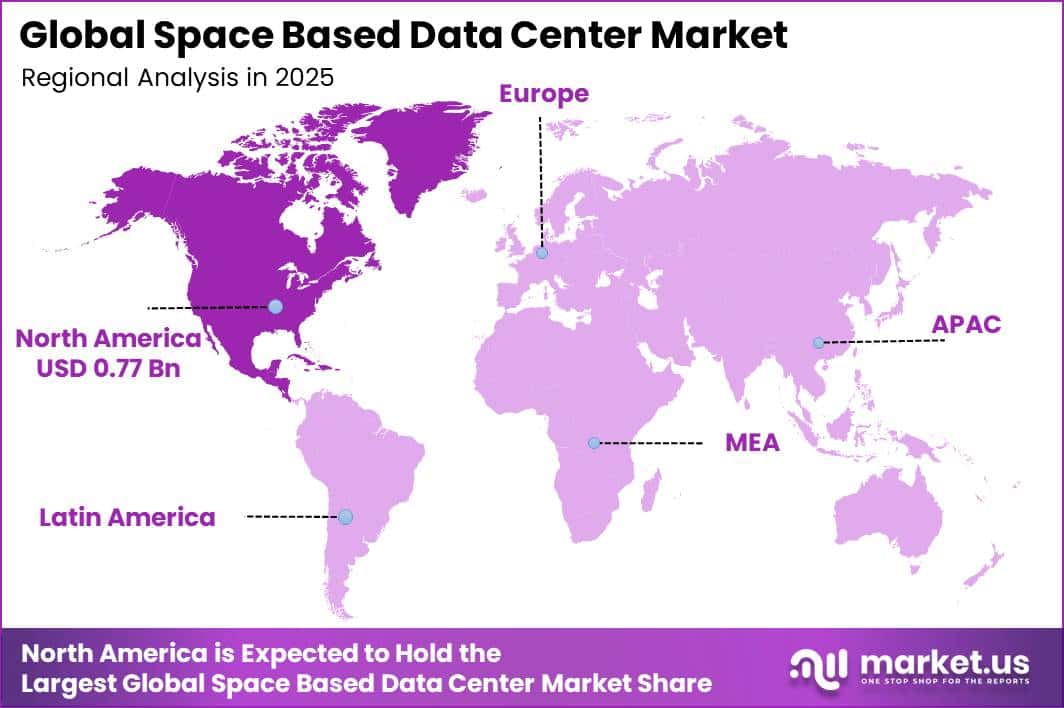
In 2025, the Global Space-Based Data Center Market was valued at USD 2.1 billion. The market is projected to grow at a CAGR of 21.0% during 2026–2035, reaching approximately USD 11.08 billion by 2035. North America dominated the global market in 2025, accounting for more than 37.0% of the total market share and generating approximately USD 0.77 billion in revenue.
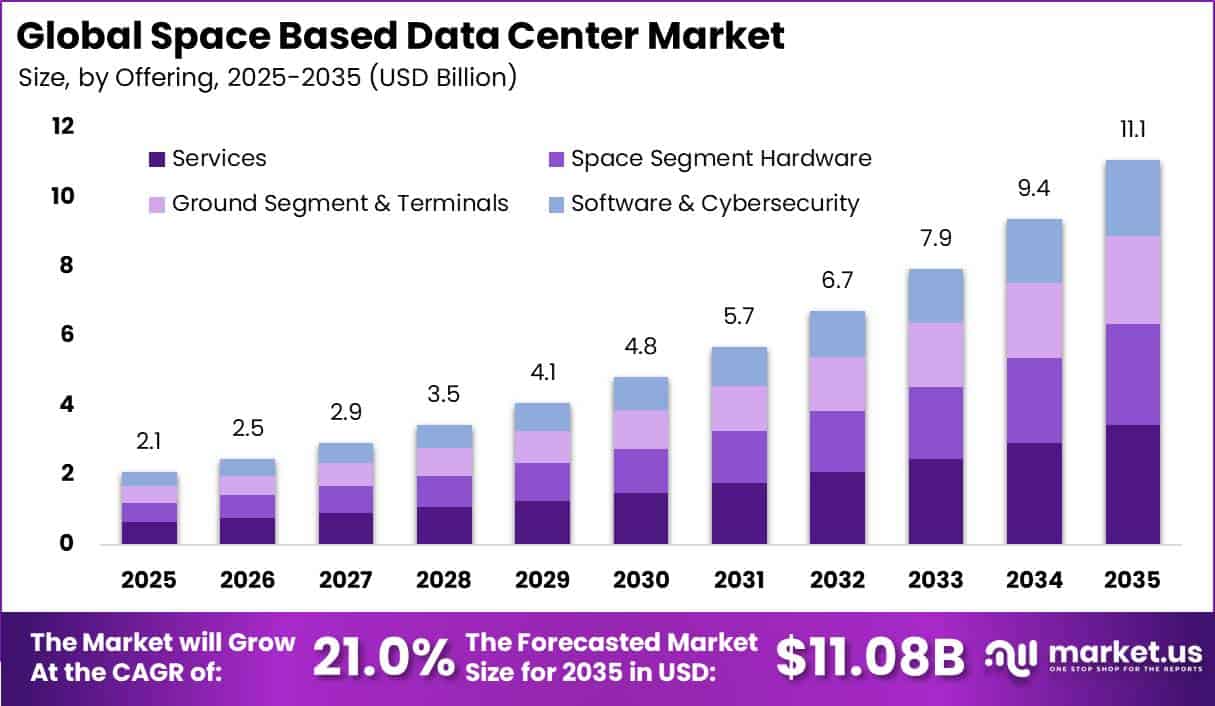
Market growth is supported by rapidly increasing computing and AI workloads. According to the International Energy Agency, global data center electricity consumption increased by 17% in 2025, while power use at AI-focused data centers rose by 50%. Overall data center electricity demand is projected to increase from about 485 TWh in 2025 to 950 TWh by 2030, increasing pressure on land, electricity grids, cooling systems, and water resources.
Space-based infrastructure offers an alternative by using orbital locations and solar energy while reducing dependence on terrestrial land and water resources. Improving launch availability is also supporting commercial development. The FAA recorded 148 licensed commercial launch and reentry operations in fiscal year 2024, an increase of more than 30% from the previous year, and expects activity could more than double by 2028.
Government investment further strengthens the market outlook by supporting new space technologies and private-sector infrastructure. NASA’s fiscal year 2025 budget exceeded USD 25 billion, including more than USD 1.2 billion for space technology research and USD 170 million to support commercial space infrastructure. This funding is helping reduce technology risks and encourage continued investment in orbital computing systems.
Key Takeaway
- The Space-Based Data Center Market is valued at USD 2.1 billion in 2025, projected to reach USD 11.08 billion by 2035 at a CAGR of 21.0%.
- Services led the By Offering segment with a 31.1% share.
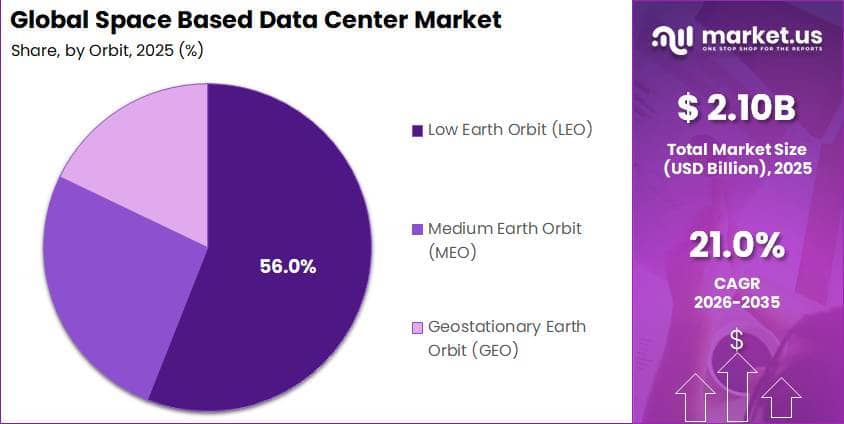
- Low Earth Orbit (LEO) led the By Orbit segment with a 56.0% share.
- Below 1 kW led the By Power Capacity segment with a 42.9% share.
- Commercial led the By End User segment with a 36.1% share.
- North America led the market with a 37.0% share, generating USD 0.77 billion in revenue in 2025.
Market Statistics and Data Insights
- Global data-center electricity consumption increased by 17% in 2025, while electricity use at AI-focused data centers jumped 50% in the same year. This provides direct evidence that AI infrastructure is increasing pressure on terrestrial power systems.
- Capital expenditure by five major technology companies exceeded USD 400 billion in 2025, driven heavily by investment in AI and data-center infrastructure.
- Data centers consumed around 415 TWh of electricity in 2024, equal to roughly 1.5% of global electricity consumption. The United States represented 45% of this consumption, while Europe accounted for 15%.
- Around 6.0 billion people, equal to 74% of the global population, used the internet in 2025. More than 240 million people came online during the year, while 2.2 billion remained offline.
- Global fixed-broadband traffic reached approximately 7.3 zettabytes in 2025, up from 6.2 zettabytes in 2024. Mobile-broadband traffic reached about 1.5 zettabytes.
- An average high-income-country mobile-broadband subscription generated 17.9 GB of traffic per month in 2025, around 8 times the 2.2 GB generated in low-income economies. Fixed-broadband traffic reached around 505 GB per subscription per month in high-income economies.
- Eurostat found that 52.7% of EU enterprises purchased cloud-computing services in 2025, up 7.4 percentage points from 2023. Among cloud users, 71.5% used cloud services for file storage and 28.2% purchased computing power to run their own software.
- Around 26.1% of EU enterprises using paid cloud services used cloud computing platforms for application development, testing, or deployment in 2025, showing growing business dependence on remotely hosted computing infrastructure.
- The FAA authorized a record 204 commercial space operations in fiscal year 2025. During the previous 5 years, the FAA authorized more commercial space operations than during the preceding 3 decades combined.
- The U.S. space economy generated USD 240.9 billion in gross output and USD 142.5 billion in GDP in 2023. Private space-related industries supported around 373,000 jobs and USD 57.9 billion in employee compensation.
- NASA’s TBIRD optical-communications demonstration achieved a data rate of 200 Gbps and transmitted 4.8 terabytes of error-free information during a single 5-minute satellite pass.
- ESA’s latest July 2026 statistics show approximately 46,650 objects are regularly tracked in Earth orbit. Around 18,840 satellites remain in space, and roughly 16,000 are still functioning.
By Offering
The Services segment leads the Space-Based Data Center Market with a 31.1% share, supported by the growing need for continuous satellite operations, data transmission, connectivity, and network management. According to the U.S. Bureau of Economic Analysis, the U.S. space economy contributed USD 131.8 billion to national GDP in 2022. Its real GDP increased by 2.3%, compared with 1.9% growth in the broader U.S. economy, highlighting the rising economic importance of space-related activities.
Unlike hardware, which generally involves one-time equipment purchases, space-based data centers require ongoing services throughout their operating life. These include ground support, satellite communication, data relay, system monitoring, maintenance, and data-processing services. ITU records also show that non-geostationary satellite filings have increased steadily since 2019, with 99 administrations registering such systems.
| By Offering | Segment Shares |
|---|---|
| Space Segment Hardware | 26.2% |
| Ground Segment & Terminals | 23.0% |
| Software & Cybersecurity | 19.7% |
| Services | 31.1% |
By Orbit
Low Earth Orbit (LEO) leads the Space-Based Data Center Market with a 56.0% share, mainly because it provides lower signal delay and more cost-efficient access to orbit compared with higher orbital locations. FAA data shows that commercial launch operations reached a record 148 in fiscal year 2024, with many missions targeting LEO altitudes below 2,000 km.
| By Orbit | Segment Shares |
|---|---|
| Low Earth Orbit (LEO) | 56.0% |
| Medium Earth Orbit (MEO) | 26.1% |
| Geostationary Earth Orbit (GEO) | 17.9% |
In comparison, geostationary orbit is located about 35,786 km above Earth, creating much longer communication delays. The lower altitude of LEO can also reduce launch requirements and improve cost-per-kilogram economics, making it more suitable for building and expanding orbital data-processing infrastructure.
By Power Capacity
The Below 1 kW segment leads the Space-Based Data Center Market with a 42.9% share, mainly because many current orbital computing systems are built on small satellite platforms with limited power capacity. NASA’s Small Spacecraft Technology reports indicate that standard CubeSat and small-satellite solar arrays generally provide around 5 to 100 watts, while more advanced 6U–12U deployable arrays can reach approximately 200 to 275 watts of peak output.
These power limits are closely linked to spacecraft size, as larger solar arrays increase both panel area and overall satellite mass. Higher mass also raises launch expenses, with SpaceX rideshare pricing reaching about USD 7,000 per kilogram in 2026.
As a result, commercial operators often prefer sub-1 kW designs that can balance computing needs with available power, spacecraft weight, and launch costs. This lightweight architecture remains a practical option for early orbital data-processing systems and supports wider deployment as launch activity and space-based computing demand continue to increase.
| By Power Capacity | Segment Shares |
|---|---|
| Below 1 kW | 42.9% |
| 1–5 kW | 27.0% |
| 5–20 kW | 19.0% |
| Above 20 kW | 11.1% |
By End User
The Commercial segment leads the Space-Based Data Center Market with a 36.1% share, supported by the growing role of private companies in satellite networks and orbital infrastructure investment. According to the U.S. Bureau of Economic Analysis, the U.S. space economy generated USD 240.9 billion in gross output and USD 142.5 billion, equal to 0.5% of GDP, in 2023.
Private industry also employed around 373,000 workers and paid approximately USD 57.9 billion in compensation, showing the strong contribution of commercial companies to the space economy. Demand for orbital computing is also supported by rising global internet use. ITU data shows that around 5.5 billion people were online worldwide in 2024, with approximately 227 million additional users gaining internet access within a single year.
This growth is increasing demand for cloud services, streaming, connectivity, and AI applications. As private companies operate a large share of commercial satellite networks and digital services, they are becoming important customers for space-based computing capacity. Continued expansion in internet usage and commercial satellite activity is expected to strengthen demand from this segment.
| By End User | Segment Shares |
|---|---|
| Commercial | 36.1% |
| Government (Civil) | 18.9% |
| Defense & Intelligence | 17.0% |
| Critical Infrastructure & Enterprise | 14.6% |
| Research & Academia | 13.4% |
By Data Source
The Onboard-Generated Data segment leads the Space-Based Data Center Market with a 46.3% share, mainly because modern satellites generate large volumes of raw information that cannot always be transferred efficiently to ground stations. ESA’s Copernicus program shows that Sentinel satellites generate more than 20 terabytes of raw data each day, while the system distributes around 250 terabytes of processed products daily.
This highlights the growing need to filter, organize, and process information before transmission. A similar trend is visible in NASA’s NISAR mission, which is expected to generate around 80 terabytes of radar data per day. In comparison, typical satellite downlink speeds referenced in NOAA broadcast specifications are only a few megabytes per second.
| By Data Source | Segment Shares |
|---|---|
| Onboard-Generated Data | 46.3% |
| Crosslinked Data from Other Satellites | 22.0% |
| Data Uplinked from Ground | 18.0% |
| In-Situ Cislunar Data | 13.7% |
Key Market Segments
By Offering
- Space Segment Hardware
- Ground Segment and Terminals
- Software and Cybersecurity
- Services
By Orbit
- Low Earth Orbit (LEO)
- Medium Earth Orbit (MEO)
- Geostationary Earth Orbit (GEO)
By Power Capacity
- Below 1 kW
- 1–5 kW
- 5–20 kW
- Above 20 kW
By End User
- Commercial
- Government (Civil)
- Defense and Intelligence
- Critical Infrastructure and Enterprise
- Research and Academia
By Data Source
- Onboard-Generated Data
- Crosslinked Data from Other Satellites
- Data Uplinked from Ground
- In-Situ Cislunar Data
Geopolitical Impact Analysis
Rising U.S.-China trade tensions are creating supply-chain challenges for space-based data center hardware, especially semiconductors and rare-earth magnets used in satellite propulsion, solar arrays, and control systems. Following the April 2025 “Liberation Day” tariff order, combined U.S. tariffs on some Chinese semiconductor-related imports reached as high as 145%.
China responded by restricting exports of seven, later expanding to twelve, medium and heavy rare-earth elements. Foreign companies also faced licensing requirements for products containing 0.1% or more Chinese-origin content. China controls roughly 90% of global rare-earth processing capacity, while its rare-earth magnet exports declined nearly 74% year-on-year in May 2025.
These restrictions could increase costs and supply risks for satellite motors, actuators, and other critical components. The U.S. Bureau of Industry and Security had also expanded its Entity List to 3,351 organizations by June 2025, including 1,065 Chinese entities, limiting access to advanced semiconductor manufacturing technologies.
Global shipping disruptions are adding further pressure. UNCTAD reported that Red Sea disruptions forced vessels to reroute through the Cape of Good Hope, while spot freight rates from Shanghai to Jebel Ali increased 55% between May and June 2025. Tensions around the Strait of Hormuz also increased pressure on tanker markets.
Regional Analysis
North America dominates the Space-Based Data Center Market with a 37.0% share, generating approximately USD 0.77 billion in revenue in 2025. The region’s leadership is mainly supported by its strong commercial launch capacity and advanced space infrastructure. U.S. commercial providers completed 154 orbital launches in 2024, representing nearly 60% of total launches worldwide.
| By Region | Region Shares |
|---|---|
| North America | 37.0% |
| Europe | 25.1% |
| Asia Pacific | 21.9% |
| Latin America | 9.0% |
| Middle East & Africa | 7.0% |
SpaceX alone accounted for around 83% of all spacecraft launched during the year. This high launch frequency gives North American companies greater flexibility and cost advantages when deploying satellites and orbital computing systems. Strong federal support also strengthens the region’s position, as government agencies continue investing billions in commercial space technology and next-generation orbital platforms.
Europe follows with a 25.1% share and is also emerging as the fastest-growing regional market. Growth is supported by a major increase in public space investment. ESA member states approved a record €22.3 billion budget for 2026–2029, representing a 31% increase over the previous cycle.
The 2026 annual allocation reached €8.26 billion, including €2.44 billion for Earth observation and €996 million for connectivity and secure communications. Combined with continued EU investment in Copernicus and Galileo programs, this funding is accelerating satellite infrastructure development and strengthening Europe’s position in space-based computing.
Key Regions and Countries
North America
- US
- Canada
Europe
- Germany
- France
- The UK
- Spain
- Italy
- Rest of Europe
Asia Pacific
- China
- Japan
- South Korea
- India
- Australia
- Rest of APAC
Latin America
- Brazil
- Mexico
- Rest of Latin America
Middle East and Africa
- GCC
- South Africa
- Rest of MEA
Market Dynamics
Drivers
| Driver | (~) % CAGR | Geographic Relevance | Impact Timeline |
|---|---|---|---|
| AI inference workload migration to orbit | +5.8% | North America | Short term (2 years or less) |
| Falling launch cost per kilogram | +4.1% | Global | Short term (2 years or less) |
| Sovereign space budget expansion | +3.2% | Europe | Medium term (2 to 4 years) |
| Terrestrial grid power constraints | +2.9% | North America | Short term (2 years or less) |
| Strategic investor capital inflow into orbital compute startups | +2.4% | North America | Short term (2 years or less) |
| Solar-native power economics of orbital assets | +1.6% | Global | Medium term (2 to 4 years) |
AI Inference Workload Migration to Orbit
Rapid AI growth is increasing pressure on terrestrial power grids. Data center electricity use rose strongly through 2024 and 2025, while AI-focused facilities increased power consumption by about 50% in 2025. Grid-interconnection queues in some North American markets now extend 3 to 5 years, encouraging operators to consider orbital computing as an alternative.
Space-based computing can reduce dependence on land, water cooling, and grid connections while enabling faster capacity deployment. Hybrid orbital-terrestrial systems could lower customer acquisition costs for capacity-constrained AI firms by around 15% to 20% per unit of added compute, supporting broader adoption of space-based data infrastructure.
Restraints
| Restraint | (~) % CAGR | Geographic Relevance | Impact Timeline |
|---|---|---|---|
| Rare-earth and semiconductor export licensing barriers | -3.4% | Global | Short term (2 years or less) |
| High-interest capital environment limiting orbital CapEx | -2.1% | Global | Short term (2 years or less) |
| Radiation-hardened component supply scarcity | -1.8% | North America | Medium term (2 to 4 years) |
| Orbital debris liability and insurance cost escalation | -1.3% | Global | Short term (2 years or less) |
Rare-Earth and Semiconductor Export Licensing Barriers
Tighter export controls on rare-earth magnets and advanced chips are creating supply risks for satellite hardware. China’s rules introduced a 0.1% Chinese-origin content threshold, while rare-earth magnet shipments to Western manufacturers fell nearly 74% year-on-year. More than 1,000 Chinese entities were also added to restricted trade lists by mid-2026.
These restrictions can disrupt procurement of radiation-tolerant processors, satellite actuators, and solar-tracking components. Satellite manufacturers may face component lead-time extensions of around 4 to 8 months and landed-cost increases of approximately 12% to 18% for affected subassemblies.
Challenges
| Challenge | (~) % CAGR | Geographic Relevance | Mitigation Horizon |
|---|---|---|---|
| Downlink bandwidth saturation | -1.9% | Global | Medium term (2 to 4 years) |
| Orbital thermal management limits | -1.4% | Global | Medium term (2 to 4 years) |
| Specialized aerospace compute talent shortage | -1.2% | North America | Long term (4 years or more) |
| Launch cadence bottleneck post-Falcon 9 retirement | -1.6% | Global | Medium term (2 to 4 years) |
| Regulatory fragmentation across spectrum licensing bodies | -0.9% | Europe | Long term (4 years or more) |
Downlink Bandwidth Saturation
The main challenge comes from the gap between rapidly increasing onboard data generation and limited ground-station downlink capacity. Advanced radar and imaging satellites can generate as much as 80 terabytes of data per day, while traditional satellite downlinks often operate at only single-digit megabytes per second.
As a result, only a small portion of raw sensor data, sometimes under 5%, can be transmitted without significant onboard processing and compression. This limitation increases the need for higher-performance edge-processing hardware in space. Specialized flight-grade computing chips can carry an estimated 20% to 25% premium over standard alternatives, raising satellite development costs.
Opportunities
| Opportunity | (~) % CAGR | Geographic Relevance | Execution Window |
|---|---|---|---|
| Lunar and cislunar data infrastructure white space | +2.7% | Global | Long term (4 years or more) |
| Orbital compute-as-a-service monetization models | +2.2% | North America | Medium term (2 to 4 years) |
| Defense and sovereign secure-compute contracts | +1.9% | Europe | Medium term (2 to 4 years) |
| Emerging market satellite ground-station partnerships | +1.4% | Asia Pacific | Long term (4 years or more) |
| MandA roll-up of early-stage orbital compute startups | +1.1% | Global | Medium term (2 to 4 years) |
Lunar and Cislunar Data Infrastructure White Space
This remains an untapped opportunity because most commercial activity is still limited to low Earth orbit demonstration payloads. Lunar-surface and cislunar data-relay projects remain at an early stage, with disclosed funding for some lunar data-storage ventures still in the single-digit millions. This shows that the segment has not yet reached enough deployment scale to influence the current market baseline.
Early providers could benefit from premium lunar bandwidth pricing and limited competition. First movers that secure anchor contracts with national space agencies may achieve gross margins around 10 to 15 percentage points higher than standard satellite communications, creating attractive long-term potential for companies entering before the market becomes more competitive.
Key Players Analysis
The Space-Based Data Center Market has a clear competitive structure, led by large aerospace companies with strong launch capabilities and established orbital infrastructure. SpaceX remains a major Tier-1 player, generating USD 18.7 billion in revenue in 2025. Starlink contributed USD 11.4 billion, equal to 61% of total revenue, while increasing 48% year-on-year and generating USD 4.4 billion in operating income.
Thales Alenia Space also benefits from the financial strength of its parent, Thales Group, which reported €20.6 billion in sales in 2024, up 11.7%, along with €25.3 billion in order intake. Axiom Space has raised more than USD 605 million in total funding, including a USD 525 million round completed in June 2026 at a valuation of around USD 2 billion.
Tier-2 companies are expanding mainly through venture funding and specialized technology development. Starcloud raised a USD 250 million Series A extension in August 2026, including a reported USD 25 million investment from Nvidia, increasing its valuation to USD 2.3 billion and total funding to USD 450 million since its 2024 founding.
Its Starcloud-1 mission deployed an H100 GPU in orbit in November 2025. Lonestar Data Holdings remains an early-stage participant with a USD 5 million seed round. Google, Blue Origin, Kepler Communications, and HPE mainly participate through technology partnerships and hardware support.
Top Key Players in the Market
- Axiom Space
- SpaceX
- Starcloud
- Kepler Communications
- Blue Origin
- Skyloom Global
- Thales Alenia Space
- Madari Space
- Sophia Space
- Lonestar Data Holdings
- Spacebilt Inc.
- Hewlett Packard Enterprise
Recent Developments
- In 2025, Google introduced Project Suncatcher, a research initiative focused on building scalable AI computing infrastructure in space using solar-powered satellites and Google TPUs. Google demonstrated optical communication of 800 Gbps in each direction, or 1.6 Tbps in total, and plans to launch two prototype satellites.
- In 2026, Sophia Space selected Apex’s Nova satellite bus for an orbital computing demonstration planned for 2027 and announced a USD 7 million financing round, increasing its total funding to USD 22 million. The mission will demonstrate Sophia Space’s TILE computing modules in orbit for real-time data processing across commercial, government, and defense applications.
Report Scope
| Report Features | Description |
|---|---|
| Market Value (2025) | USD 2.1 Billion |
| Forecast Revenue (2035) | USD 11.08 Billion |
| CAGR (2026-2035) | 21.0% |
| Base Year for Estimation | 2025 |
| Historic Period | 2020-2024 |
| Forecast Period | 2026-2035 |
| Report Coverage | Revenue Forecast, Market Dynamics, Competitive Landscape, Recent Developments |
| Segments Covered | By Offering (Space Segment Hardware, Ground Segment and Terminals, Software and Cybersecurity, Services); By Orbit (Low Earth Orbit (LEO), Medium Earth Orbit (MEO), Geostationary Earth Orbit (GEO)); By Power Capacity (Below 1 kW, 1–5 kW, 5–20 kW, Above 20 kW); By End User (Commercial, Government (Civil), Defense and Intelligence, Critical Infrastructure and Enterprise, Research and Academia); By Data Source (Onboard-Generated Data, Crosslinked Data from Other Satellites, Data Uplinked from Ground, In-Situ Cislunar Data) |
| Regional Analysis | North America – US, Canada; Europe – Germany, France, The UK, Spain, Italy, Rest of Europe; Asia Pacific – China, Japan, South Korea, India, Australia, Singapore, Rest of APAC; Latin America – Brazil, Mexico, Rest of Latin America; Middle East and Africa – GCC, South Africa, Rest of MEA |
| Competitive Landscape | Axiom Space, SpaceX, Starcloud, Kepler Communications, Google, Blue Origin, Skyloom Global, Thales Alenia Space, Madari Space, Sophia Space, Lonestar Data Holdings, Spacebilt Inc., Hewlett Packard Enterprise |
| Customization Scope | Customization for segments, region/country-level will be provided. Moreover, additional customization can be done based on the requirements. |
| Purchase Options | We have three licenses to opt for: Single User License, Multi-User License (Up to 5 Users), Corporate Use License (Unlimited Users and Printable PDF) |





























