
Quick Navigation
Report Overview
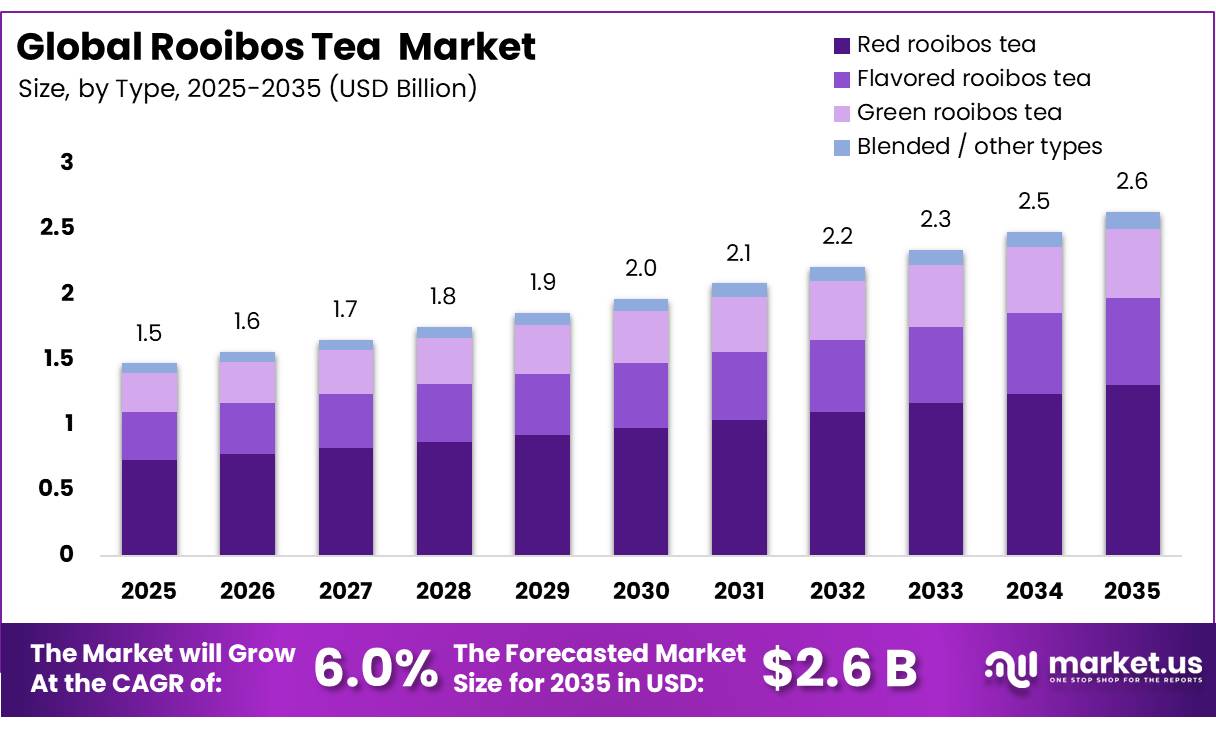
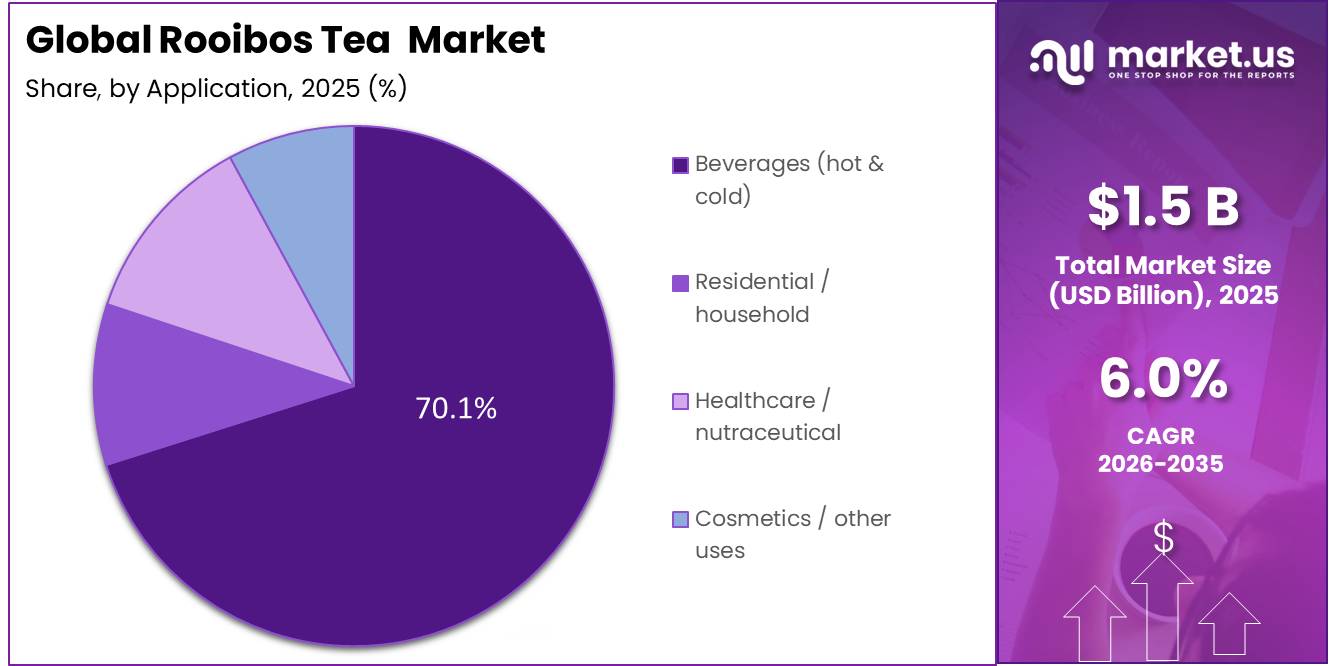
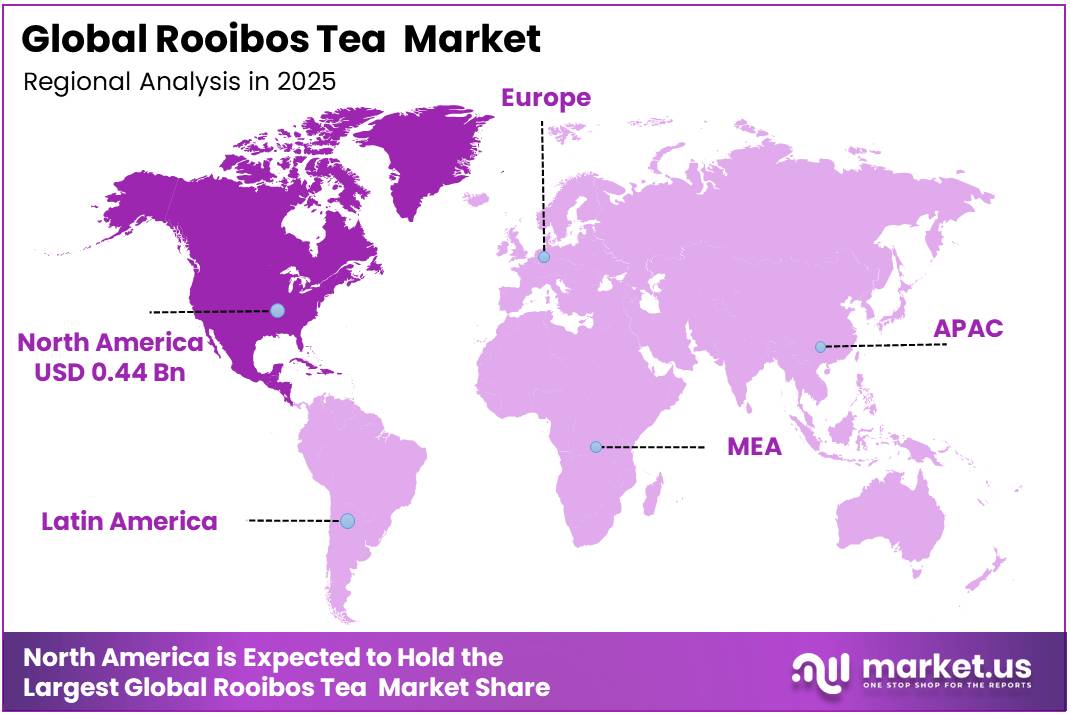
In 2025, the Global Rooibos Tea Market was valued at USD 1.5 billion, and between 2026 and 2035, this market is estimated to register a CAGR of 6.0%, reaching about USD 2.6 billion by 2035. In 2025, North America led the market, achieving over 30.1% share with a revenue of USD 0.44 Billion.
Rooibos tea market is the global commercial growing, processing and distribution of the Aspalathus linearis plant, which can only be grown in the Cederberg region of South Africa. Rooibos has no caffeine, is rich in antioxidants including aspalathin and nothofagin, and has a Protected Designation of Origin (PDO). Principal market drivers are health consciousness and growing demand for caffeine free, antioxidant rich wellness products.
- South Africa reported that rooibos tea consumer prices increased by 5% year over year in May 2026, compared with 5.2% in April 2026, indicating stronger retail price pressure within the category.
Key Takeaways
- The global rooibos tea market was valued at USD 1.5 billion in 2025.
- The global rooibos tea market is projected to grow at a CAGR of 6.0% and is estimated to reach USD 2.6 billion by 2035.
- On the basis of variety, Red Rooibos accounted for a leading 49.8% share of the market in 2025, driven by its established consumer recognition, deeper flavor profile, and longer commercial history relative to green rooibos and other variants.
- On the basis of packaging format, Tea Bags accounted for a leading 45.1% share of the market in 2025, preferred for their convenience, precise portion control, and wide availability across retail and foodservice channels.
- On the basis of application, Beverages accounted for a leading 70.1% share of the market in 2025, reflecting the near-exclusive consumption of rooibos as a hot and cold drink across both domestic and commercial settings.
- On the basis of region, North America accounted for a leading 30.1% share of the market in 2025, supported by high health-conscious consumer spending, strong herbal tea culture, and well-developed specialty retail infrastructure.
Key market driver is the huge trend towards natural functional beverages and luxury clean-label products. The market is under strict primary constraints due to extreme weather instability and climate change in its highly localized growing zone. Energy price spikes also severely raise farming and drying processing costs.
- According to the SARC Industry Report (February 2026), Rooibos exports surpassed 10,000 tonnes for the first time in 2025, reaching around 10,930 tonnes distributed across more than 50 international markets. Japan accounted for the largest share at 33%, while Germany, the Netherlands, the UK, and France continued to provide consistent and stable export volumes.
Industry stakeholders, especially the South African Rooibos Council (SARC), continue to prioritize soil health, biodiversity conservation, and long-term plant resilience over rapid output growth. This strategy approach represents a quality-driven, premium-over-volume growth paradigm that promotes pricing stability and value development. As a result, the market is likely to maintain strong premium price dynamics even during periods of harvest unpredictability or supply shortages, ensuring the global Rooibos tea industry’s long-term viability and competitiveness.
Rooibos Tea Market Segmentation
Type Analysis
Red Rooibos Tea Represents Dominant Segment in the Market.
Red Rooibos Tea represent the dominant segment in the rooibos tea market, accounting for 49.8% share due to strong consumer familiarity, cultural significance, and widespread integration into global supply chains. This strong position comes from the traditional oxidation process, which turns green Aspalathus linearis leaves into deep red needles with a naturally sweet and earthy flavor that appeals to a broad consumer base. Most global packaging and tea bagging plants are set up for oxidized red rooibos. This design lets them produce efficiently without changing equipment.
- In September 2025, Brand South Africa reported that national rooibos production reached approximately 22,600 tonnes in 2023, equivalent to more than 10 billion cups.
Green Rooibos is the fastest-growing category in the market. This unfermented variant undergoes rapid high-heat dehydration immediately after harvest, a process designed to deactivate oxidative enzymes before they can break down the leaf’s natural compounds. The result is a product that retains its green chlorophyll and delivers a measurably higher concentration of aspalathin and nothofagin than conventionally processed Red Rooibos Global demand for clean-label, minimally processed functional ingredients is accelerating, and Green Rooibos sits at a credible intersection of all three attributes natural origin, documented antioxidant potency, and minimal industrial intervention.
Form Analysis
Tea Bags leads in Rooibos Tea Market.
Tea Bags, accounting for 45.1% of the rooibos tea market, represent the dominant material segment due to their convenience for consumers to use tea bags, ease of preparation, and widespread adoption across the global hospitality sector. These systems are designed to handle stackable and space-saving packaged goods, which helps supermarkets and other retailers save space and manage inventory more effectively. High-speed machines use special materials and advanced welding techniques to make thousands of tea bags, like rooibos, every minute, which cuts down the cost of making each bag.
- According to the European Commission’s 2021 Protected Designation of Origin (PDO) product specification for Rooibos/Red Bush, the beverage is typically prepared using one tea bag containing approximately 4 grams of rooibos, steeped in hot water for 2–5 minutes.
Loose-leaf Rooibos is the fastest growing segment in the Rooibos Tea Market by form, driven by rising consumer preference for premium, minimally processed tea and greater demand for customizable brewing experiences. In 2025, loose-leaf rooibos continued to gain popularity among health-conscious consumers, specialty tea retailers, and cafés, particularly across Europe and North America.
Application Analysis
Rooibos Tea Are Mostly Utilized in the Hot and Cold Beverages Sector.
The beverages (hot & cold) segment, accounting for 70.1% of the rooibos tea market, remains the dominant application category because it’s caffeine-free and fits well with the trend of drinking natural, healthy beverages. This leads to people using less coffee and soda. The segment benefits from established retail distribution networks, strong penetration across supermarkets, cafés, and foodservice outlets. Demand has grown for drinks that offer more than just hydration people want antioxidants, which rooibos provides.
- According to the USDA Foreign Agricultural Service (2024), the United States consumes approximately 85 billion servings of tea annually, with around 85% consumed as iced tea. This supports growing demand for rooibos tea in both hot and cold beverage applications.
The Cosmetics is emerging market integrates rooibos extracts directly into advanced dermatological formulations, including anti-aging serums, restorative skin creams, specialized UV-protection lotions, and therapeutic scalp care products. For instance, luxury clean-beauty skincare brands are launching concentrated rooibos-infused facial oils designed to neutralize ambient free radicals and soothe inflammatory skin conditions like eczema and acne.
Key Market Segments
By Type
- Red rooibos tea
- Flavored rooibos tea
- Green rooibos tea
- Blended / other types
By Form
- Tea bags
- Loose‑leaf rooibos
- Ready‑to‑drink (RTD)
- Instant / other
By Application
- Beverages (hot & cold)
- Residential / household
- Healthcare / nutraceutical
- Cosmetics / other uses
Driver Analysis
APAC & Emerging Market Penetration Trade Liberalisation Igniting New Volume Corridors
China, the world’s largest tea consumer by volume, had previously been an inaccessible market due to prohibitive tariff friction; the duty realignment now places rooibos competitively against domestic herbal infusions and premium imported tea categories in a market where premiumisation of functional beverages is accelerating alongside rising middle-class health awareness. Japan, consistently the top rooibos export destination since 2020, absorbed approximately 3,606 tonnes in 2025 representing 33% of South Africa’s total 10,930-tonne export volume with deep penetration across retail, food service, and premium gifting channels.
Simultaneously, the South African Rooibos Council identified Indonesia and Sri Lanka as showing “notable momentum” as new import markets in their 2026 industry review, while Singapore’s import volumes grew 107.7% year-on-year per Tridge trade flow data. The aggregate effect of APAC market deepening is a structural new volume source of 2,000–4,000 additional tonnes per year over a five-year window — a material increment against today’s 10,930-tonne export baseline.
Drivers Impact Analysis
| Driver | (~) % Impact on CAGR | Geographic Relevance | Impact Timeline |
|---|---|---|---|
| Functional Health Positioning | +2.1% | North America (core), Western Europe, Urban Japan & South Korea, Australia | Short term (≤ 2 years) |
| GI & Regulatory Moat | +1.4% | EU (core enforcement zone), UK, SACU export corridors, China (post-tariff) | Medium term (2–4 years) |
| APAC & Emerging Market Penetration | +1.8% | China, Japan (~33% of exports), Indonesia, Sri Lanka, UAE, Saudi Arabia | Medium term (2–4 years) |
| Multi-Format & Adjacent Category Expansion | +1.6% | North America, EU, APAC urban centres, South America spill-over | Short to Medium term |
| Premiumization, Organic & ESG Sourcing | +1.2% | EU (dominant), North America, Australia; emerging in Middle East premium retail | Long term (≥ 4 years) |
| Supply Constraint-Driven ASP Appreciation | +0.8% | South Africa (origin), Global bulk commodity importers, EU private label | Short term (≤ 2 years) |
Restraint Analysis
Single-Origin Cultivation Bottleneck — Geographically Irreplaceable Supply Risk
This single-origin bottleneck is institutionally entrenched: approximately 350 commercial farmers produce 98% of total harvest volumes, with less than 7% of cultivable rooibos land controlled by indigenous or smallholder farmers producing only ~2% of total output — a highly concentrated supplier base that creates counterparty concentration risk for any multinational CPG brand relying on rooibos as a hero ingredient.
Climate envelope modelling published by the University of Cape Town projects that bioclimatically suitable land for both wild and cultivated rooibos types could contract by 49.8% to 88.7% by 2070 under medium-to-high warming scenarios, with the most severe losses occurring along the western and northern periphery of the current production area — precisely the zones where expansion of cultivation has historically been targeted.
Restraint Impact Analysis
| Restraint | (~) % Impact on CAGR | Geographic Relevance | Impact Timeline |
|---|---|---|---|
| Climate-Driven Supply Volatility | -1.8% | South Africa (sole origin); global bulk buyers; EU & Japan importers | Short term (≤ 2 years) |
| Single-Origin Cultivation Bottleneck | -1.2% | Global supply chain; North America, EU, APAC procurement | Long term (≥ 4 years) |
| EU Pesticide MRL Tightening & Food Safety Compliance Costs | -0.9% | EU (dominant enforcement zone), UK, Switzerland, Japan | Medium term (2–4 years) |
| Low Consumer Awareness in High-Growth Markets | -0.8% | India, Indonesia, Vietnam, Saudi Arabia, UAE, Sub-Saharan Africa | Medium term (2–4 years) |
| Export Market Concentration Risk | -0.7% | Japan (core); Germany, Netherlands, UK (EU cluster) | Short to Medium term |
| Structural Supply Chain Inequity & Benefit-Sharing Compliance Cost | -0.5% | South Africa (domestic production base); EU ESG-procurement channels | Long term (≥ 4 years) |
Opportunity Analysis
Women’s Hormonal Wellness Vertical Purpose-Formulated SKUs for an Underserved Demographic
The execution model involves three-tier SKU architecture a standardized green rooibos daily capsule with 200mg ARG extract at a retail price of USD 35–55/month; a flavoured functional tea blend combining rooibos with maca, ashwagandha, and shatavari targeting the Ayurvedic crossover consumer in EU and Australian markets; and a DTC subscription box targeting menopause-specific wellness communities, where subscription LTV typically exceeds single-purchase LTV by 3–4x.
The global women’s health and beauty supplement market at USD 57.42 billion in 2024 represents the immediately addressable premium retail channel for this vertical, with digital-first GTM via Instagram and TikTok wellness communities providing the lowest CAC pathway into the target 40–60 age demographic.
Opportunity Impact Analysis
| Opportunity | (~) % Potential CAGR | Geographic Relevance | Execution Window |
|---|---|---|---|
| Standardized Aspalathin Extract (SAE) as Nutraceutical/Pharma Ingredient | +2.8% | North America (core), EU, Japan, South Korea, Australia | Medium term (2–4 years) |
| Women’s Hormonal Wellness Vertical | +2.1% | North America, EU, Australia, UK; emerging in APAC urban corridors | Short to Medium term |
| India & South/Southeast Asia Market Origination | +1.9% | India, Indonesia, Vietnam, Sri Lanka, Thailand | Medium term (2–4 years) |
| Functional Food & Clean-Label Ingredient Licensing | +1.6% | North America, EU, APAC food manufacturing corridors | Medium term (2–4 years) |
| Value-Chain Vertical Integration & M&A Roll-Up | +1.4% | South Africa, EU branded retail, North America specialty channel | Short term (≤ 2 years) |
| Agritourism & Experiential Wellness Destination | +0.9% | South Africa, secondary in Germany, Japan | Long term (≥ 4 years) |
Challenges Analysis
Seasonal Harvest Labour Scarcity The Annual Workforce Bottleneck
The operational consequence is measurable: across South African agriculture, the OECD estimates that approximately 2.5 million workers left the EU agricultural sector over the last decade, a trend partially mirrored in South Africa’s Western Cape, and Canadian agricultural data quantifies that labour shortages caused a 3.7% decline in sales equivalent to USD 3.5 billion in lost agricultural output in 2022 alone a metric that translates, proportionally, to estimated rooibos yield losses of 5–8% annually when insufficient harvest labour leads to over-ripening, branch loss, or extended unharvested periods beyond optimal cutting windows.
Farm-level mitigation strategies including migrant labour recruitment from the Northern Cape and Eastern Cape, accommodation subsidy programs, and harvest-scheduling technology each add ZAR 3,000–6,000 per seasonal worker in overhead costs above the base wage of approximately ZAR 248 per manday, compressing farmgate margins by 8–12% in peak-demand years while failing to fully resolve the peak-capacity constraint, meaning harvest windows are routinely under-resourced and annual yield realization consistently runs 10–15% below biological production potential.
Challenges Impact Analysis
| Challenge | (~) % CAGR Friction | Geographic Relevance | Mitigation Horizon |
|---|---|---|---|
| Seasonal Harvest Labour Scarcity | -1.2% | South Africa; downstream EU & Japan supply reliability | Long term (≥ 4 years) |
| Smallholder Certification Access Gap | -0.9% | South Africa production base; EU & North America premium procurement channels | Long term (≥ 4 years) |
| Consumer Category Education Deficit | -0.8% | India, Indonesia, Vietnam, Saudi Arabia, UAE; secondary in China | Medium term (2–4 years) |
| South Africa Port & Logistics Infrastructure Friction | -0.7% | South Africa; EU and Japan import lead-times | Short to Medium term |
| R&D Commercialization Lag | -0.6% | Global — North America and EU nutraceutical / pharma channels most impacted | Medium term (2–4 years) |
| Energy Infrastructure Instability & Input Cost Volatility | -0.5% | South Africa; blended into farmgate-to-export cost stack | Short to Medium term |
Geopolitical Impact Analysis
Geopolitical Realignment and Supply Chain Fragmentation Reshaping Rooibos Tea Market.
The continuous global political tensions and local conflicts have had a moderate but important indirect effect on the rooibos tea market. Although most rooibos is grown in South Africa’s Cederberg region, which isn’t in a war zone, the industry is still affected by second-hand issues like blocked trade routes, unpredictable shipping costs, and changing demand in main export countries.
A big factor is the instability in shipping and higher insurance fees have made it more expensive to export South African products, including rooibos. European countries, which buy a lot of rooibos, have faced higher shipping costs and busy ports, which make the final price of packaged tea higher and reduce the profit for exporters.
Regional Analysis
North America Held the Largest Share of the Global Rooibos Tea Market.
In 2025, the North America dominated the global rooibos tea market, holding about 30.1% of the total global consumption, due to trade distribution patterns and South African export data. Europe’s position is a big herbal and functional beverage market, a high preference for drinks without caffeine, and solid tea-drinking traditions in places like Germany, the UK, France, and the Netherlands. Rooibos is seen as healthy and natural, fitting right into their pricey tea sections.
Asia-Pacific grew super-fast in 2025 and 2026 because of a quick-growing specialty tea culture in places like Japan, South Korea, Australia, and China. People there love wellness stuff, so they’re looking for healthier drink options. According to South African Rooibos Council (SARC) February 2026, Japan in 2025 bought a big part about 33% of all Rooibos sold worldwide in year, which adds up to around 3,606 tons. In 2024, China made tariffs way lower just 6% making it easier to import and sell more Rooibos.
Key Regions and Countries
- North America
- The US
- Canada
- Europe
- Germany
- France
- The UK
- Spain
- Italy
- Russia & CIS
- Rest of Europe
- APAC
- China
- Japan
- South Korea
- India
- ASEAN
- Rest of APAC
- Latin America
- Brazil
- Mexico
- Rest of Latin America
- Middle East & Africa
- GCC
- South Africa
- Rest of MEA
Key Players Analysis
The Rooibos tea market has a kind of split structure. It’s oligopolistic for exports and processing but gets all jumbled up for branding and retail stuff. This happens because the tea only grows in South Africa’s Cederberg region, so production stays centralized there. However, once processed, many multinational companies jump in to handle packaging and sales around the world.
Few South African processors, cooperatives, and exporters have a tight grip on rooibos production. These groups handle everything from growing to exporting the stuff, driven by its geographic concentration in the Cederberg region. This results in high entry barriers, reinforcing an oligopolistic setup. Plus, there’s the South African Rooibos Council (SARC), which helps with setting quality standards, protecting the Geographic Indication (GI), and coordinating exports. It keeps that part of the market pretty stable.
Loads of global tea brands, beverage firms, and private label sellers jockey for space in various forms—like tea bags, loose-leaf, and ready-to-drink drinks. Since rooibos falls into larger herbal or wellness sections in big company portfolios, we see lots of little players splitting the market, especially in Europe and North America where new products pop up all the time.
The Major Players In The Industry
- Rooibos Limited
- Cape Natural Tea Products
- Big Five Rooibos Company
- Khoisan Tea
- Coetzee & Coetzee Rooibos Tea
- Freshpak
- Twinings (Associated British Foods)
- Celestial Seasonings
- The Republic of Tea
- Harney & Sons Fine Teas
- Numi Organic Tea
- Tazo Tea
- Stash Tea
- BOS Brands
- Tick Tock Tea
- Others
Key Development
- In May 2026, The Republic of Tea entered a product partnership with Star Wars for a limited-edition collection of 3 tea blends. The range included Razor Crest Raspberry Tea, a red rooibos blend sold for US$15.00 in a recyclable tin containing 36 tea bags. This collaboration helped the company connect rooibos with entertainment-led gifting and younger consumers.
- In April 2026, Khoisan Tea strengthened its position in the rooibos tea sector by operating as a fully independent, family-owned processor and exporter from South Africa’s Cederberg region. The company began green rooibos production responding to growing demand for unfermented and premium tea products.
Report Scope
| Report Features | Description |
|---|---|
| Market Value (2025) | USD 1.5 Bn |
| Forecast Revenue (2035) | USD 2.6 Bn |
| CAGR (2026-2035) | 6.0% |
| Base Year for Estimation | 2025 |
| Historic Period | 2020-2024 |
| Forecast Period | 2026-2035 |
| Report Coverage | Revenue Forecast, Market Dynamics, Competitive Landscape, Recent Developments |
| Segments Covered | By Type (Red rooibos tea, Flavored rooibos tea, Green rooibos tea, Blended / other types), By Form (Tea bags, Loose‑leaf rooibos, Ready‑to‑drink (RTD), Instant / other), By Application (Beverages (hot & cold), Residential / household, Healthcare / nutraceutical, Cosmetics / other uses) |
| Regional Analysis | North America – The US & Canada; Europe – Germany, France, The UK, Spain, Italy, Russia & CIS, Rest of Europe; APAC– China, Japan, South Korea, India, ASEAN & Rest of APAC; Latin America– Brazil, Mexico & Rest of Latin America; Middle East & Africa– GCC, South Africa, & Rest of MEA |
| Competitive Landscape | Rooibos Limited, Cape Natural Tea Products , Big Five Rooibos Company, Khoisan Tea, Coetzee & Coetzee Rooibos Tea, Freshpak , Twinings (Associated British Foods), Celestial Seasonings, The Republic of Tea, Harney & Sons Fine Teas, Numi Organic Tea, Tazo Tea, Stash Tea, BOS Brands, Tick Tock Tea, Others. |
| Customization Scope | Customization for segments, region/country-level will be provided. Moreover, additional customization can be done based on the requirements. |
| Purchase Options | We have three licenses to opt for: Single User License, Multi-User License (Up to 5 Users), Corporate Use License (Unlimited Users and Printable PDF) |


