
Quick Navigation
Report Overview
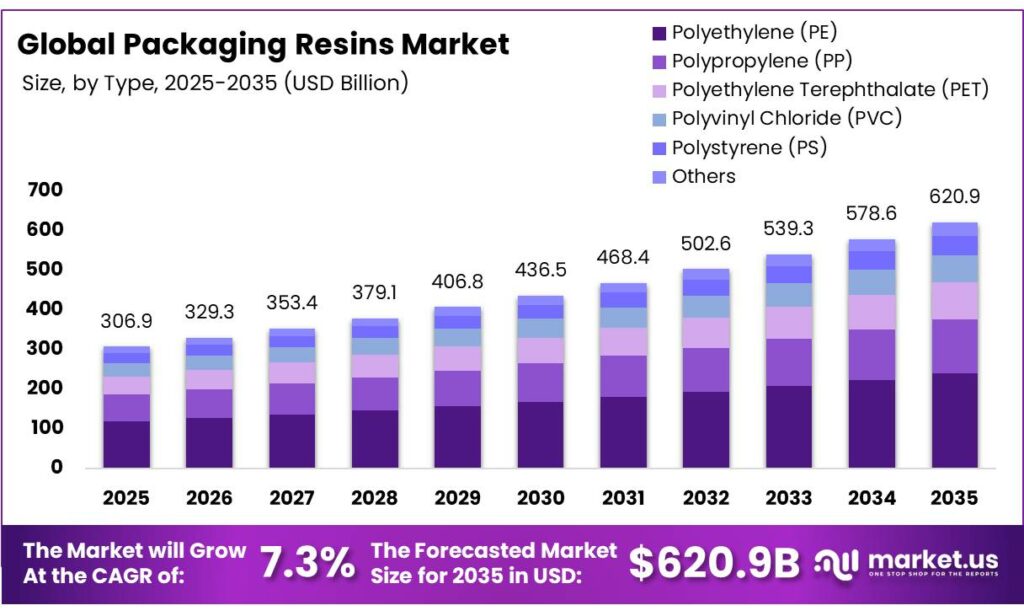
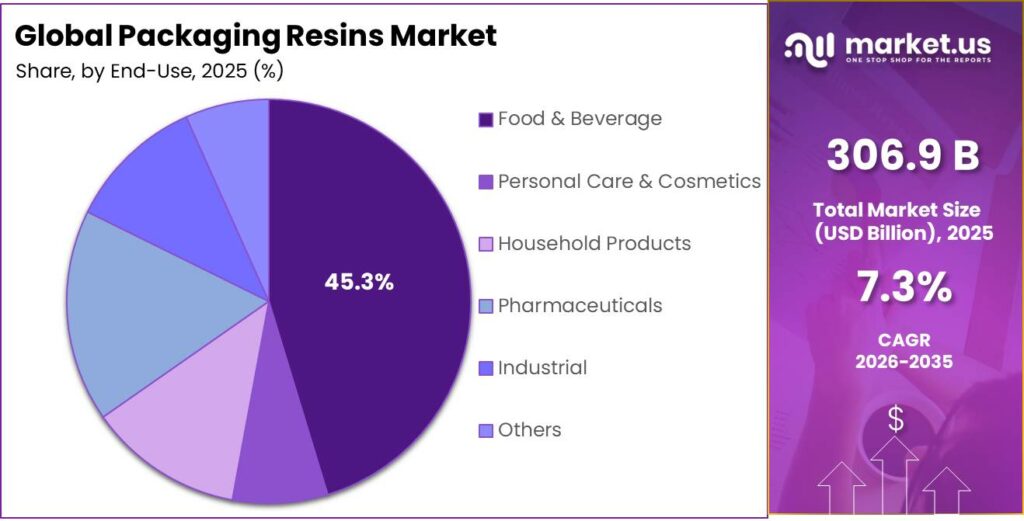
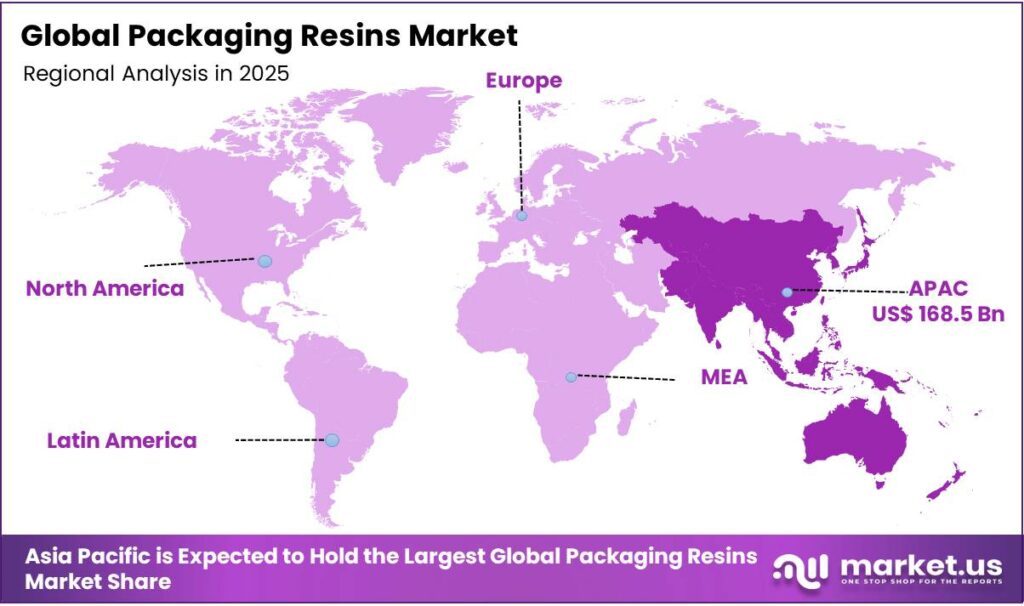
The Global Packaging Resins Market size is expected to be worth around USD 620.9 billion by 2035, from USD 306.9 billion in 2025, growing at a CAGR of 7.3% during the forecast period from 2026 to 2035. In 2025, Asia-Pacific held a dominant market position, capturing more than a 54.9% share, with USD 168.5 billion in revenue.
The packaging resins market is primarily driven by demand from the food and beverage sector, where polyethylene (PE), polypropylene (PP), and polyethylene terephthalate (PET) dominate due to regulatory compliance, versatility, and barrier properties. FDA disclosures highlight these resins’ chemical inertness, low extractability, and suitability for flexible films, rigid containers, and multilayer structures that preserve perishable goods.
Demand for packaging resins continues to rise across the food industry. According to the FDA, more than 80% of packaged food products in the U.S. used food-contact-compliant plastics such as polyethylene and polypropylene. India’s Ministry of Food Processing Industries also reported a 7.2% increase in processed food production, supporting greater use of flexible and rigid plastic packaging.
E-commerce growth has further increased demand for lightweight and durable packaging materials such as HDPE and PET. U.S. e-commerce represented 16.1% of retail sales, compared with 14.2% in 2021, while Amazon reported a 20% annual rise in shipment volumes requiring protective packaging. However, the EPA stated that only 8.7% of plastic containers and packaging were recycled in 2021, highlighting continuing waste-management concerns.
Key challenges include sustainability pressures and regulatory mandates, which promote bio-based or recyclable alternatives such as Polylactic acid (PLA) and bio-PE. Opportunities arise from high-barrier and specialized resins, such as EVOH and cyclic olefin polymers (COP), which enhance shelf life and compliance for sensitive products. Geopolitical tensions affecting feedstock supply further influence regional sourcing and production strategies. Overall, the market reflects a combination of regulatory, functional, and operational drivers shaping resin adoption and innovation.
Key Takeaways
- The global packaging resins market was valued at USD 306.9 billion in 2025.
- The global packaging resins market is projected to grow at a CAGR of 7.3% and is estimated to reach USD 620.9 billion by 2035.
- On the basis of types of resins, polyethylene (PE) dominated the market, constituting 38.6% of the total market share.
- Based on the source, the virgin packaging resins led the market, comprising 84.9% of the total market.
- Among the end-uses of packaging resins, the food & beverage industry is the most considerable within the market, accounting for around 45.3% of the revenue.
- In 2025, the Asia Pacific was the most dominant region in the Packaging Resins market, accounting for 54.9% of the total global consumption.
Type Analysis
Polyethylene (PE) is a Prominent Segment in the Market.
The market is segmented based on types into polyethylene (PE), polypropylene (PP), polyethylene terephthalate (PET), polyvinyl chloride (PVC), polystyrene (PS), and others. Polyethylene (PE) led the market, comprising 38.6% of the market share, due to its combination of versatility, processability, and regulatory compliance.
FDA disclosures indicate that PE is approved for a broad range of food-contact applications, including flexible pouches, films, and liners, owing to its chemical inertness and low extractability. PE’s thermal stability and ease of extrusion or blow molding allow production of thin films and complex shapes with minimal equipment modification.
Its moisture barrier properties and compatibility with multi-layer structures, such as PE/EVOH laminates, enhance shelf-life performance for perishable goods. In contrast, resins like PVC or PS present limitations in flexibility, chemical compatibility, or recyclability. The broad adaptability of PE across flexible and rigid packaging, combined with regulatory acceptance, makes it the most widely employed resin in food and consumer product packaging globally.
Source Analysis
Virgin Packaging Resins Dominated the Market.
On the basis of the source of resins, the market is segmented into virgin and recycled. The virgin packaging resins dominated the market, comprising 84.9% of the market share, due to their consistent quality, performance, and regulatory compliance.
FDA disclosures indicate that virgin polyethylene (PE), polypropylene (PP), and polyethylene terephthalate (PET) meet strict food-contact safety standards with predictable chemical inertness, low extractables, and absence of contaminants. Recycled resins can exhibit variability in molecular weight, color, or residual additives, which may compromise barrier properties, mechanical strength, or processability in films, bottles, and multilayer structures.
Furthermore, virgin resins provide uniform thermal behavior during extrusion, blow molding, and thermoforming, ensuring consistent product quality. While recycled resins are increasingly used in non-food applications, the requirement for stringent hygiene, chemical stability, and regulatory compliance in food and pharmaceutical packaging maintains the preference for virgin resins as the primary material choice.
End-Use Analysis
Food & Beverage Sector Held a Major Share of the Packaging Resins Market.
The packaging resins market is segmented into food & beverage, personal care & cosmetics, household products, pharmaceuticals, industrial, and others. 45.3% of the packaging resins consumed globally are in the food & beverage industry, due to the sector’s extensive demand for safe, durable, and high-volume packaging solutions.
FDA disclosures emphasize that polyethylene (PE), polypropylene (PP), and polyethylene terephthalate (PET) meet stringent food-contact safety standards, including chemical inertness, low extractables, and moisture or gas barrier properties essential for preserving perishable goods.
F&B products require flexible films, pouches, rigid bottles, trays, and multi-layer laminates, which can be efficiently produced from conventional resins. By contrast, personal care, cosmetics, household, pharmaceutical, and industrial sectors typically use smaller volumes, specialized formulations, or metal/glass alternatives.
Key Market Segments
By Type
- Polyethylene (PE)
- High-Density Polyethylene (HDPE)
- Low-Density Polyethylene (LDPE)
- Linear Low-density Polyethylene (LLDPE)
- Polypropylene (PP)
- Polyethylene Terephthalate (PET)
- Polyvinyl Chloride (PVC)
- Polystyrene (PS)
- Others
By Source
- Virgin
- Recycled
By End-Use
- Food & Beverage
- Personal Care & Cosmetics
- Household Products
- Pharmaceuticals
- Industrial
- Others
Opportunity
Chemical recycling-to-resin integration represents a separate growth opportunity from standard recycled-content compliance. Most packaging resin producers still source recycled materials from external suppliers, leaving an estimated USD 50–75 billion opportunity in advanced recycling infrastructure outside their direct control. Although chemical recycling capacity is expanding at more than 25% annually and advanced recycling revenues could exceed USD 15 billion by 2040, fewer than 12 major vertically integrated facilities were operating globally by mid-2026.
A resin producer investing USD 120–180 million in a co-located pyrolysis or depolymerization facility could reduce feedstock costs by 18–22% compared with purchasing open-market rPET or rHDPE. Regulatory measures are strengthening the commercial case.
The EU Packaging and Packaging Waste Regulation becomes applicable in August 2026, while India’s Plastic Waste Management Rules require 30% recycled content in rigid plastic packaging during FY2025–26, increasing to 60% by FY2028–29. Companies integrating recycling assets between 2026 and 2029 could convert the existing USD 1.16 billion chemical recycling market into a proprietary feedstock advantage and potentially add 180–220 basis points to EBITDA margins.
| Opportunity | (~) % Potential CAGR Upside | Geographic Relevance | Execution Window |
|---|---|---|---|
| Chemical Recycling-to-Resin Vertical Integration | +1.8% | EU, North America, Japan | Medium term (2–4 years) |
| Bio-Based & PHA Resins for Premium Segments | +1.5% | EU core, North America, ANZ | Medium term (2–4 years) |
| Pharmaceutical-Grade Specialty Resin Pivot | +1.3% | North America, EU, India | Short term (≤ 2 years) |
| APAC Emerging Market Greenfield Penetration | +1.6% | India, Vietnam, Indonesia, Bangladesh | Medium term (2–4 years) |
| Smart/Active Packaging Resin Formulation Platform | +1.2% | North America, EU, South Korea | Long term (≥ 4 years) |
| M&A Roll-Up of Specialty & Bio-Resin Producers | +1.0% | Global (EU + North America core) | Medium term (2–4 years) |
Drivers
Expansion in food and beverage packaging continues to create strong volume demand for packaging resins. This end-use category accounted for more than 41% of plastic packaging consumption in 2026, and its market value is expected to increase from USD 205.6 billion to USD 305.1 billion by 2034 at a 5.06% CAGR. The wider food packaging industry is also projected to rise from USD 444.9 billion in 2026 to USD 599 billion by 2033.
Plastic accounted for 67.9% of rigid food packaging materials in 2024, and flexible formats held 55.6% of the broader food and beverage packaging sector. Demand for ready-to-eat meals, convenience foods, and single-serve products is increasing resin use per packaged unit, as an individual flexible pouch can require around two to four times more resin surface area per gram of food than bulk packaging.
Polypropylene, representing 30% of packaging resin revenue, and PET remain major beneficiaries because of their extensive use in bottles, snack packs, and prepared-meal trays. In India, packaged food consumption could generate an additional 350,000–500,000 metric tonnes of annual resin demand by 2028. Cold-chain development and dietary changes across Southeast Asia and Sub-Saharan Africa are expected to support further consumption through 2035.
| Driver | (~) % Impact on CAGR Forecast | Geographic Relevance | Impact Timeline |
|---|---|---|---|
| F&B Industry Expansion & Convenience Packaging Demand | +2.0% | APAC, North America, EU, South America | Short term (≤ 2 years) |
| E-Commerce Growth Driving Protective Packaging Resin Demand | +1.5% | APAC emerging markets, North America, EU | Short term (≤ 2 years) |
| Pharmaceutical Sector Expansion & Drug Safety Regulations | +1.3% | North America, EU, India | Medium term (2–4 years) |
| Sustainability Mandates Driving Recycled & Certified Resin Demand | +1.2% | EU core, India, North America | Medium term (2–4 years) |
| Urbanization & Rising Disposable Income in Emerging Markets | +1.0% | India, Southeast Asia, Africa | Long term (≥ 4 years) |
| Lightweight & High-Barrier Resin Technology Adoption | +0.8% | North America, EU, Japan, South Korea | Medium term (2–4 years) |
Restraints
Volatility in crude oil and petrochemical monomer prices remains the most immediate restraint on packaging resin growth. Between April and June 2026, global polypropylene prices increased by more than 30% year to date. During April alone, propylene costs rose by nearly EUR 465 per tonne, while ethylene increased by approximately EUR 450 per tonne.
European polypropylene prices reached EUR 2,080–2,240 per tonne, including weekly gains of EUR 100–130, as crude oil approached USD 100 per barrel amid geopolitical instability. A sustained crude-price increase of 5–10% could reduce margins for highly exposed producers by around 3–5%, with the effects potentially becoming visible during the first half of FY2027.
Commodity-grade resin producers normally operate at EBITDA margins of 12–16%, but sharp feedstock inflation can lower these margins by three to eight percentage points. Higher input costs also delay capacity investments, encourage packaging manufacturers to adopt thinner materials, and weaken resin volume growth. Price increases of EUR 150–450 per tonne across polyethylene, polypropylene, PET, and PVC during the first half of 2026 have further raised converter production costs and slowed product-development activity.
| Restraint | (~) % Impact on CAGR Forecast | Geographic Relevance | Impact Timeline |
|---|---|---|---|
| Crude Oil & Petrochemical Feedstock Price Volatility | -1.8% | Global core, EU & APAC most exposed | Short term (≤ 2 years) |
| EU & Global Single-Use Plastic Regulatory Bans | -1.4% | EU core, ANZ, UK, North America | Medium term (2–4 years) |
| rPET/rHDPE Recycled Content Supply Shortfall | -1.2% | EU, India, North America | Medium term (2–4 years) |
| Overcapacity & Virgin Resin Price Compression | -1.0% | North America, Asia (China excess capacity) | Short term (≤ 2 years) |
| PFAS & Chemical Substance Regulatory Restrictions | -0.8% | EU, North America | Medium term (2–4 years) |
| Geopolitical Trade Disruptions & Tariff Friction | -0.9% | North America–Asia corridors, EU–Middle East | Short term (≤ 2 years) |
Challenges
The packaging resin industry is also confronting a long-term shortage of skilled technical workers. The challenge is being driven by the retirement of experienced polyolefin engineers, limited growth in polymer science graduates, and competition from battery, semiconductor, and advanced composite industries. Plastics manufacturing faced close to 49,000 vacant positions in 2026, while half of packaging companies reported difficulty retaining specialized employees.
In addition, 51% of manufacturing roles were held by people aged 45–65, indicating substantial retirement exposure over the following five to eight years. Staff shortages can extend resin formulation programs from the usual 18–24 months to 30–42 months. Plants relying on less-experienced technicians may also face quality-control costs that are 8–14% higher per batch.
Capability gaps are especially visible in chemical recycling and bio-resin compounding, where actual productivity may remain 15–25% below designed output. Apprenticeships, university partnerships, and AI-supported formulation systems could improve the talent pipeline, but these measures may require three to five years to achieve meaningful scale.
| Challenge | (~) % CAGR Friction Drag | Geographic Relevance | Mitigation Horizon |
|---|---|---|---|
| Technical Workforce Deficit in Polymer Science | -1.1% | North America, EU, India | Long term (≥ 4 years) |
| Multilayer & Multi-Material Recyclability Complexity | -1.3% | EU regulatory hubs, North America, APAC | Long term (≥ 4 years) |
| Digital & Supply Chain Infrastructure Fragmentation | -0.9% | APAC logistics corridors, India, LATAM | Medium term (2–4 years) |
| Carbon Pricing & Scope 3 Emissions Accountability | -0.8% | EU, North America, Australia | Long term (≥ 4 years) |
| Food Contact Safety & Regulatory Complexity | -0.7% | EU, North America, APAC | Medium term (2–4 years) |
| R&D Commercialization Gap for Bio-Resin Platforms | -1.0% | Global, EU & North America lead | Long term (≥ 4 years) |
Geopolitical Impact Analysis
Geopolitical Tensions Have Led to Increased Prices of Packaging Resins.
Geopolitical tensions have influenced the global packaging resins market through supply chain disruptions, trade restrictions, and raw material availability. The U.S. Energy Information Administration (EIA) reported in 2022 that ethylene and propylene feedstocks critical for polyethylene (PE) and polypropylene (PP) production experienced supply volatility due to disruptions in natural gas and crude oil exports from key producing regions.
The U.S. Department of Commerce documented that tariffs and trade restrictions imposed on petrochemical imports from Russia in 2022 led to a 12% reduction in U.S. imports of polypropylene feedstock in Q4 2022 compared to the previous year. Similarly, the European Commission’s Directorate-General for Energy reported that EU ethylene production faced a 7% shortfall in 2022 due to reduced Russian feedstock imports.
In Asia, India’s Ministry of Chemicals and Fertilizers highlighted that the disruption of naphtha supply from the Middle East in 2022 increased reliance on domestic petrochemical feedstocks, constraining production scheduling for packaging resins. These developments have affected resin availability for food, beverage, and industrial packaging applications, necessitating inventory adjustments and regional sourcing strategies to maintain compliance with food-contact regulations while mitigating supply chain risks.
Regional Analysis
Asia Pacific Held the Largest Share of the Global Packaging Resins Market.
In 2025, the Asia Pacific dominated the global packaging resins market, holding about 54.9% of the total global consumption, driven by rapid industrialization, population growth, and expanding food and beverage sectors. According to India’s Ministry of Food Processing Industries, processed food production increased by 7.2% in 2022–23, necessitating substantial use of polyethylene (PE), polypropylene (PP), and polyethylene terephthalate (PET) in flexible and rigid packaging.
China’s National Bureau of Statistics reported that in 2022, the country produced 70.2 million tons of plastic, with a significant share allocated to food and consumer goods packaging. Japan’s Ministry of Economy, Trade and Industry (METI) indicated that multi-layer PE and ethylene-vinyl alcohol (EVOH) films accounted for 38% of domestic high-barrier packaging production in 2022, reflecting demand for oxygen- and moisture-sensitive food packaging.
The combination of rising packaged food consumption, expanding e-commerce logistics, and regulatory emphasis on safe food-contact materials underscores Asia Pacific as a primary driver of global packaging resin demand, with clear quantitative evidence from national production and usage statistics.
Key Regions and Countries
- North America
- The US
- Canada
- Europe
- Germany
- France
- The UK
- Spain
- Italy
- Russia & CIS
- Rest of Europe
- APAC
- China
- Japan
- South Korea
- India
- ASEAN
- Rest of APAC
- Latin America
- Brazil
- Mexico
- Rest of Latin America
- Middle East & Africa
- GCC
- South Africa
- Rest of MEA
Key Players Analysis
Manufacturers of packaging resins prioritize innovation in product performance, sustainability, and application-specific solutions to gain a competitive advantage. Company disclosures highlight the development of high-barrier resins such as EVOH and multilayer films to extend shelf life in food and pharmaceutical packaging.
Sustainability initiatives, including the production of bio-based polyethylene (bio-PE) and polylactic acid (PLA), are emphasized to comply with regulatory mandates and consumer demand for recyclable or compostable materials.
Operational strategies include optimizing feedstock procurement and regional production to mitigate supply chain disruptions, as evidenced by disclosures from petrochemical producers managing naphtha and ethylene supplies. Manufacturers also invest in technical support and collaboration with downstream converters to customize resin formulations for specific packaging requirements, thereby enhancing application versatility and reinforcing long-term customer partnerships.
The Major Players in The Industry
- BASF SE
- Exxon Mobil Corporation
- LyondellBasell Industries Holdings B.V.
- SABIC
- Sinopec
- Dow Inc
- Indorama Ventures Public Company Limited
- PetroChina Company Limited
- Chevron Phillips Chemical
- Reliance Industries Limited
- LG Chem
- Formosa Plastics Corporation
- PTT Global Chemical Public Company Limited
- Braskem
- Borealis GmbH
- Other Key Players
Recent Development
- In June 2025, Dow introduced INNATE TF 220 Precision Packaging Resin, which is a mono-material BOPE (biaxially oriented polyethylene) resin specifically designed for mono-material recyclable packaging. Developed by working with Liby, one of China’s premier consumer goods companies, the resin was used to create packages for detergents from post-consumer recycled material, proving the viability of mono-material BOPE films as an alternative to multilayer lamination for consumer goods applications.
- In September 2025, Mitsui Chemicals, Idemitsu Kosan and Sumitomo Chemical decided to combine their resin businesses in Japan. They plan to finish this by April 2026. This change will bring together 30 percent of Japan’s polyolefin production. It will help them run smoothly and make Japanese resin makers stronger compared to others worldwide.
Report Scope
| Report Features | Description |
|---|---|
| Market Value (2025) | USD 306.9 Bn |
| Forecast Revenue (2035) | USD 620.9 Bn |
| CAGR (2026-2035) | 7.3% |
| Base Year for Estimation | 2025 |
| Historic Period | 2020-2024 |
| Forecast Period | 2026-2035 |
| Report Coverage | Revenue Forecast, Market Dynamics, Competitive Landscape, Recent Developments |
| Segments Covered | By Type (Polyethylene (PE), Polypropylene (PP), Polyethylene Terephthalate (PET), Polyvinyl Chloride (PVC), Polystyrene (PS), and Others), By Source (Virgin and Recycled), By End-Use (Food & Beverage, Personal Care & Cosmetics, Household Products, Pharmaceuticals, Industrial, and Others) |
| Regional Analysis | North America – The US & Canada; Europe – Germany, France, The UK, Spain, Italy, Russia & CIS, Rest of Europe; APAC- China, Japan, South Korea, India, ASEAN & Rest of APAC; Latin America- Brazil, Mexico & Rest of Latin America; Middle East & Africa- GCC, South Africa, & Rest of MEA |
| Competitive Landscape | BASF SE, Exxon Mobil Corporation, LyondellBasell Industries Holdings B.V., SABIC, Sinopec, Dow Inc., Indorama Ventures Public Company Limited, PetroChina Company Limited, Chevron Phillips Chemical, Reliance Industries Limited, LG Chem, Formosa Plastics Corporation, PTT Global Chemical Public Company Limited, Braskem, Borealis GmbH, and Other Players. |
| Customization Scope | Customization for segments and region/country-level will be provided. Moreover, additional customization can be done based on the requirements. |
| Purchase Options | We have three licenses to opt for: Single User License, Multi-User License (Up to 5 Users), Corporate Use License (Unlimited Users and Printable PDF) |


