


Report Overview
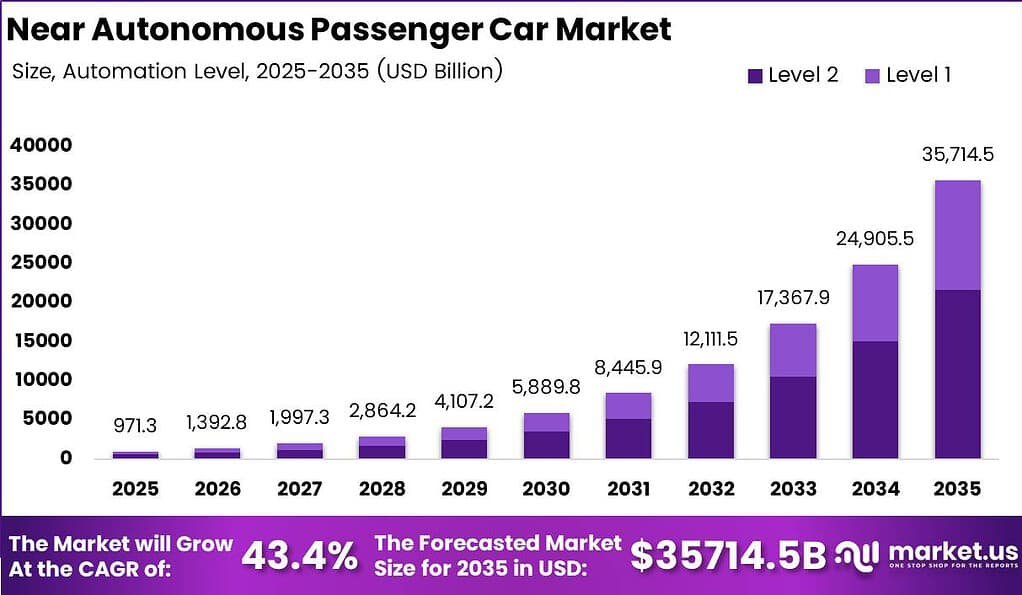
Global Near Autonomous Passenger Car Market size is expected to be worth around USD 35714.5 Billion by 2035 from USD 971.3 Billion in 2025, growing at a CAGR of 43.4% during the forecast period 2026 to 2035. This trajectory places near autonomous passenger cars among the fastest-expanding segments in global mobility. Investors and OEMs that establish hardware and software positions early will capture outsized margin before the market reaches saturation.
The Autonomous Vehicle market encompasses passenger cars equipped with automation systems ranging from Level 1 driver assistance to Level 3 conditional automation. These vehicles integrate sensors, perception software, mapping systems, and electronic control units to reduce or temporarily replace human driving tasks. The market spans hardware supply chains, software licensing, OTA feature delivery, and regulatory certification ecosystems across all major vehicle-producing regions.
Key Takeaways
- The global Near Autonomous Passenger Car Market is valued at USD 971.3 Billion in 2025 and is forecast to reach USD 35714.5 Billion by 2035.
- The market is expanding at a CAGR of 43.4% from 2026 to 2035.
- By Automation Level, Level 2 is the dominant segment with a 60.50% share.
- By Propulsion Type, Internal Combustion Engine (ICE) leads with a 57.00% share.
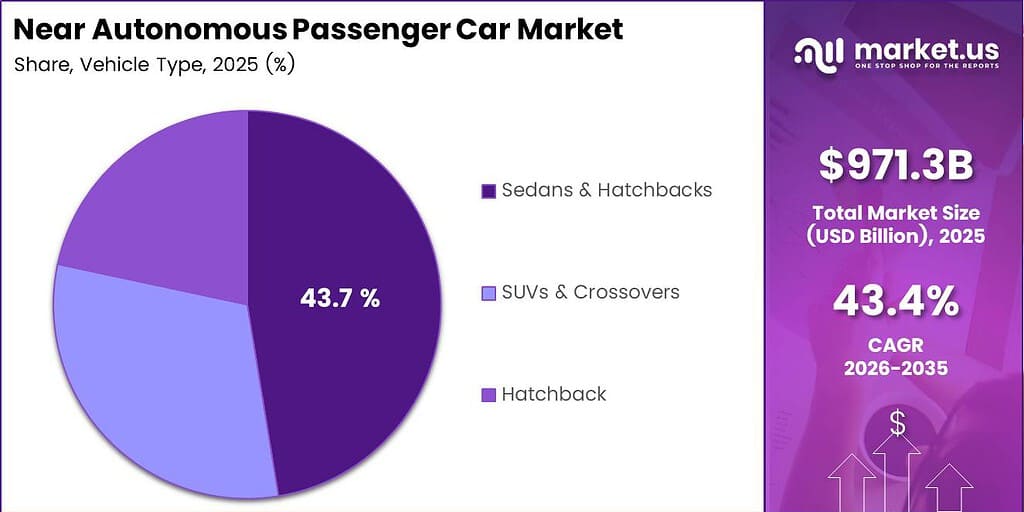
- By Vehicle Type, Sedans and Hatchbacks hold the largest share at 43.00%.
- By Component Type, Hardware dominates with a 72.00% share.
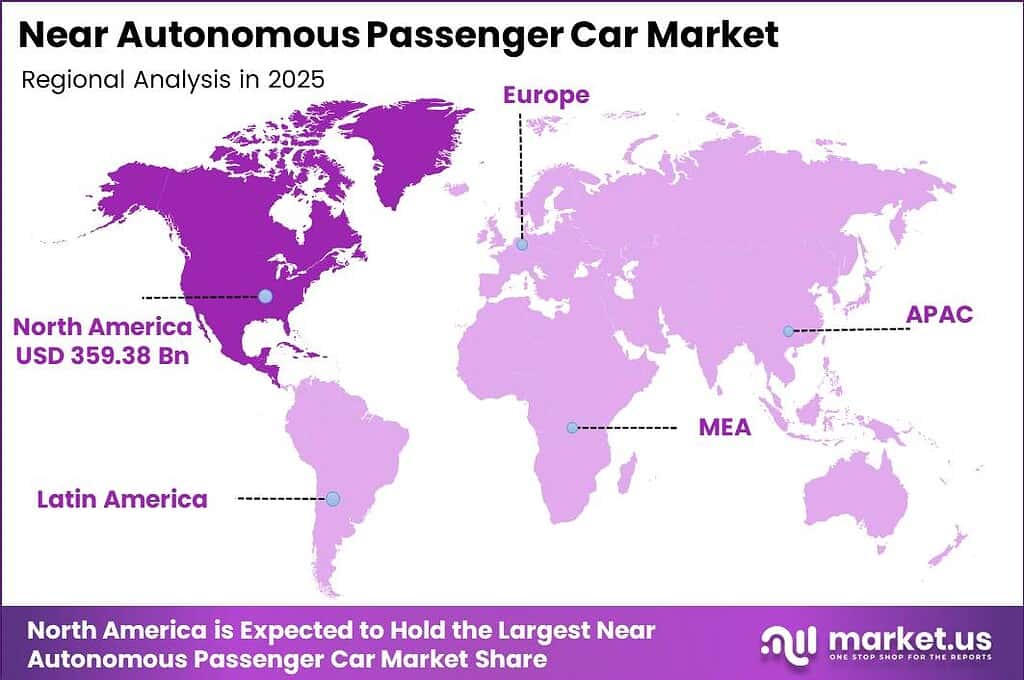
- North America is the dominant region with a 37.00% market share, valued at USD 359.38 Billion.
In the aggregated five-country European market of Germany, France, Italy, Spain, and the United Kingdom, Level 2 systems rose to 35% of new cars in 2025, up from 22% in 2022. As reported by JATO Dynamics, the share of new cars carrying no automation at all fell below 44% by 2025, from nearly 59% three years earlier. This structural shift compresses the addressable base for conventional vehicles and accelerates the hardware refresh cycle across all major European OEMs.
Data from Ford’s 2025 BlueCruise usage report shows hands-free miles driven in the United States rose 88% year over year in 2025, while BlueCruise trips rose 50% versus the prior year. Consumer adoption at this pace signals that hands-free highway driving is crossing from early-adopter novelty into mainstream purchase criteria. OEMs that bundle Level 2+ capability as a standard feature will gain retention advantages over rivals still treating it as an optional add-on.
Government permitting frameworks are reshaping the competitive order faster than consumer preference alone. China’s Ministry of Industry and Information Technology issued its first conditional Level 3 production access permits in December 2025, authorizing two electric sedans for public-road operation and extending eligibility to all licence holders, including foreign-invested OEMs, from January 2026. This policy shift converts installed hardware into a monetizable software entitlement, forcing global competitors to localize their certification strategies or forfeit access to the world’s largest passenger car market.
Automation Level Analysis
Level 2 dominates with 60.50% due to regulatory readiness and proven highway deployment.
In 2025, Level 2 held a dominant market position in the By Automation Level segment of the Near Autonomous Passenger Car Market, with a 60.50% share. Level 2 systems simultaneously control steering and acceleration under specific driving conditions, placing them at the exact intersection of consumer affordability and regulatory acceptance in every major market. According to JATO Dynamics, Level 2 penetration across Germany, France, Italy, Spain, and the UK reached 35% of new car registrations in 2025. Any OEM without a competitive Level 2 offering faces direct share loss to rivals that already ship this capability at volume.
Level 1 systems represent the entry point to the automation ladder and serve as the primary driver of initial consumer familiarity with assisted driving. These systems control either steering or speed independently but not both simultaneously, making them simpler to certify and insure. According to the International Organization of Motor Vehicle Manufacturers (OICA), global passenger car production exceeded 70 million units in 2024, and the majority of new vehicle platforms now ship with at least one Level 1 feature as a baseline safety offering. This baseline position makes Level 1 the volume foundation on which higher automation tiers are commercially built.
Propulsion Type Analysis
Internal Combustion Engine (ICE) dominates with 57.00% due to existing fleet scale and infrastructure depth.
In 2025, Internal Combustion Engine vehicles held a dominant market position in the By Propulsion Type segment of the Near Autonomous Passenger Car Market, with a 57.00% share. ICE vehicles carry the largest installed base of any propulsion platform, meaning the majority of ADAS and automation hardware upgrades in the near term apply to petrol and diesel platforms. According to the International Energy Agency, the global ICE passenger car fleet exceeded 1.2 billion vehicles in 2024. This scale guarantees that Tier 1 sensor and software suppliers prioritize ICE-compatible integration ahead of pure-electric variants.
Battery Electric Vehicles represent the fastest-scaling propulsion platform within the near-autonomous segment. BEVs offer structural advantages for automation hardware integration because their zonal electronic architectures and centralized compute platforms simplify sensor fusion and OTA update delivery. According to IEA data, global BEV passenger car sales surpassed 17 million units in 2024, marking a year-on-year increase of more than 25%. Suppliers that engineer automation stacks natively for BEV compute architectures will compress integration timelines and earn preferred-vendor status with the fastest-growing OEM programs globally.
Hybrid Electric Vehicles, including plug-in hybrid variants, occupy a transitional position in the propulsion mix. HEVs and PHEVs carry both an electric motor and a combustion engine, providing range flexibility while supporting the higher onboard power budgets that advanced perception hardware requires. According to OICA trade statistics, hybrid passenger car production across Japan, Europe, and North America combined exceeded 8 million units in 2024. This production volume positions hybrids as a durable mid-segment entry point for Level 2 automation features, particularly in markets where charging infrastructure limits full BEV adoption.
Vehicle Type Analysis
Sedans and Hatchbacks dominate with 43.00% due to highest global production volume and affordability.
In 2025, Sedans and Hatchbacks held a dominant market position in the By Vehicle Type segment of the Near Autonomous Passenger Car Market, with a 43.00% share. These body styles represent the core of global passenger car output across all major producing economies and are the primary target for mass-market automation hardware integration. According to OICA, sedans and hatchbacks accounted for over 40 million units of global passenger car production in 2024. OEMs that standardize automation stacks on sedan and hatchback platforms reach the widest buyer base at the lowest per-unit certification cost.
SUVs and Crossovers are the fastest-growing vehicle type category globally and carry disproportionate automation content per unit due to their elevated price points and premium feature expectations. Buyers of SUVs and crossovers consistently rank advanced safety and driver assistance features among their top three purchase criteria, according to J.D. Power consumer studies. Per UN Comtrade trade data, global exports of SUV and crossover passenger vehicles exceeded 12 million units in 2024. This export intensity means automation feature parity across geographies is commercially necessary for any OEM competing in this segment internationally.
Component Type Analysis
Hardware dominates with 72.00% due to mandatory sensor and ECU integration at every automation level.
In 2025, Hardware held a dominant market position in the By Component Type segment of the Near Autonomous Passenger Car Market, with a 72.00% share. Every automation level from Level 1 upward requires physical sensors, radar modules, cameras, LiDAR units, and electronic control units to be embedded in the vehicle at the point of manufacture. According to UNIDO industrial output reporting, global automotive electronics and sensor module production surpassed USD 280 billion in 2024. Hardware’s dominant revenue share reflects the fact that physical components must be manufactured, validated, and installed before any software layer can operate, giving hardware suppliers structural billing precedence in every program budget.
Software represents the highest-margin growth vector within the component mix, despite its current minority revenue share. Perception algorithms, HD mapping stacks, and operating systems are the primary determinants of automation performance and regulatory approval status. Per patent database analysis, autonomous driving software patent filings globally exceeded 15,000 new applications in 2024, signaling intense competition for intellectual property position. Companies that hold foundational software IP can license across multiple hardware platforms, converting a fixed R&D investment into recurring royalty streams that compound as vehicle production scales.
Within Hardware, Sensors represent the sub-component category with the most active cost deflation and technology substitution. Radar, LiDAR, and camera modules are each undergoing separate cost reduction curves driven by solid-state manufacturing and volume procurement. According to IEA and industry association reporting, solid-state LiDAR unit costs declined at rates exceeding 20% per year between 2022 and 2024. ECUs are simultaneously consolidating from distributed to zonal architectures, reducing per-vehicle unit counts while increasing per-unit compute density and revenue per socket.
Key Market Segments
By Automation Level
- Level 1
- Level 2
By Propulsion Type
- Internal Combustion Engine (ICE)
- Battery Electric Vehicles (BEVs)
- Hybrid Electric Vehicles (HEVs/PHEVs)
By Vehicle Type
- Sedans and Hatchbacks
- SUVs and Crossovers
- Hatchback
By Component Type
- Hardware
- Sensors
- Radar
- LiDAR
- Cameras
- ECUs
- Software
- Perception
- Mapping
- Operating Systems
Regional Analysis
North America Dominates the Near Autonomous Passenger Car Market with a Market Share of 37.00%, Valued at USD 359.38 Billion
North America leads the global Near Autonomous Passenger Car Market on the strength of deep OEM investment, active regulatory frameworks, and the world’s largest base of commercially deployed autonomous mile data. Ford BlueCruise hands-free Blue Zones cover over 130,000 miles of prequalified divided highways across North America, creating a ready infrastructure for Level 2+ adoption at scale. As per our research, the region’s combination of highway-heavy driving patterns and high vehicle transaction values makes it the most commercially attractive proving ground for automation feature monetization globally.
Europe is the fastest-growing region in the near autonomous passenger car market, driven by regulatory mandates and OEM-level certification activity at Level 3. According to JATO Dynamics, Mercedes-Benz DRIVE PILOT holds approval across approximately 13,200 km of German motorway, establishing Europe as the first region with mass-market Level 3 infrastructure in place. The EU’s phased ADAS sensing mandate creates a regulatory floor that forces automation hardware into every new vehicle sold in member states, compressing the timeline for volume-level feature penetration across the entire European fleet.
Asia Pacific represents the single largest near-term policy catalyst for the global market. China’s December 2025 Level 3 permitting framework opened conditional automation to all licensed OEMs, including foreign-invested players, from January 2026. The Connected Car market in Asia Pacific benefits directly from this, as vehicle connectivity is a prerequisite for OTA-delivered ADS entitlements. Latin America and the Middle East and Africa regions currently represent early-stage adoption zones, where hardware fitment for global export models is driving initial automation content growth ahead of domestic regulatory frameworks.
Key Regions and Countries
North America
- US
- Canada
Europe
- Germany
- France
- The UK
- Spain
- Italy
- Rest of Europe
Asia Pacific
- China
- Japan
- South Korea
- India
- Australia
- Rest of APAC
Latin America
- Brazil
- Mexico
- Rest of Latin America
Middle East and Africa
- GCC
- South Africa
- Rest of MEA
Market Dynamics
Market Opportunity Analysis - Underexploited automation tiers and emerging-market OEM gaps create high-return entry points
In a 2026 McKinsey survey of autonomous-vehicle experts, 49% believed the mass market for privately owned vehicles will center on L2+ functions by 2035. This consensus points to Level 2+ as the primary commercial battleground, yet no single OEM holds dominant share across all major regions simultaneously. New entrants that target the Level 2+ certification and integration gap in Southeast Asia and Latin America, where domestic regulatory frameworks are forming but few OEMs have localized ADAS stacks, can establish preferred-supplier positions before incumbents deploy full localization resources.
Baidu Apollo Go delivered 3.2 million fully driverless rides in Q1 2026 alone, with cumulative rides exceeding 22 million as of April 2026. This operational scale in China confirms that fully driverless passenger mobility is past proof-of-concept and entering commercial density. By contrast, no equivalent commercial robotaxi operation exists at comparable scale in Southeast Asia or the Gulf, despite lighter regulatory restrictions in several of those jurisdictions. Investors that fund early robotaxi and near-autonomous fleet deployment in GCC states and ASEAN markets gain first-mover operational data advantages that are extremely difficult for later entrants to replicate.
Zoox surpassed 1 million autonomous miles with its robotaxi fleet in 2025 and launched paid public service in Las Vegas, demonstrating that purpose-built autonomous vehicles can reach commercial operations in mid-tier US cities without requiring the infrastructure density of a San Francisco or Phoenix. This matters because mid-tier cities represent an underserved white space between the dense urban deployments of leading operators and the private passenger car automation market. BMW Personal Pilot L3 launched at approximately EUR 6,000 as an option, confirming that premium buyers accept conditional automation as a discretionary purchase at current pricing.
The Driver Monitoring System market benefits from the same regulatory tailwinds driving near-autonomous adoption, as DMS is a mandatory prerequisite for Level 3 type approval in the EU and several UNECE contracting parties. This creates a captive adjacent revenue stream for suppliers that can bundle DMS with perception and mapping hardware in a single certified module. OEMs seeking to compress integration timelines will prefer single-supplier bundles over multi-vendor assembly, giving integrated DMS and ADAS platform providers a structural bid-selection advantage in competitive procurement.
Technology and Innovation Landscape - Sensor cost deflation, OTA monetization, and simulation infrastructure define the next competitive divide.
Solid-state LiDAR unit costs declined at rates exceeding 20% per year between 2022 and 2024, according to IEA and industry association reporting. This cost curve means that LiDAR, previously viable only on premium trims and robotaxi platforms, is now entering mid-market vehicle programs. Hardware suppliers that scale solid-state manufacturing first will establish cost positions that sensor-fusion software vendors must design around, making early volume commitments a prerequisite for meaningful market share in the perception hardware segment through the end of the decade.
As of April 2026, General Motors customers had driven 1 billion hands-free miles with Super Cruise driver assistance technology, with Ford and Lincoln customers logging over 600 million BlueCruise miles globally by early 2026. These accumulated mile counts are not just marketing milestones. They represent proprietary edge-case scenario libraries that train and validate successive software releases. OEMs without comparable real-world data volumes face structurally higher simulation costs to close the scenario coverage gap required for regulatory submission.
In Q3 2025, Tesla recorded one crash for every 6.36 million miles driven with Autopilot engaged, versus one crash per 993,000 miles without Autopilot. Across more than 5.4 million fully autonomous miles in Atlanta, Waymo recorded 94% fewer airbag-deployment crashes and 86% fewer injury-involving crashes than the human benchmark. These performance differentials are the technological argument that converts regulatory skeptics and insurers. The Automotive Artificial Intelligence systems underpinning these results are themselves becoming the primary basis of competitive differentiation at every automation level from Level 2 upward.
Waymo logged 82% fewer airbag-deployment crashes and 82% fewer injury-causing crashes compared with human drivers in the same areas through March 2026, with additional data showing 93% fewer pedestrian injury crashes and 84% fewer cyclist and motorcycle injury crashes. These safety metrics at scale provide the actuarial foundation that commercial insurers require before pricing Level 3 and Level 4 products competitively. Once insurers move from conservative loading to actuarially grounded pricing, the insurance premium premium currently suppressing Level 3 consumer demand across Germany, Japan, and the United States will narrow significantly.
Drivers
China’s Ministry of Industry and Information Technology issued its first conditional Level 3 production access permits in December 2025, authorizing two electric sedans for public-road operation. One permit covered single-lane congestion driving at up to 50 km/h in Chongqing and another covered designated expressway sections at up to 80 km/h in Beijing. Eligibility extended to all licence holders, including foreign-invested OEMs, from January 2026. This converts a one-time hardware sale into a recurring software entitlement, shifting OEM revenue models toward higher-margin subscription income.
ADS-capable vehicle trims carry 150 to 400 TOPS of on-vehicle compute, moving roughly 60% to 75% of inference workload to the edge. This reduces annual per-vehicle connectivity and cloud egress cost by an estimated USD 90 to USD 140. Permit-gated exclusivity supports subscription attach rates in the 25% to 40% band on eligible trims. Sellers that secure early permits lock competitors out of the most profitable trim configurations in China’s new-energy passenger vehicle market for at least the next regulatory cycle.
| Driver | (~) % Impact on CAGR Forecast | Geographic Relevance | Impact Timeline |
|---|---|---|---|
| Conditional L3 market-access permitting in China | +5.2% | China (Beijing, Chongqing pilot cities) | Short term (2 years or less) |
| ALKS type-approval extension to motorway speeds | +4.6% | Europe, Japan, Korea, UNECE 1958 signatories | Short term (2 years or less) |
| Solid-state perception sensor cost deflation | +3.9% | Global; China-led manufacturing base | Short term (2 years or less) |
| Zonal E/E architecture and SoC consolidation | +3.1% | North America, Europe, China | Medium term (2 to 4 years) |
| OTA feature-entitlement monetization by OEMs | +2.7% | North America, China, Western Europe | Short term (2 years or less) |
| EU baseline ADAS sensing mandate phase-in | +2.2% | European Union, EFTA, UK alignment | Short term (2 years or less) |
Restraints
UNECE Regulation No. 157 permits hands-off operation but assigns no uniform apportionment of fault during the driver takeover window. In the United States, the federal ADS oversight rulemaking proposed on January 15, 2025 was formally withdrawn in 2026 per Federal Register notice, leaving state tort law as the operative liability regime. Insurers price Level 3-enabled trims with loadings of roughly 15% to 30% over comparable Level 2 vehicles, because no actuarial loss history yet exists for conditional automation at consumer scale.
OEM warranty and legal accruals disclosed in SEC filings for ADS-active portfolios have run approximately 80 to 200 basis points above conventional powertrain lines, forcing manufacturers to self-insure residual liability. Legal departments restrict feature activation to narrow operational design domains even where hardware is already physically installed. Capitalized ADS validation programs slip 12 to 24 months in CapEx phasing, and unit contribution margin on activated trims compresses by an estimated 200 to 350 basis points once indemnity reserves are charged to the program. The result is installed-but-dormant capability that cannot be monetized in several high-income markets.
| Restraint | (~) % Impact on CAGR Forecast | Geographic Relevance | Impact Timeline |
|---|---|---|---|
| Unresolved handover liability and insurability | -4.3% | Global; acute in United States, Germany, Japan | Short term (2 years or less) |
| Export controls on AI compute and sensor inputs | -3.5% | United States, China, allied export-control blocs | Medium term (2 to 4 years) |
| Elevated policy rates constraining auto credit | -2.6% | North America, Europe, emerging markets | Short term (2 years or less) |
| Tariff loading on imported vehicles and modules | -2.4% | United States, EU, retaliatory jurisdictions | Short term (2 years or less) |
| Municipal activation bans and geofence refusals | -2.1% | United States city level, selected EU metros | Medium term (2 to 4 years) |
| Type-approval authority processing backlog | -1.9% | Europe, Japan, Korea | Short term (2 years or less) |
Challenges
Demonstrating that a conditional automation stack is safer than the human baseline requires exposure on the order of hundreds of millions of kilometres. Per UNECE WP.29 audit-based assessment requirements, manufacturers must evidence scenario coverage rather than simply aggregate distance. R&D intensity at ADS-active OEMs and Tier 1 suppliers runs at 6% to 10% of revenue, compared to roughly 4% for conventional programs. Each safety-relevant software recalibration adds 6 to 14 weeks to release cadence, compounding validation debt faster than accumulated fleet mileage can retire it.
Per Euro NCAP assessment protocol revisions, the required scenario set expands with every biennial update, meaning validation obligations grow even as OEMs attempt to close existing gaps. Firms are shifting from release-based to continuous homologation, capitalizing simulation infrastructure as a shared platform amortized across multiple vehicle nameplates. This architectural shift requires permanent assurance-case teams whose fixed cost caps how many operational design domains any single OEM can commercially support simultaneously. The practical ceiling on parallel ODD programs is a competitive moat that entrenched players will use to slow new entrants.
| Challenge | (~) % CAGR Friction Drag | Geographic Relevance | Mitigation Horizon |
|---|---|---|---|
| Validation mileage and simulation burden | -3.2% | Global; heaviest in Europe and Japan | Long term (4 years or more) |
| Safety-critical software talent deficit | -2.6% | Germany, United States, Japan, India GCCs | Long term (4 years or more) |
| Vehicle cybersecurity certification overhead | -2.2% | UNECE R155 contracting parties | Medium term (2 to 4 years) |
| HD map freshness and drift | -2.1% | Global; acute in fast-urbanizing Asia | Medium term (2 to 4 years) |
| Cross-border driving data localization | -1.8% | China, EU, Gulf states | Medium term (2 to 4 years) |
| Thermal and power budget ceilings | -1.6% | Global; severe in hot-climate markets | Medium term (2 to 4 years) |
Opportunities
Almost no current approval holder sells its homologated ADS stack to third-party manufacturers, despite UNECE 1958 Agreement mutual-recognition provisions that allow validated system dossiers to be reused across contracting parties. Mid-tier and emerging-market OEMs that cannot fund an independent assurance case represent a significant pool of unmet demand for licensed ADS technology. Per issuer annual reports, a per-vehicle royalty of USD 700 to USD 1,600 plus a recurring entitlement fee can lift blended program operating margin by an estimated 250 to 500 basis points without adding any assembly capital expenditure.
Vehicle manufacturing gross margin in the passenger segment typically runs 12% to 20% with operating margin of 4% to 8%, whereas a licensed software-plus-royalty model carries incremental gross margin near 70% to 85% once non-recurring engineering is amortized. Capturing this margin requires reference-hardware abstraction, jurisdiction-specific assurance-case templates, and shared-liability contracting. Per OECD International Transport Forum analysis, the licensees with the largest untapped potential are located precisely in markets where domestic content rules make importing a fully integrated ADS-equipped vehicle economically unviable.
| Opportunity | (~) % Potential CAGR Upside | Geographic Relevance | Execution Window |
|---|---|---|---|
| White-label ADS stack licensing to volume OEMs | +3.4% | China, ASEAN, Eastern Europe, LatAm | Medium term (2 to 4 years) |
| Fleet sensor data licensing to non-automotive verticals | +2.4% | North America, Europe, Japan | Medium term (2 to 4 years) |
| Gulf and ASEAN regulatory white space | +2.0% | GCC states, Singapore, Malaysia, Thailand | Medium term (2 to 4 years) |
| Roll-up of distressed perception and mapping suppliers | +1.8% | Europe, United States, Israel | Short term (2 years or less) |
| Residual-value and predictive maintenance services | +1.6% | North America, Western Europe | Long term (4 years or more) |
| V2X corridor co-monetization with road operators | +1.3% | China, EU TEN-T corridors, Gulf | Long term (4 years or more) |
Key Company Insights
Toyota Motor Corporation holds one of the broadest global distribution platforms among near-autonomous vehicle OEMs, giving it unmatched reach for scaling Level 2 and Level 2+ features across high-volume sedan and SUV lines. This scale advantage lowers per-unit certification and integration cost relative to smaller rivals. However, Toyota’s conservative software-first monetization posture risks ceding subscription revenue to competitors who are already activating OTA-delivered ADS entitlements on in-market fleets.
In Q2 2025, Tesla, Inc. recorded one crash for every 6.69 million miles driven with Autopilot engaged, versus one crash for every 963,000 miles without Autopilot, and a U.S. average of approximately one crash per 702,000 miles. This safety differential is Tesla’s most durable commercial argument for retaining premium pricing on its Full Self-Driving subscription. In December 2025, Momenta partnered with Mercedes-Benz Group to deploy autonomous driving technology for Lumo Mobility, signaling that third-party ADS stack licensing is becoming a viable competitive model that Tesla’s vertically integrated approach does not directly participate in.
Key Players
- Toyota Motor Corporation
- Tesla, Inc.
- BYD Company Limited
- Volkswagen Group
- Ford Motor Company
- Hyundai Motor Group
- General Motors Company
- Honda Motor Co., Ltd.
- Mercedes-Benz Group AG
- BMW Group
- Stellantis N.V.
- Nissan Motor Co., Ltd.
- Geely Auto Group
- NIO Inc.
- Chery Automobile Co., Ltd.
Recent Developments
- July 2025: BMW partnered with Momenta to deploy Momenta’s Advanced Driver Assistance Systems (ADAS) technology across BMW’s entire next-generation vehicle lineup in China.
- September 2025: Momenta and Valeo formed a strategic ADAS partnership to jointly develop and commercialize advanced driver assistance solutions for passenger vehicles.
- February 2026: Wayve raised a USD 1.2 billion Series D funding round backed by Mercedes-Benz, Stellantis, Nissan, Uber, Microsoft, and NVIDIA to accelerate deployment of its AI-powered autonomous driving software for passenger vehicles.
- January 2026: Mobileye agreed to acquire Mentee Robotics for approximately USD 900 million, strengthening its AI and embodied intelligence capabilities applicable to future autonomous driving technologies.
Geopolitical Impact Analysis
According to WTO trade monitoring data, average tariff rates on automotive components between the United States and major trading partners increased by an estimated 10 to 25 percentage points across multiple product categories from 2024 through 2026, directly raising the landed cost of imported sensors, radar modules, and ECUs. The United States government’s export controls on advanced AI compute chips, targeting nodes below 16 nanometres, limit Chinese-origin ADS compute platforms from entering North American supply chains. This bifurcates the global automation hardware market into US-aligned and China-aligned technology stacks, forcing OEMs to maintain duplicate supplier relationships and absorbing procurement overhead that compresses vehicle program operating margins.
As reported by UNCTAD, global supply chain disruption indices remained elevated through mid-2026, with average maritime transit delays for Asia-to-Europe routes running approximately 18 to 22 days above pre-2020 baselines due to Red Sea rerouting and port congestion. These delays directly affect just-in-time delivery of Vehicle-to-Everything (V2X) communication modules and solid-state sensor assemblies, which require clean-room packaging and temperature-controlled logistics. World Bank commodity price data shows that rare earth elements used in permanent magnet motors and sensor housings remained 30% to 50% above their 2019 averages through 2025, adding structural input cost pressure that falls disproportionately on BEV-based near-autonomous platforms with the highest rare-earth content per vehicle.
Report Scope
| Report Features | Description |
|---|---|
| Market Value (2025) | USD 971.3 Billion |
| Forecast Revenue (2035) | USD 35714.5 Billion |
| CAGR (2026-2035) | 43.4% |
| Base Year for Estimation | 2025 |
| Historic Period | 2020-2024 |
| Forecast Period | 2026-2035 |
| Report Coverage | Revenue Forecast, Market Dynamics, Market Opportunity Analysis, Technology and Innovation Landscape, Competitive Landscape, Recent Developments |
| Segments Covered | By Automation Level (Level 1, Level 2), By Propulsion Type (Internal Combustion Engine, Battery Electric Vehicles, Hybrid Electric Vehicles/PHEVs), By Vehicle Type (Sedans and Hatchbacks, SUVs and Crossovers), By Component Type (Hardware: Sensors, Radar, LiDAR, Cameras, ECUs; Software: Perception, Mapping, Operating Systems) |
| Regional Analysis | North America (US and Canada), Europe (Germany, France, The UK, Spain, Italy, and Rest of Europe), Asia Pacific (China, Japan, South Korea, India, Australia, and Rest of APAC), Latin America (Brazil, Mexico, and Rest of Latin America), Middle East and Africa (GCC, South Africa, and Rest of MEA) |
| Competitive Landscape | Toyota Motor Corporation, Tesla Inc., BYD Company Limited, Volkswagen Group, Ford Motor Company, Hyundai Motor Group, General Motors Company, Honda Motor Co. Ltd., Mercedes-Benz Group AG, BMW Group, Stellantis N.V., Nissan Motor Co. Ltd., Geely Auto Group, NIO Inc., Chery Automobile Co. Ltd. |
| Customization Scope | Customization for segments, region / country-level will be provided. Additional customization can be done based on requirements. |
| Purchase Options | We have three licenses to opt for: Single User License | Multi-User License (Up to 5 Users) | Corporate Use License (Unlimited User and Printable PDF) |





































