


Report Overview
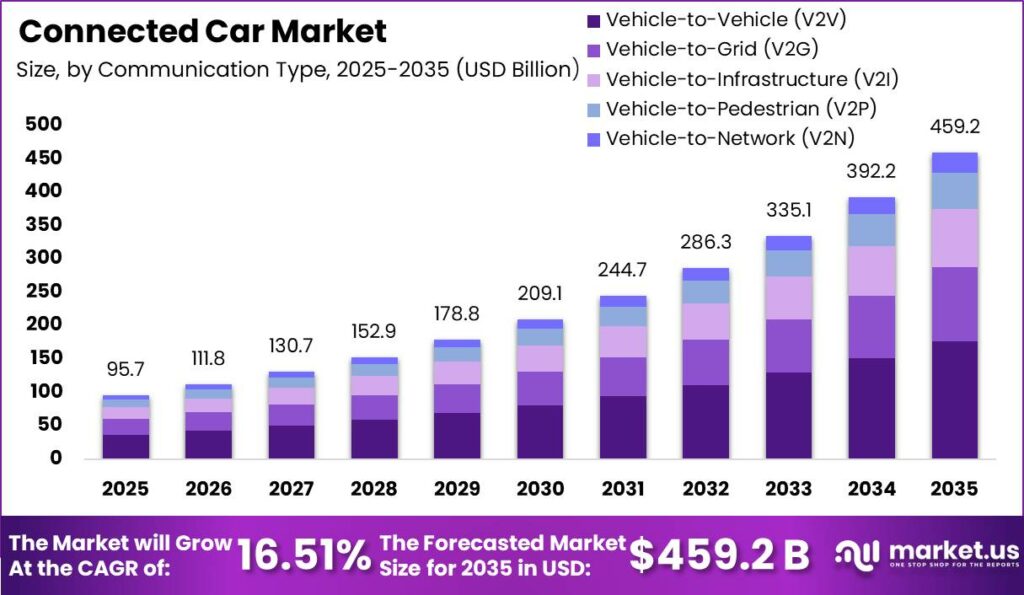
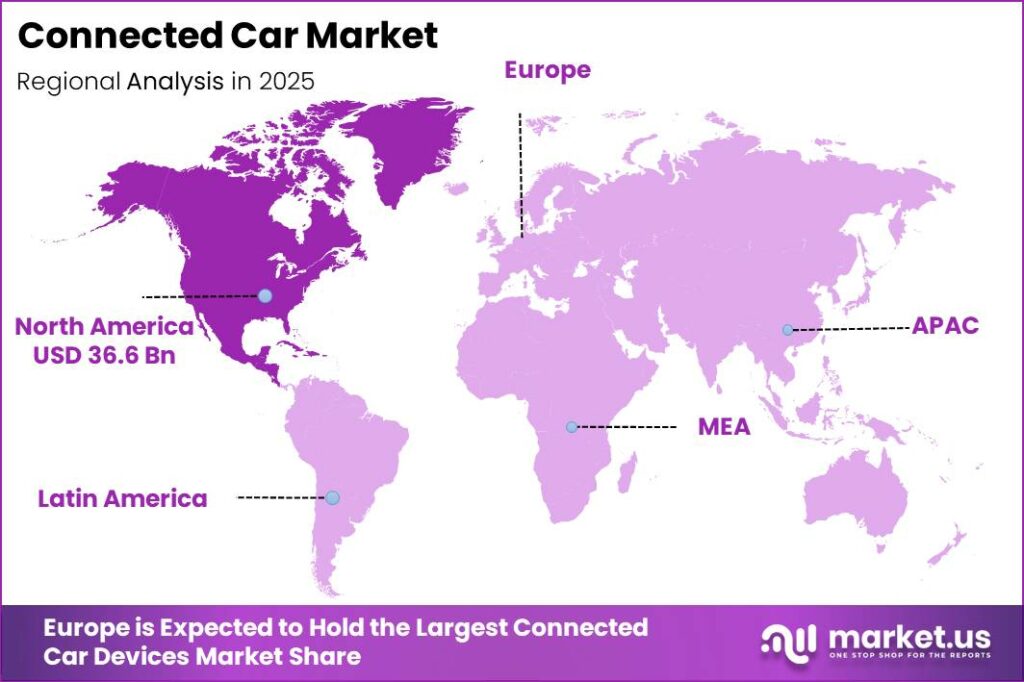
Global Connected Car Market size is expected to be worth around USD 459.2 Billion by 2035 from USD 95.7 Billion in 2025, growing at a CAGR of 16.51% during the forecast period 2026 to 2035. North America led the market in 2025 with a 38.26% share worth USD 36.61 Billion, supported by early V2X pilots and dense cellular coverage across highway corridors.
Connected car devices cover the hardware that links a vehicle to networks, other vehicles, and roadside systems. The stack includes Automotive Telematics Control Unit modules, cellular and short-range radios, gateways, and cybersecurity chips. Suppliers sell into two distinct channels. Automakers buy factory-fitted modules, while fleets and owners buy retrofit units. This split shapes pricing power across the value chain.
Key Takeaways
- Market size reached USD 95.7 Billion in 2025 and will hit USD 459.2 Billion by 2035 at a CAGR of 16.51%.
- North America dominated with a 38.26% share valued at USD 36.61 Billion in 2025.
- Vehicle-to-Vehicle communication led by type with 38.55% share.
- Driver Assistance Systems led applications with 41.00% share.
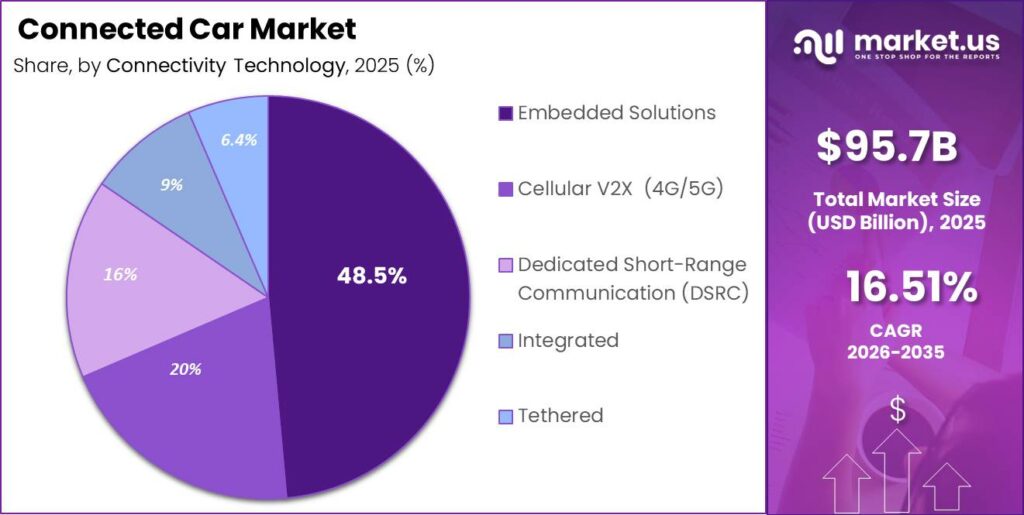
- Embedded Solutions led connectivity technology with 48.55% share.
- Internal Combustion Engine vehicles held 76.00% of propulsion demand.
- OEM channel captured 63.00% of total sales.
Government programs now fund the roadside half of the connected equation, not just the vehicle. Regulators tie network buildout to measurable safety outcomes. Connecticut DOT’s cloud-based V2I alerting system lowered collision risk with roadside workers by up to 90% and cut hard-braking events by 80%. This means public agencies can justify infrastructure budgets with hard safety math, which pulls device volumes forward.
Therefore vehicle fleets are becoming connected by default rather than by option. The global installed base stood at 362.44 million connected cars in 2024, moving toward a penetration rate near 20.53% of cars on the road. Rising penetration expands the addressable base for software services sold on top of hardware. Suppliers who own the module also own the data path.
Consolidation shows where suppliers expect margin to sit. NXP Semiconductors completed its $625 million purchase of TTTech Auto in June 2025, adding vehicle software, networking, and safety integration. As a result, buyers increasingly choose pre-integrated platforms over separate components. Growth in electric and software-defined vehicle programs raises demand for these consolidated device stacks across every price tier.
Communication Type Analysis
Vehicle-to-Vehicle dominates with 38.55% due to direct safety messaging between moving vehicles.
In 2025, Vehicle-to-Vehicle held a dominant market position in the By Communication Type segment of Connected Car Market, with a 38.55% share. According to ITU, 3 billion 5G subscriptions now exist worldwide, giving V2V radios a mature network floor to build on. Data from ITU shows 5G reaches 55% of the global population. Suppliers can scale V2V modules without waiting for new spectrum.
Vehicle-to-Grid units serve as the billing and load-control link between batteries and utilities. Figures from the IEA show electric car sales exceeded 20 million in 2025, representing more than a quarter of all cars sold. Every one of those vehicles is a candidate grid asset. This creates a fast-expanding installed base for bidirectional charging hardware and utility-grade communication units.
Vehicle-to-Infrastructure devices depend on public agencies rather than carmakers for purchase decisions. ITS America indicates that roadside deployment covers MAP message development and FCC site registration at every equipped intersection. Qualcomm completed its acquisition of Autotalks in June 2025, adding dedicated V2X chipsets to its Snapdragon Digital Chassis. This signals that chipmakers now treat infrastructure-linked demand as a core revenue line.
Vehicle-to-Network units carry cloud traffic for updates, navigation, and remote diagnostics. Based on ITU data, 36% of mobile broadband subscriptions are now 5G, which lifts available bandwidth per vehicle session. Vehicle-to-Pedestrian devices hold the remaining share alongside V2N. Vendors serving both gain leverage with carriers negotiating multi-year data contracts.
Application Analysis
Driver Assistance Systems dominates with 41.00% due to regulatory fitment across new vehicle types.
In 2025, Driver Assistance Systems held a dominant market position in the By Application segment of Connected Car Market, with a 41.00% share. As reported by OICA, global vehicle production reached 96.4 million units in 2025, up 3.9% from the prior year. Every unit built now carries more sensing and connectivity content. This lifts ADAS device revenue faster than vehicle volume alone.
Cybersecurity hardware exists because type-approval rules demand it, not because buyers request it. UNECE indicates that UN Regulation No. 155 applies to all new vehicles produced since July 2024 across EU, Japanese, and South Korean markets. Compliance requires certified secure elements inside the vehicle. Therefore suppliers with automotive-grade security silicon hold pricing power that general chipmakers cannot match.
Telematics and navigation devices earn their place through measurable fleet economics. Together for Safer Roads found that telematics programs cut crashes by 29% and reduced unsafe driving by 51% within three years. Fleet operators translate those figures directly into lower insurance premiums. This makes telematics the easiest connected device to sell on payback alone.
In-Vehicle Infotainment converts cabin screens into subscription surfaces for media and commerce. Figures from OICA show global vehicle sales climbed to 99.8 million units in 2025. Larger sales volumes widen the installed screen base each year. Suppliers who bundle infotainment with connectivity capture recurring content revenue instead of one-time hardware margin.
Connectivity Technology Analysis
Embedded Solutions dominates with 48.55% due to factory-installed cellular modules inside vehicles.
In 2025, Embedded Solutions held a dominant market position in the By Connectivity Technology segment of Connected Car Market, with a 48.55% share. Ericsson indicates that 660 million 5G subscriptions were added globally during 2025. Embedded modules capture that capacity automatically at build time. This means automakers control the data relationship rather than handing it to a phone.
Cellular V2X depends on carrier network quality in the vehicle’s home market. Data from Ericsson shows North American 5G penetration reached 79%, the highest of any region. High penetration removes the coverage excuse for latency-sensitive features. Consequently suppliers should launch C-V2X-equipped trims in North America first to prove the technology commercially.
Dedicated Short-Range Communication units serve legacy pilot deployments and specific transit corridors. The FCC’s 5.9 GHz band reallocation order moved the safety spectrum allocation toward cellular-based technology. Agencies with installed DSRC assets now face migration decisions. This creates a replacement cycle that favors dual-mode roadside equipment vendors over single-protocol suppliers.
Integrated and Tethered approaches split the difference between built-in and phone-based connectivity. World Bank data shows mobile cellular subscriptions per 100 people exceed 100 in most middle-income countries. Widespread handset ownership keeps tethered options viable in price-sensitive markets. Vendors serving those markets protect volume where embedded modules remain too costly.
Vehicle Propulsion Analysis
Internal Combustion Engine dominates with 76.00% due to the vast existing global vehicle fleet.
In 2025, Internal Combustion Engine held a dominant market position in the By Vehicle Propulsion segment of Connected Car Market, with a 76.00% share. As reported by OICA, Asia-Pacific production rose 7.6% to roughly 59.2 million vehicles, more than 61% of global output. Most of that output remains combustion powered. Suppliers cannot abandon ICE-compatible module lines yet.
Electric Vehicles carry richer electronic architectures that demand more connectivity content per unit. OICA found that China’s new-energy vehicle production reached 16.626 million units in 2025, up 29%. Each unit needs battery telemetry, charging authentication, and thermal data links. This raises average device value per vehicle well above combustion equivalents.
Battery Electric Vehicles anchor the charging-network communication layer through authentication and payment handshakes. IEA data shows global electric car stock has grown to more than 58 million vehicles on the road. Charging session data flows through the vehicle’s connected device. Vendors owning that handshake gain a defensible position in energy services.
Hybrid Electric, Plug-in Hybrid, and Fuel-cell Electric Vehicles hold the remaining propulsion share collectively. OICA indicates India’s production rose to 6.49 million vehicles in 2025, with hybrids taking a growing share of passenger sales. Mixed powertrain lineups force suppliers to support multiple architectures. Flexible module platforms therefore beat single-powertrain designs on total program cost.
Sales Channel Analysis
OEM dominates with 63.00% due to factory fitment during vehicle assembly lines.
In 2025, OEM held a dominant market position in the By Sales Channel segment of Connected Car Market, with a 63.00% share. Based on OICA data, the United States produced 10.24 million vehicles and sold 16.7 million in 2025. Factory fitment locks suppliers into multi-year platform contracts. This gives OEM-channel vendors revenue visibility that aftermarket sellers lack.
Aftermarket devices retrofit connectivity into vehicles that left the factory without it. OICA indicates European production slipped 0.8% to 17.2 million units while sales fell 0.4% to 18.63 million. Slower replacement means older cars stay on roads longer. Consequently retrofit demand rises exactly where new-build volumes weaken.
Fleet operators drive most aftermarket purchasing through insurance and compliance requirements. Figures from OICA show India recorded over 1 million truck and bus sales in fiscal year 2025-26. Commercial operators buy telematics per vehicle, not per platform. This makes fleets the fastest route to volume for suppliers without OEM design wins.
Key Market Segments
By Communication Type
- Vehicle-to-Vehicle (V2V)
- Vehicle-to-Grid (V2G)
- Vehicle-to-Infrastructure (V2I)
- Vehicle-to-Pedestrian (V2P)
- Vehicle-to-Network (V2N)
By Application
- Driver Assistance Systems (ADAS)
- Cybersecurity Hardware
- Telematics & Navigation
- In-Vehicle Infotainment
By Connectivity Technology
- Embedded Solutions
- Cellular V2X (4G/5G)
- Dedicated Short-Range Communication (DSRC)
- Integrated
- Tethered
By Vehicle Propulsion
- Internal Combustion Engine (ICE)
- Electric Vehicles
- Battery Electric Vehicle
- Hybrid Electric Vehicle
- Fuel-cell Electric Vehicle
- Plug-in Hybrid Electric Vehicle
By Sales Channel
- OEM
- Aftermarket
Regional Analysis
North America Dominates the Connected Car Market with a Market Share of 38.26%, Valued at USD 36.61 Billion
North America controlled 38.26% of the market in 2025, worth USD 36.61 Billion. Public agencies here fund working V2I deployments rather than studies. A connected school-bus signal-priority application in Alpharetta, Georgia produced a 40% decrease in stops, a 13% reduction in travel time, and an 18% increase in speed. Measurable results like these unlock repeat municipal orders across neighbouring states.
Asia Pacific is the fastest-growing region as carriers and carmakers build together. Cisco and TELUS introduced new 5G standalone network capabilities in October 2025 to support testing of a major vehicle manufacturer’s connected-car system. Similar carrier partnerships now anchor regional rollouts. This means suppliers must win carrier relationships, not only OEM contracts, to secure design placement.
Europe, Latin America, and the Middle East and Africa hold the balance of the remaining 61.74% share. Europe leads on mandated cybersecurity fitment, while Latin America and MEA lean on retrofit demand. Regional rules differ sharply on data handling. Therefore vendors need configurable software stacks to sell the same hardware across all three regions.
Key Regions and Countries
North America
- US
- Canada
Europe
- Germany
- France
- The UK
- Spain
- Italy
- Rest of Europe
Asia Pacific
- China
- Japan
- South Korea
- India
- Australia
- Rest of APAC
Latin America
- Brazil
- Mexico
- Rest of Latin America
Middle East and Africa
- GCC
- South Africa
- Rest of MEA
Market Dynamics
Market Opportunity Analysis - Underserved communication types, retrofit channels and lagging regions offer the clearest entry points
Vehicle-to-Grid sits far behind V2V’s 38.55% share despite serving the fastest-growing propulsion segment. Utilities and automakers have not agreed on who owns the bidirectional interface. This creates a standards vacuum that a focused vendor can fill. Investors backing V2G hardware now buy into a segment with no entrenched incumbent controlling the specification.
The aftermarket channel holds only 37.00% of sales against OEM’s 63.00%, yet it reaches vehicles that factory fitment can never touch. Retrofit buyers decide quickly and pay per unit rather than per platform. Instead of chasing multi-year OEM design cycles, new entrants can generate revenue within months. This shortens payback for smaller balance sheets.
Roadside infrastructure remains underbuilt relative to vehicle-side devices. ITS America estimates connected-vehicle roadside deployment at $7,000 to $15,000 per intersection, covering MAP message development and FCC site registration. Municipal budgets move slowly at that price point. Therefore vendors offering financed or managed-service roadside units can unlock orders that outright hardware sales cannot.
Latin America and the Middle East and Africa share the tail of the 61.74% non-North American market. Neither region carries mandated cybersecurity fitment yet, so embedded penetration stays low. This means demand concentrates in low-cost tethered and retrofit formats. Early entrants who build distribution now hold the channel when regulation eventually arrives.
Technology and Innovation Landscape - Telemetry analytics, driver-behaviour data and V2I alerting reshape how device value is proven
Large-scale telemetry analytics has replaced small pilot studies as the proof standard for connected devices. A 2026 peer-reviewed study in Vehicles analysed more than 8.5 million connected-vehicle telemetry records from Drivewyze against roughly 45,000 police-reported crashes. Researchers used harsh-braking events as a crash surrogate. This gives suppliers a defensible metric to sell devices on safety performance rather than features.
Behaviour-change analytics now anchor commercial telematics value. Together for Safer Roads indicates that analysed programs cut crashes by 29% on average and reduced unsafe driving by 51% within three years of deployment. Fleet buyers convert those numbers into insurance and downtime savings. Therefore vendors bundling coaching software with hardware command higher contract values than hardware-only sellers.
Infrastructure-to-pedestrian alerting extends device value beyond the vehicle occupant. USDOT reports that connected-vehicle pedestrian crossing warning systems on 24 equipped buses cut driver reaction time by 19%, from 1.6 seconds to 1.3 seconds. Transit agencies buy on that measurable margin. This opens a public-fleet procurement channel that runs independently of consumer vehicle cycles.
Drivers
Regulation now hardwires connectivity into every new vehicle type, turning connected devices from an option into a compliance part. UNECE WP.29 records show UN Regulation No. 155 has applied to new EU, Japanese, and South Korean vehicle types since July 2022 and to all new vehicles produced since July 2024. The rule demands a certified cybersecurity management system and secure over-the-air capability. Both require a permanent embedded telematics unit.
This pushes embedded module attach rates toward universal fitment on regulated fleets. With the average vehicle now carrying more than 1,700 semiconductor chips per Auto Innovators tracking, connectivity content rises structurally. As a result, OEM economics shift from one-time hardware sales toward recurring service revenue. GM recognised $2.7 billion in connected-services revenue in 2025. The 07 July 2026 UN R155 milestone closes any window for non-connected trims.
| Driver | (~) % Impact on CAGR Forecast | Geographic Relevance | Impact Timeline |
|---|---|---|---|
| Mandatory embedded telematics & safety connectivity | +3.4% | EU, Japan, South Korea, North America | Short term (2 years or less) |
| 5G/C-V2X network module penetration | +2.6% | North America, China, Western Europe | Medium term (2 to 4 years) |
| EV electronic architecture proliferation | +2.2% | China, EU, North America | Medium term (2 to 4 years) |
| OEM connected-services subscription rollout | +1.8% | North America, Western Europe | Short term (2 years or less) |
| OTA update dependency across ECUs | +1.5% | Global | Medium term (2 to 4 years) |
| Insurance telematics & UBI adoption | +1.1% | North America, EU, India | Long term (4 years or more) |
Restraints
Automotive semiconductor fragility caps how many connected devices factories can build, whatever end demand looks like. Connected control units rely heavily on mature-node microcontrollers and RF chips with structurally tight foundry capacity. Auto Innovators assessments through 2025 show carmakers still report sporadic component tightness despite headline recovery. This means production planning, not marketing, sets the ceiling on connected trim availability.
Tariff actions and geopolitical friction reprice these inputs further, as renewed shortage warnings from April 2025 confirmed. OEMs respond by prioritising higher-margin trims and delaying connectivity-rich configurations. Consequently Tier-1 suppliers absorb spot-buy premiums and defer CapEx on new module lines. The 2021 shortage documented in McKinsey analysis pushed the industry toward safety-stock buffers that still raise working-capital intensity today.
| Restraint | (~) % Impact on CAGR Forecast | Geographic Relevance | Impact Timeline |
|---|---|---|---|
| Automotive-grade semiconductor scarcity | -2.8% | Global | Short term (2 years or less) |
| Elevated interest rates suppressing vehicle sales | -2.1% | North America, EU, emerging markets | Short term (2 years or less) |
| Semiconductor & module tariff escalation | -1.6% | North America, China | Short term (2 years or less) |
| Consumer connected-service subscription resistance | -1.3% | North America, Western Europe | Medium term (2 to 4 years) |
| Cybersecurity type-approval compliance cost | -1.0% | EU, Japan, South Korea | Medium term (2 to 4 years) |
Challenges
The shortage of embedded software, cybersecurity, and V2X integration engineers slows the market’s growth ceiling without freezing current shipments. UN R155 and its software-update companion UN R156 oblige every manufacturer to staff a continuously operating cybersecurity management system across the vehicle lifecycle. The mobility workforce is transitioning slower than device complexity rises. NITI Aayog skilling assessments show India’s EV penetration reached only 7.66% in 2024 against a global rate of 16.48%.
This friction appears as longer development cycles and higher per-unit engineering overhead. Auto Innovators data notes dozens of networked ECUs per vehicle alongside the chip count, which throttles validation and certification speed. Therefore firms build in-house software academies, captive engineering centres, and partnership sourcing. The staffing gap itself creates a paid services market for certification, testing, and compliance vendors ahead of the 07 July 2026 cutoff.
| Challenge | (~) % CAGR Friction Drag | Geographic Relevance | Mitigation Horizon |
|---|---|---|---|
| Automotive software talent deficit | -1.9% | Global | Long term (4 years or more) |
| Fragmented connectivity standards interoperability | -1.4% | Global | Medium term (2 to 4 years) |
| Data privacy regulatory divergence | -1.2% | EU, North America, China | Medium term (2 to 4 years) |
| Legacy 2G/3G network sunset migration | -1.0% | North America, EU, APAC | Medium term (2 to 4 years) |
| Multi-tier supply chain visibility gaps | -0.8% | Global | Long term (4 years or more) |
Opportunities
Monetising anonymised telemetry, diagnostic, and behavioural data through structured marketplaces is the largest untapped space in this market. Today the embedded device sells for compliance and basic services, while the data-as-a-service layer stays largely uncommercialised. Ericsson estimates place the global connected fleet at roughly 400 million units. Only GM among Western automakers reported meaningful connected-services revenue at $2.7 billion, exposing a wide gap between deployed hardware and captured value.
The unit economics shift decisively because data services, insurance-telematics feeds, and smart-city aggregation carry gross margins far above module assembly. Blended per-vehicle lifetime margin could expand by an estimated 15% to 25% once connectivity hardware is already fitted. This creates a near-zero incremental cost per data point. Early movers who solve privacy-compliant governance across EU and North American frameworks convert a sunk compliance cost into an annuity.
| Opportunity | (~) % Potential CAGR Upside | Geographic Relevance | Execution Window |
|---|---|---|---|
| Anonymized vehicle-data marketplace monetization | +2.9% | North America, EU, China | Medium term (2 to 4 years) |
| Roadside & infrastructure V2X unit buildout | +2.3% | North America, EU | Long term (4 years or more) |
| Emerging-market aftermarket retrofit devices | +1.7% | India, Southeast Asia, LATAM, Africa | Long term (4 years or more) |
| In-vehicle payments & commerce integration | +1.4% | North America, Western Europe | Medium term (2 to 4 years) |
| Fleet & commercial telematics roll-up M&A | +1.2% | North America, EU | Medium term (2 to 4 years) |
Key Company Insights
Continental AG holds a measurable technical lead in direct vehicle communication. Its C-V2X field trials achieved average latency of 11 milliseconds for vehicle-to-vehicle links, a benchmark reaffirmed in 2025 and 2026 technical comparisons. Low latency wins safety-critical design slots that competitors cannot bid for. However, this depends on carrier network readiness in each launch market.
Denso Corporation competes on cost-per-unit discipline across high-volume programs, where connected on-board unit hardware ranges from $600 to $2,800 per unit. Manufacturing scale lets Denso defend the lower end of that band. This positioning protects volume share in price-sensitive vehicle tiers. The risk sits in thinner margins if premium software-defined features move value away from hardware.
Key Players
- Continental AG
- Denso Corporation
- Robert Bosch GmbH
- Autoliv Inc.
- Valeo SA
- Harman International
- AT&T
- Daimler AG
- Audi
- TomTom Inc.
- General Motors
- Ford Motor Company
- Hyundai Motor Group
Recent Developments
- January 2025: NXP Semiconductors agreed to acquire TTTech Auto for $625 million to add MotionWise safety-critical middleware to the CoreRide platform for software-defined and connected vehicles.
- August 2025: Infineon Technologies completed the $2.5 billion acquisition of Marvell’s Automotive Ethernet business, including the Brightlane portfolio for high-speed in-vehicle networking.
- December 2025: HARMAN International agreed to acquire ZF Group’s advanced driver-assistance systems business for €1.5 billion, adding automotive cameras, radar systems and computing platforms.
Geopolitical Impact Analysis
Trade friction now sets input costs for connected car devices as much as chip supply does. According to WTO, global merchandise trade growth forecasts were cut sharply as tariff measures spread across technology goods in 2025. UNCTAD reports that trade-restrictive measures affected a rising share of world imports. Semiconductors and RF modules sit directly in scope. This raises landed module costs for North American assembly plants.
Shipping reroutes and energy volatility compound the pressure. As reported by the World Shipping Council, Red Sea diversions added roughly 10 to 14 days to Asia-Europe transit times, delaying electronics inbound to European plants. IEA data shows continued oil price volatility through the same period, lifting freight and resin costs. Consequently suppliers carry more inventory and price connected modules with wider contingency margins.
Report Scope
| Report Features | Description |
|---|---|
| Market Value (2025) | USD 95.7 Billion |
| Forecast Revenue (2035) | USD 459.2 Billion |
| CAGR (2026-2035) | 16.51% |
| Base Year for Estimation | 2025 |
| Historic Period | 2020-2024 |
| Forecast Period | 2026-2035 |
| Report Coverage | Revenue Forecast, Market Dynamics, Market Opportunity Analysis, Technology and Innovation Landscape, Competitive Landscape, Recent Developments |
| Segments Covered | By Communication Type (Vehicle-to-Vehicle (V2V), Vehicle-to-Grid (V2G), Vehicle-to-Infrastructure (V2I), Vehicle-to-Pedestrian (V2P), Vehicle-to-Network (V2N)), By Application (Driver Assistance Systems (ADAS), Cybersecurity Hardware, Telematics & Navigation, In-Vehicle Infotainment), By Connectivity Technology (Embedded Solutions, Cellular V2X (4G/5G), Dedicated Short-Range Communication (DSRC), Integrated, Tethered), By Vehicle Propulsion (Internal Combustion Engine (ICE), Electric Vehicles (Battery Electric Vehicle, Hybrid Electric Vehicle, Fuel-cell Electric Vehicle, Plug-in Hybrid Electric Vehicle)), By Sales Channel (OEM, Aftermarket) |
| Regional Analysis | North America (US and Canada), Europe (Germany, France, The UK, Spain, Italy, and Rest of Europe), Asia Pacific (China, Japan, South Korea, India, Australia, and Rest of APAC), Latin America (Brazil, Mexico, and Rest of Latin America), Middle East and Africa (GCC, South Africa, and Rest of MEA) |
| Competitive Landscape | Continental AG, Denso Corporation, Robert Bosch GmbH, Autoliv Inc., Valeo SA, Harman International, AT&T, Daimler AG, Audi, TomTom Inc., General Motors, Ford Motor Company, Hyundai Motor Group |
| Customization Scope | Customization for segments, region / country-level will be provided. Additional customization can be done based on requirements. |
| Purchase Options | We have three licenses to opt for: Single User License | Multi-User License (Up to 5 Users) | Corporate Use License (Unlimited User and Printable PDF) |





































