
Quick Navigation
- Report Overview
- Key Takeaways
- Product Type Analysis
- Technology Analysis
- Application Analysis
- End-User Analysis
- Key Segments Analysis
- Market Dynamics
- Market Restraints
- Market Opportunities
- Impact of macroeconomic factors / Geopolitical factors
- Latest Trends
- Regional Analysis
- Key Players Analysis
- Recent Developments
- Report Scope
Report Overview
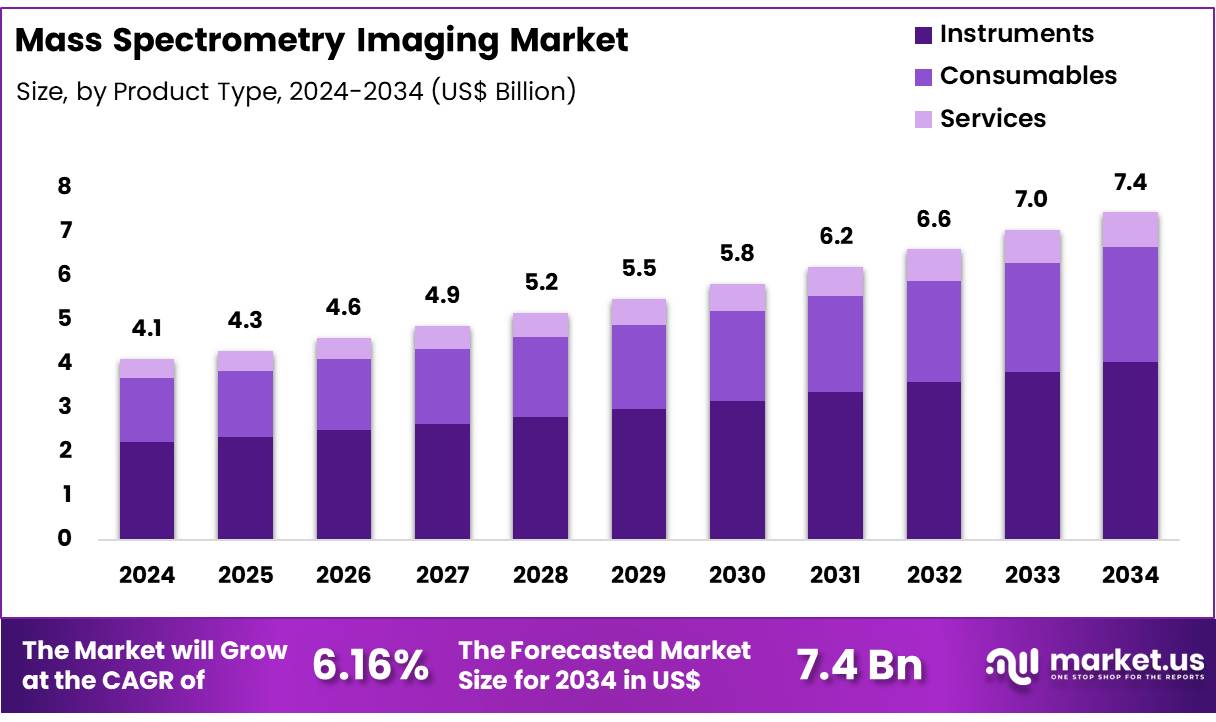
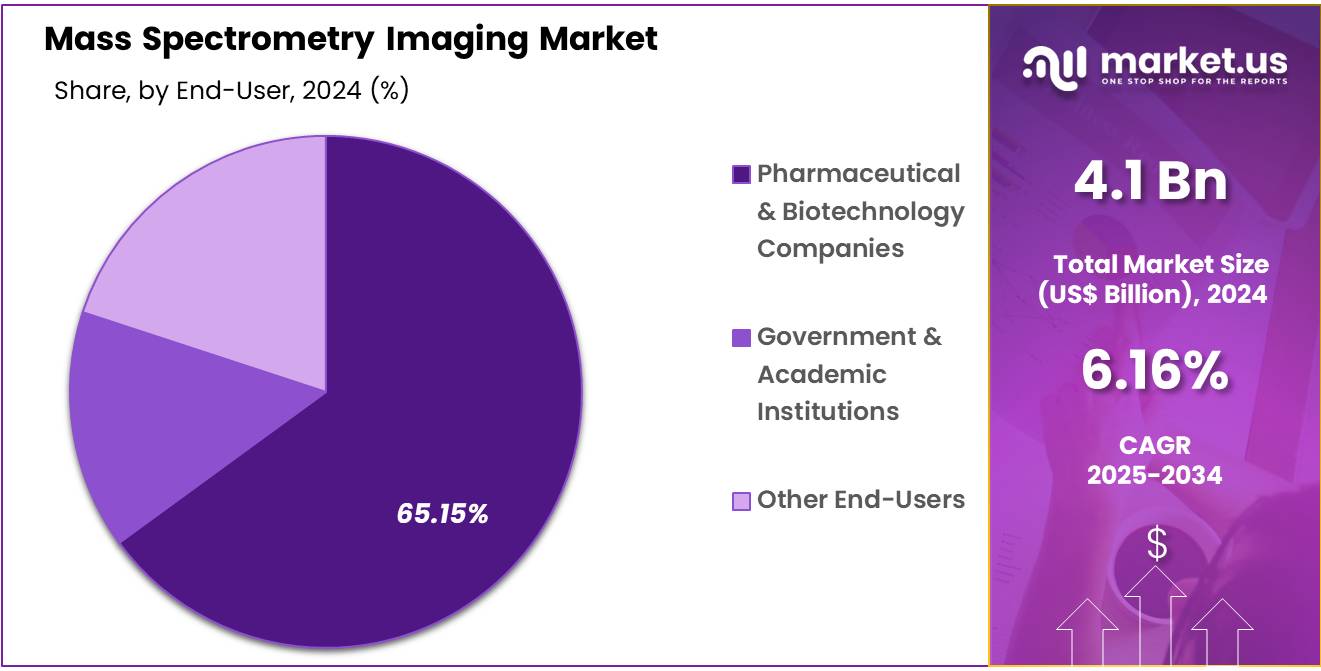
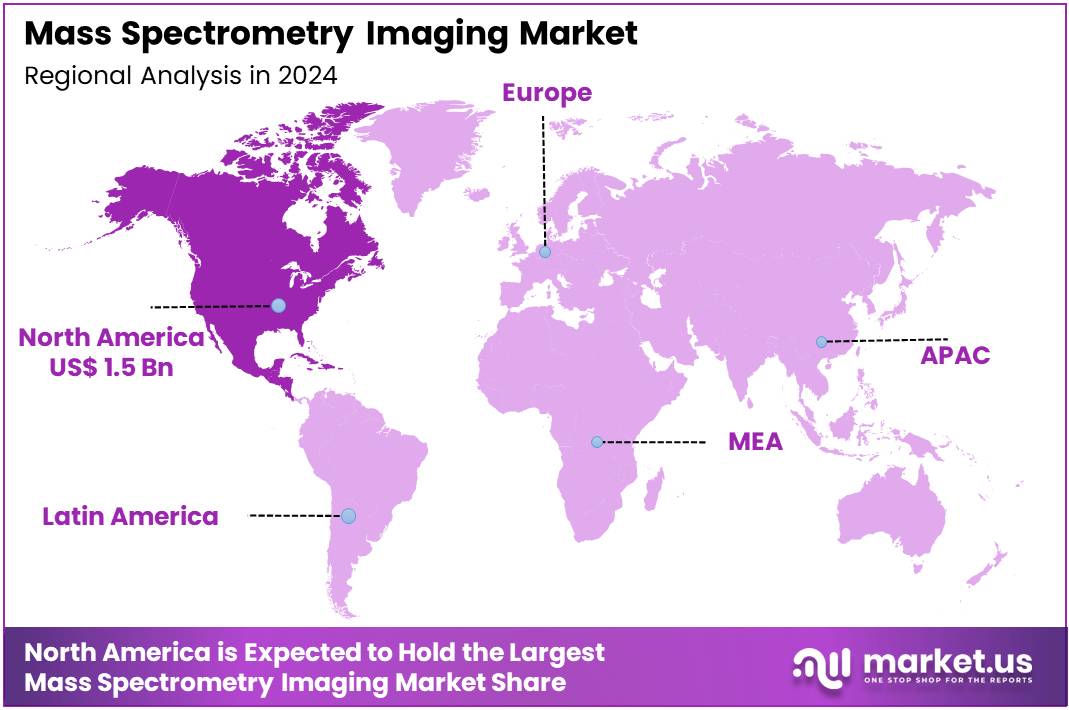
Global Mass Spectrometry Imaging Market was valued at US$ 4.1 Billion in 2024 and is expected to grow at a CAGR of 6.16% from 2024 to 2034. In 2024, North America led the market, achieving over 37.35% share with a revenue of US$ 1.5 Billion.
Mass Spectrometry Imaging Market, Global Analysis, 2020-2024 (US$ Billion)
| Global | 2020 | 2021 | 2022 | 2023 | 2024 | CAGR |
|---|---|---|---|---|---|---|
| Revenue | 3.0 | 3.4 | 3.7 | 3.9 | 4.1 | 6.16% |
Mass spectrometry imaging (MSI) is a powerful analytical technique that enables spatially resolved chemical analysis of samples. By combining mass spectrometry with imaging technology, MSI allows for the visualization and mapping of molecular distributions within tissues, cells, or other materials. In this method, a sample is irradiated with a laser or an ion beam, and the resulting ions are analyzed based on their mass-to-charge ratios.
The data generated provides detailed information on the distribution of different molecules, such as proteins, lipids, and metabolites, across the sample. This capability is invaluable in various fields, including medical research, where MSI helps in understanding disease mechanisms, identifying biomarkers, and exploring drug interactions.
The high spatial resolution and ability to analyze complex biological systems make MSI a crucial tool for advancing scientific knowledge and improving clinical diagnostics. The continuous evolution of mass spectrometry technology is a significant driver.
Innovations such as high-resolution mass spectrometry (HRMS), tandem mass spectrometry (MS/MS), and improvements in sensitivity and accuracy are enhancing the capabilities of mass spectrometry. These advancements support a wide range of applications, from drug development and biomarker discovery to clinical diagnostics and personalized medicine.
- November 2021- Thermo Fisher Scientific Inc. launched new-generation mass spectrometry instruments, workflows and software. The Thermo Scientific Orbitrap Exploris MX mass detector enables biopharmaceutical laboratories to seamlessly implement multi-attribute methods (MAM) and conduct intact analysis of monoclonal antibodies, determine oligonucleotide mass, and perform peptide mapping.
Key Takeaways
- The global mass spectrometry imaging market was valued at USD 4.1 billion in 2024 and is anticipated to register substantial growth of USD 7.4 billion by 2034, with 6.16% CAGR.
- In 2024, the instruments segment took the lead in the global market, securing 54.39% of the total revenue share.
- The Matrix-Assisted Laser segment took the lead in the global market, securing 35.13% of the total revenue share.
- The proteomics segment took the lead in the global market, securing 41.16% of the total revenue share.
- The pharmaceutical & biotechnology companies segment took the lead in the global market, securing 65.15% of the total revenue share.
- North America maintained its leading position in the global market with a share of over 37.35% of the total revenue.
Product Type Analysis
Based on product type the market is fragmented into instruments, consumables, and services. Amongst these, instruments dominated the global mass spectrometry imaging market capturing a significant market share of 54.39% in 2024. The growth of the instruments segment in Mass Spectrometry Imaging (MSI) has been driven by technological advancements and increasing applications across various fields, including biomedical research, pharmaceuticals, and materials science.
Over the past decade, the development of more sophisticated and versatile mass spectrometry (MS) instruments has significantly enhanced the capabilities of MSI, leading to its broader adoption and growth. Innovations such as high-resolution and high-mass accuracy instruments have greatly enhanced the sensitivity and precision of MSI.
For example, advancements in quadrupole and time-of-flight (TOF) mass analyzers have enabled the detection of a wider range of molecular species with greater detail, facilitating more comprehensive analyses of complex biological samples and materials.
- For instance, In June 2022, Agilent Technologies, Inc. launched new LC/MS and GC/MS quadrupole mass spectrometers. The Agilent 6475 triple quadrupole LC/MS system and 5977C GC/MSD, represent the latest revolution in Agilent’s 50-plus year history in mass spectrometry. The new LC/TQ and GC/TQ products offer built-in instrument intelligence to simplify lab operations.
Mass Spectrometry Imaging Market, Product Type Analysis, 2020-2024 (US$ Billion)
| Product Type | 2020 | 2021 | 2022 | 2023 | 2024 |
|---|---|---|---|---|---|
| Instruments | 1.6 | 1.9 | 2.0 | 2.1 | 2.2 |
| Consumables | 1.2 | 1.4 | 1.5 | 1.6 | 1.7 |
| Services | 0.1 | 0.2 | 0.2 | 0.2 | 0.2 |
Technology Analysis
The market is fragmented by technology into Matrix-Assisted Laser Desorption/Ionization (MALDI), Secondary Ion Mass Spectrometry (SIMS), Desorption Electrospray Ionization (DESI), Magnetic Sector Mass Spectrometry, Time-of-Flight Mass Spectrometry (TOFMS), and Other Technologies. Matrix-Assisted Laser dominated the global mass spectrometry imaging market capturing a significant market share of 35.13% in 2024.
The Matrix-assisted Laser Desorption/Ionization (MALDI) technology segment within the Mass Spectrometry Imaging (MSI) market is experiencing significant growth, driven by its broad applicability and continued advancements. MALDI, a pivotal ionization technique in MSI, has revolutionized the way complex biological and chemical samples are analyzed, leading to its increasing adoption across various research and industrial sectors.
Mass Spectrometry Imaging Market, Technology Analysis, 2020-2024 (US$ Billion)
| Technology | 2020 | 2021 | 2022 | 2023 | 2024 |
|---|---|---|---|---|---|
| Matrix-Assisted Laser Desorption/Ionization (MALDI) | 1.1 | 1.2 | 1.3 | 1.4 | 1.4 |
| Secondary Ion Mass Spectrometry (SIMS) | 0.7 | 0.8 | 0.8 | 0.9 | 0.9 |
| Desorption Electrospray Ionization (DESI) | 0.6 | 0.6 | 0.7 | 0.7 | 0.8 |
| Magnetic Sector Mass Spectrometry | 0.4 | 0.4 | 0.4 | 0.5 | 0.5 |
| Time-of-Flight Mass Spectrometry (TOFMS) | 0.2 | 0.2 | 0.2 | 0.2 | 0.2 |
| Other Technologies | 0.2 | 0.2 | 0.2 | 0.3 | 0.3 |
Application Analysis
The market is fragmented by application into proteomics, metabolomics, glycomics, and other applications. Proteomics dominated the global mass spectrometry imaging market capturing a significant market share of 41.16% in 2024. Mass spectrometry-based proteomics has become a cornerstone in the quantitative analysis of proteins, enabling researchers to gain deep insights into protein expression levels, modifications, and interactions. This technique facilitates a comprehensive understanding of protein functions, structures, and dynamics by providing detailed profiles of proteins in various biological samples.
Recent advancements in quantitative proteomics workflows, including enhanced sensitivity and accuracy, have expanded the scope of this research, allowing for more precise investigations into protein functions and their roles in disease mechanisms. Further, the ability to map protein-protein interactions and study post-translational modifications has been crucial in uncovering the complexities of cellular processes and disease states.
This detailed molecular analysis not only advances fundamental biological research but also supports the development of novel diagnostic and therapeutic strategies, driving personalized medicine forward. The significant revenue share of the proteomics segment underscores its pivotal role in leveraging mass spectrometry for transformative healthcare applications.
Mass Spectrometry Imaging Market, Application Analysis, 2020-2024 (US$ Billion)
| Application | 2020 | 2021 | 2022 | 2023 | 2024 |
|---|---|---|---|---|---|
| Proteomics | 1.2 | 1.4 | 1.5 | 1.6 | 1.7 |
| Metabolomics | 0.8 | 0.9 | 1.0 | 1.0 | 1.1 |
| Glycomics | 0.5 | 0.6 | 0.7 | 0.7 | 0.7 |
| Other Applications | 0.4 | 0.5 | 0.5 | 0.6 | 0.6 |
End-User Analysis
The market is fragmented by end-user into pharmaceutical & biotechnology companies, government & academic institutions, and other end-users. Pharmaceutical & biotechnology companies dominated the global mass spectrometry imaging market capturing a significant market share of 65.15% in 2024. The government research and academic institutes segment represents a significant and dynamic end-user category within the global Mass Spectrometry Imaging (MSI) market.
These institutions are at the forefront of scientific research and innovation, utilizing MSI for its ability to provide detailed, spatially resolved molecular information essential for advancing various fields of study. The segment’s growth is driven by several factors, including increased funding for scientific research, the demand for cutting-edge analytical technologies, and the need for high-resolution molecular insights in diverse research areas.
Government research institutions and academic institutes are major adopters of MSI due to their focus on fundamental research and development. MSI’s high spatial resolution and sensitivity enable researchers to explore complex biological processes and gain insights into molecular interactions at unprecedented levels.
For example, in biomedical research, MSI is employed to study the spatial distribution of biomolecules in tissues and organs. This capability is invaluable for understanding disease mechanisms, such as how cancer cells interact with surrounding tissues or how neurodegenerative diseases alter brain chemistry. The detailed molecular maps provided by MSI can lead to the discovery of new biomarkers and therapeutic targets, significantly advancing the field of personalized medicine.
Mass Spectrometry Imaging Market, End-User Analysis, 2020-2024 (US$ Billion)
| End-User | 2020 | 2021 | 2022 | 2023 | 2024 |
|---|---|---|---|---|---|
| Pharmaceutical & Biotechnology Companies | 1.9 | 2.2 | 2.4 | 2.6 | 2.7 |
| Government & Academic Institutions | 0.8 | 0.9 | 0.9 | 1.0 | 1.1 |
| Other End-Users | 0.3 | 0.3 | 0.4 | 0.4 | 0.4 |
Key Segments Analysis
Product Type
- Instruments
- Consumables
- Services
Technology
- Matrix-Assisted Laser Desorption/Ionization (MALDI)
- Secondary Ion Mass Spectrometry (SIMS)
- Desorption Electrospray Ionization (DESI)
- Magnetic Sector Mass Spectrometry
- Time-of-Flight Mass Spectrometry (TOFMS)
- Other Technologies
Application
- Proteomics
- Metabolomics
- Glycomics
- Other Applications
End-User
- Pharmaceutical & Biotechnology Companies
- Government & Academic Institutions
- Other End-Users
Market Dynamics
Increasing Prevalence of Chronic Disease
This technology can identify and map biomarkers associated with atherosclerosis, myocardial infarction, and other cardiovascular conditions. By visualizing the spatial distribution of these biomarkers, MSI helps in understanding disease mechanisms and progression, potentially leading to the development of novel diagnostic markers and therapeutic targets.
- According to WHO, Noncommunicable diseases (NCDs), including cancer, heart disease, stroke, diabetes, and chronic lung disease, are together responsible for 74% of all deaths globally.
- According to NCBI, about 21% of the elderly population in India have reported at least one chronic disease. Additionally, 17% of the elderly population in rural areas and 29% in urban areas suffer from a chronic disease.
Market Restraints
High-Cost of Instruments
The high cost of mass spectrometry imaging (MSI) instruments is a significant factor restraining the growth of the MSI market, posing challenges for widespread adoption and utilization. MSI systems, known for their ability to provide detailed molecular imaging of tissues and biological samples, often come with substantial price tags due to their advanced technology, precision components, and complex manufacturing processes.
The price for a mass spectrometer can range from several thousand to over US$ 1 Mn. These high costs can be a barrier for many potential users, including smaller research institutions, hospitals, and laboratories, which may lack the financial resources to invest in such sophisticated equipment. The expense of MSI instruments not only encompasses the initial purchase but also includes ongoing costs related to maintenance, calibration, and operation.
Market Opportunities
Technological Innovations
Technological innovations are significantly creating new growth opportunities in the mass spectrometry imaging (MSI) market by enhancing the capabilities, efficiency, and applications of the technology. Advances in MSI technology, including improvements in sensitivity, resolution, and speed, are driving its adoption across various fields.
For instance, innovations such as high-resolution mass spectrometers and advanced ionization techniques enable MSI to achieve unprecedented detail in molecular imaging, allowing for more accurate and comprehensive analysis of complex biological samples. The increase in technologically advanced product launches is a major driver of growth in the mass spectrometry imaging market.
As companies introduce cutting-edge MSI systems with enhanced features, they address a range of needs across research and clinical settings, fueling market expansion. These new products often incorporate the latest advancements in sensitivity, resolution, and imaging speed, enabling more detailed and accurate molecular analysis.
- For instance, in June 2020, Shimadzu Corporation, a biotechnology research company launched its LCMS-8060NX liquid chromatograph mass spectrometer in Japan. The newly launched LCMS-8060NX is a highly advanced mass spectrometry system that allows for precise and accurate qualitative and quantitative analysis.
Impact of macroeconomic factors / Geopolitical factors
Macroeconomic and geopolitical factors significantly influence the mass spectrometry (MS) imaging market. Economic growth drives investment in research and development, particularly in healthcare, pharmaceuticals, and environmental sectors, where MS imaging plays a crucial role. In periods of economic downturn, reduced budgets for research may slow market expansion.
Geopolitical factors, such as trade policies, regulatory changes, and international collaborations, can either facilitate or hinder the market. For instance, trade tensions may impact the global supply chain of critical MS components, leading to increased costs. Additionally, international collaborations on healthcare and scientific research can drive demand for advanced analytical techniques like MS imaging.
Latest Trends
The mass spectrometry (MS) imaging market is experiencing several key trends including the increasing demand for high-resolution imaging techniques, driven by advancements in technology that enable detailed molecular analysis in biological and clinical research. This has led to the rise of novel approaches like MALDI (Matrix-Assisted Laser Desorption/Ionization) imaging, which is gaining traction for its ability to analyze tissues at a molecular level.
The integration of AI and machine learning in MS imaging is enhancing data analysis, improving accuracy, and reducing time for results interpretation. These innovations are fostering broader applications in personalized medicine, cancer research, and drug development.
Regional Analysis
North America dominated the global mass spectrometry imaging market in 2023 and will continue to dominate over the forecast years 2024-2033. The region has attained substantial market share owing to presence of several key market players and their investment in research and development to launch new products.
North America, specifically the U.S is home to several players like Thermo Fisher Scientific, Danaher, Waters Corporation etc. These companies are continuously innovating to improve the resolution, sensitivity, and throughput of MSI instruments, enabling researchers to produce more detailed and precise molecular maps. Additionally, the incorporation of artificial intelligence (AI) and machine learning into mass spectrometry platforms is expected to streamline data analysis, making MSI more user-friendly and easier to interpret for both researchers and clinicians.
- In June 2024, at ASMS, Danaher’s SCIEX unveiled the SCIEX 7500+ system, the latest addition to its quantitative mass spectrometry lineup. This new system builds on SCIEX’s strong reputation for delivering precise and sensitive quantitation. The SCIEX 7500+ not only offers enhanced sensitivity, which is crucial for addressing complex analytical challenges, but also provides the robustness scientists need when working under tight deadlines and handling increasingly diverse and complex sample types.
Mass Spectrometry Imaging Market, Regional Analysis, 2020-2024 (US$ Billion)
| Region | 2020 | 2021 | 2022 | 2023 | 2024 |
|---|---|---|---|---|---|
| North America | 1.1 | 1.3 | 1.4 | 1.5 | 1.5 |
| Europe | 0.9 | 1.1 | 1.2 | 1.2 | 1.3 |
| Asia Pacific | 0.6 | 0.7 | 0.8 | 0.8 | 0.9 |
Key Regions and Countries
North America
- US
- Canada
Europe
- Germany
- France
- The UK
- Spain
- Italy
- Russia
- Netherland
- Rest of Europe
Asia Pacific
- China
- Japan
- South Korea
- India
- New Zealand
- Singapore
- Thailand
- Vietnam
- Rest of APAC
Latin America
- Brazil
- Mexico
- Rest of Latin America
Middle East & Africa
- South Africa
- Saudi Arabia
- UAE
- Rest of MEA
Key Players Analysis
The global mass spectrometry imaging market is highly competitive, with several key players driving innovation and market growth. Leading companies include Agilent, Thermo F. S., Danher, Waters, Bruker, Shimadzu, PerkinElmer, Jeol, and others, each offering advanced Imaging technologies. The Mass Spectrometry Imaging Market is experiencing growth driven by advancements in product development, new product launches, and various other strategies.
Agilent Technologies is a major player, known for its comprehensive portfolio of mass spectrometry systems. Agilent’s focus on high-resolution and accurate mass spectrometry solutions supports its strong position in drug discovery, clinical diagnostics, and proteomics research. The company’s innovations and robust service network enhance its competitive edge globally.
Danaher Corporation is a global science and technology innovator specializing in design, manufacturing, and marketing of products across various industries, including life sciences, diagnostics, and environmental and applied solutions. In addition, Thermo Fisher Scientific Inc. is a leading provider of scientific instruments, reagents, and consumables, serving industries such as healthcare, life sciences, and pharmaceuticals.
Top Key Players
- Danaher Corporation
- Thermo Fisher Scientific Inc.
- Shimadzu Corporation
- Waters Corporation
- Bruker Corporation
- JEOL Ltd.
- Analytik Jena AG
- PerkinElmer, Inc.
Recent Developments
- In June 2023, Sciex launched the Intabio ZT system at ASMS 2023. The Intabio ZT system from Sciex is a cutting-edge platform that uses microfluidic chip technology to integrate imaged capillary isoelectric focusing (icIEF) with UV detection. This system seamlessly combines with the ZenoTOF 7600 mass spectrometer, enabling highly precise identification of molecules. Designed to address challenges in early-stage drug development, the Intabio ZT system allows researchers to efficiently streamline the process of selecting viable drug candidates, offering an advanced solution for accelerating discovery workflows.
- In July 2024, Thermo Fisher Scientific launched Stellar™ Mass Spectrometer at ASMS 2024. The Stellar MS specializes in large-scale quantitation, particularly for high-volume peptide analysis.
- In March 2022, Shimadzu introduced the MALDI-8030 benchtop MALDI-TOF mass spectrometer, which offers both positive-ion and negative-ion analysis, enhancing performance while maintaining a compact design.
Report Scope
| Report Features | Description |
|---|---|
| Market Value (2024) | US$ 4.1 billion |
| Forecast Revenue (2034) | US$ 7.4 billion |
| CAGR (2025-2034) | 6.16% |
| Base Year for Estimation | 2024 |
| Historic Period | 2020-2023 |
| Forecast Period | 2025-2034 |
| Report Coverage | Revenue Forecast, Market Dynamics, COVID-19 Impact, Competitive Landscape, Recent Developments |
| Segments Covered | By Product Type (Instruments, Consumables, and Services), By Technology (Matrix-Assisted Laser Desorption/Ionization (MALDI), Secondary Ion Mass Spectrometry (SIMS), Desorption Electrospray Ionization (DESI), Magnetic Sector Mass Spectrometry, Time-of-Flight Mass Spectrometry (TOFMS), and Other Technologies), By Application (Proteomics, Metabolomics, Glycomics, and Other Applications), By End-User (Pharmaceutical & Biotechnology Companies, Government & Academic Institutions, and Other End-Users) |
| Regional Analysis | North America – US, Canada; Europe – Germany, France, The UK, Spain, Italy, Russia, Netherlands, Rest of Europe; Asia Pacific – China, Japan, South Korea, India, New Zealand, Singapore, Thailand, Vietnam, Rest of APAC; Latin America – Brazil, Mexico, Rest of Latin America; Middle East & Africa – South Africa, Saudi Arabia, UAE, Rest of MEA |
| Competitive Landscape | Danaher Corporation, Thermo Fisher Scientific Inc., Shimadzu Corporation, Waters Corporation, Bruker Corporation, JEOL Ltd., Analytik Jena AG and PerkinElmer, Inc. |
| Customization Scope | Customization for segments, region/country-level will be provided. Moreover, additional customization can be done based on the requirements. |
| Purchase Options | We have three licenses to opt for: Single User License, Multi-User License (Up to 5 Users), Corporate Use License (Unlimited User and Printable PDF) |


