


Report Overview
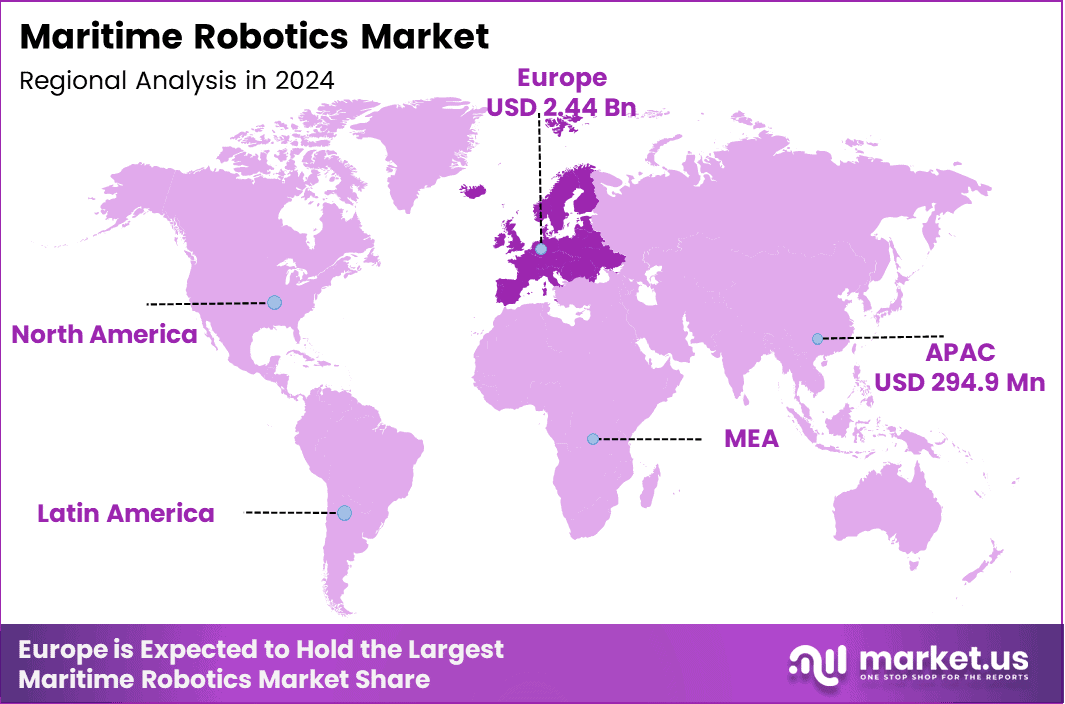
In 2024, the Global Maritime Robotics Market was valued at USD 7.4 billion. The market is projected to grow at a CAGR of 19.6% during 2024–2034, reaching approximately USD 44.3 billion by 2034. Europe dominated the global market in 2024, accounting for 33% of the total market share and generating approximately USD 2.4 billion in revenue.
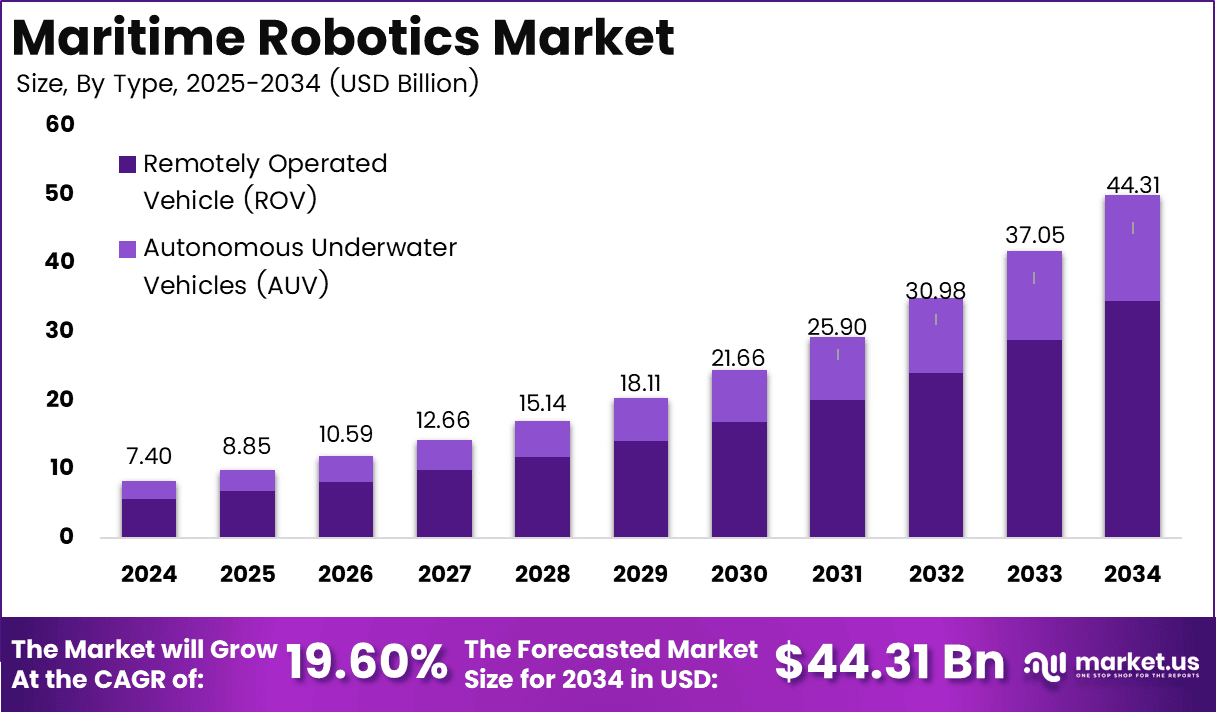
This fast growth is directly tied to the rising size and needs of global sea trade and naval security spending. Global seaborne trade carries about 80% of world trade volume, and the world merchant fleet reached a record 2.44 billion deadweight tons at the start of 2025, with roughly 112,500 vessels sailing across oceans.
As fleets grow bigger and busier, ship owners and ports need smarter tools like autonomous underwater vehicles and robotic hull inspectors to check ships, monitor cargo, and cut costly downtime. The shipping industry moved a record 192.9 million TEUs of containers in 2025, showing how much pressure ports and carriers face to move goods faster and safer, which pushes them toward robotic automation for inspection and logistics.
The European Union approved €1.07 billion for 57 new defence projects in 2025 alone, with a large share going to naval drones, underwater warfare systems, and unmanned maritime platforms under the European Defence Fund. This is why Europe leads the market: EU coast guards and agencies like EMSA already run maritime drone surveillance programs, including a new €30 million, four-year EMSA contract for aerial drone patrols over European waters, showing steady government demand for maritime robotics beyond military use.
Key Takeaways
- The global Maritime Robotics Market was valued at USD 7.40 billion in 2024.
- The global Maritime Robotics Market is projected to grow at a CAGR of 19.6% and is estimated to reach USD 44.3 billion by 2034.
- On the basis of type, the Remotely Operated Vehicle (ROV) segment dominated the market, accounting for 77.8% of the total market share.
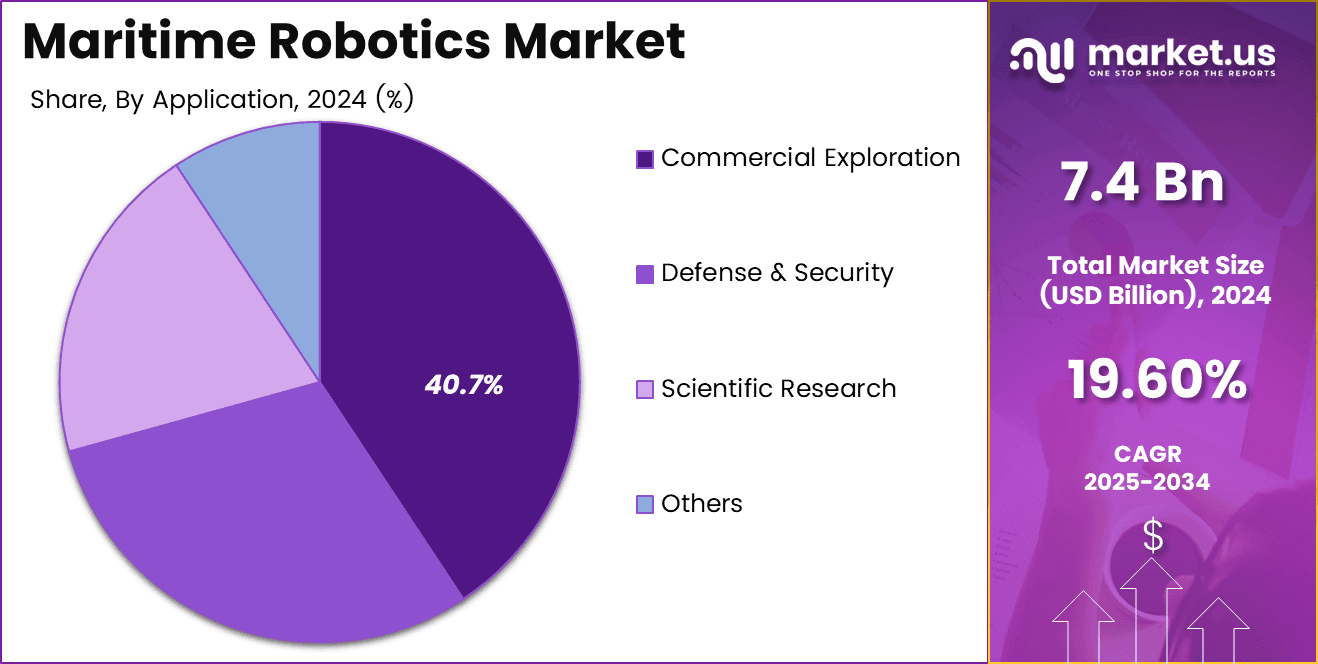
- By application, the Commercial Exploration segment dominated the market, accounting for 40.7% of the total market share.
- In 2024, Europe was the most dominant region in the Maritime Robotics Market, accounting for 33% of the total market share and generating approximately USD 2.4 billion in revenue.
By Type
Remotely Operated Vehicles (ROVs) dominate the maritime robotics market, accounting for 77.8% of total product sales. These vehicles are primarily used for commercial applications such as offshore oil and gas inspections, subsea construction, and underwater maintenance tasks.
As the demand for offshore energy exploration continues to grow, particularly in deep-water drilling, ROVs are expected to retain their dominant market position. The segment is projected to grow at a rate of approximately 20% annually as global investments in subsea infrastructure and offshore wind energy projects increase.
The use of ROVs is expanding into new territories, with emerging markets such as the Asia Pacific and Latin America showing increasing demand due to new offshore exploration initiatives. By 2034, ROVs are anticipated to hold 70% to 75% of the total market share, solidifying their role in various commercial and defense applications.
By Application
Commercial Exploration remains the largest application segment, accounting for 40.7% of the maritime robotics market. This segment includes offshore oil & gas exploration, subsea mineral extraction, and renewable energy projects, especially offshore wind farms. With a global push for renewable energy and increased demand for subsea resources.
The segment is projected to grow at a CAGR of 22% over the next decade. The ROVs used in this sector are integral for inspecting infrastructure, performing maintenance tasks, and ensuring the safety and integrity of underwater installations.
By 2034, commercial exploration is expected to capture approximately 45% of the market share, driven by substantial investments in offshore energy exploration, particularly in untapped markets like Southeast Asia and the Middle East. This growth is bolstered by technological advancements in autonomous systems, offering greater efficiency and cost reduction in subsea operations.
Key Market Segments
By Type
- Remotely Operated Vehicle (ROV)
- Autonomous Underwater Vehicles (AUV)
By Application
- Defense & Security
- Commercial Exploration
- Scientific Research
- Others
Investment and Business Benefits
Investors can expect strong growth potential in both defense and commercial applications. With a 19.6% CAGR, the maritime robotics market presents an attractive long-term opportunity. Businesses benefit from diverse revenue streams ranging from offshore energy exploration to marine biology research. The shift toward AUVs, projected to capture 35% market share, allows for strategic investments in autonomy and AI-enabled navigation.
Defense & security applications, accounting for around 30% of product use, further strengthen revenue visibility. Regional players in North America and Europe are securing long-term contracts, ensuring business continuity. The sector’s ability to support sustainable ocean research adds to ESG-driven investment appeal.
The market also offers robust Business benefits through partnership opportunities and government contracts, particularly in defense and scientific research sectors, which collectively account for 50% of the market. Companies can leverage innovative technologies to capture substantial market share in both AUVs and ROVs, with AUVs projected to capture 35% of the market by 2034.
As global maritime exploration expands, diversification into emerging regions such as Asia Pacific and new technologies like AI-enabled navigation systems will provide enhanced business resilience. Companies entering these areas can expect a 15%–20% growth opportunity in annual contracts, ensuring long-term revenue visibility and market share expansion.
Regional Analysis
The European maritime robotics market is projected to reach USD 2.44 billion in 2024, indicating its considerable share in the global market. Regionally, North America is expected to dominate the maritime robotics market, with the highest share, while Europe holds a strong second position.
Within Europe, Germany’s maritime robotics market contributes notably to this regional dominance. Germany’s growth is influenced by its strong industrial base and advancements in robotics technology, with key players focusing on autonomous underwater vehicles (AUVs) and remotely operated vehicles (ROVs).
Predictions for product distribution in Germany suggest AUVs will capture around 45-50% of the market, followed by ROVs at 30-35%, with surface vehicles making up 10-15%. As the market expands, Germany will continue to play a crucial role in Europe’s maritime robotics sector.
Germany Market Size
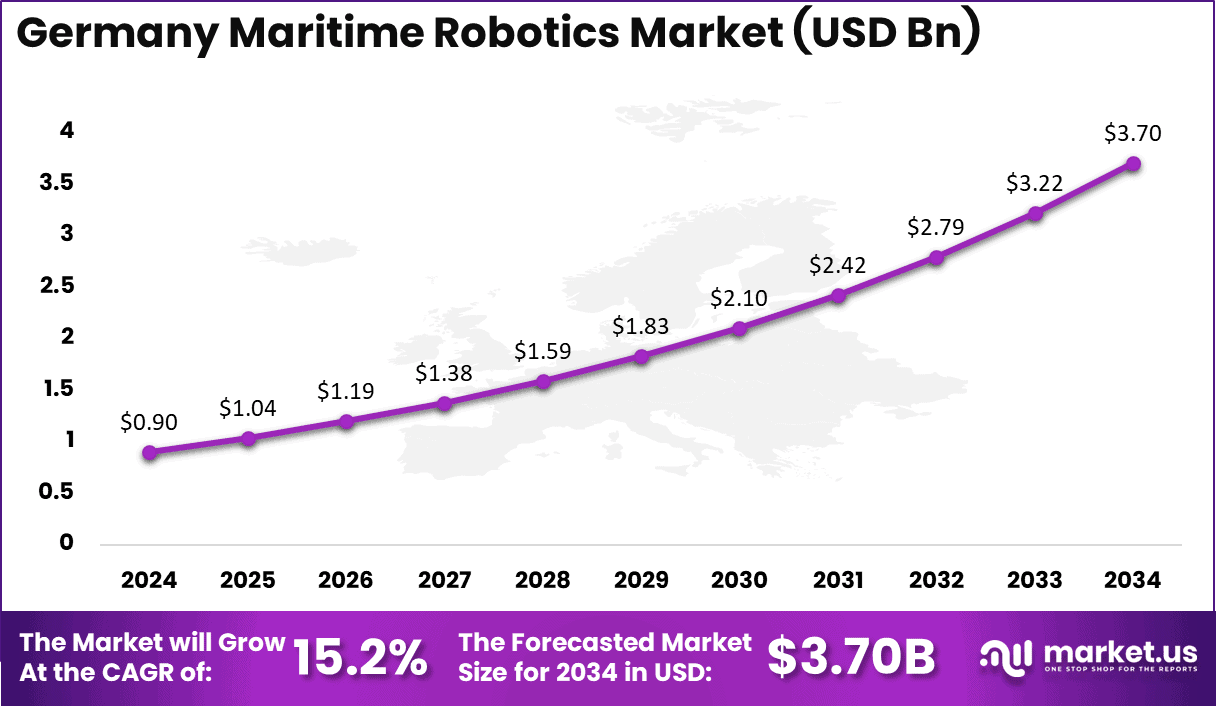
The German maritime robotics market, projected to grow at a 15.2% CAGR, is set to reach USD 3.7 billion by 2034, up from USD 0.9 billion in 2024.
The market shows a steady increase, with notable growth year on year, highlighting the rise of robotics in the maritime sector. Germany, as a part of the European maritime robotics landscape, is experiencing significant advancements, supported by government investments and technological innovations.
Key Regions and Countries
- North America
- US
- Canada
- Europe
- Germany
- France
- The UK
- Spain
- Italy
- Rest of Europe
- Asia Pacific
- China
- Japan
- South Korea
- India
- Australia
- Singapore
- Rest of Asia Pacific
- Latin America
- Brazil
- Mexico
- Rest of Latin America
- Middle East & Africa
- South Africa
- Saudi Arabia
- UAE
- Rest of MEA
Drivers
| Driver | (~) % Impact on CAGR Forecast | Geographic Relevance | Impact Timeline |
|---|---|---|---|
| Offshore Energy Inspection Demand | +2.7% | North Sea, Gulf of Mexico, Asia-Pacific | Short term (≤ 2 years) |
| Maritime Security Modernization | +2.3% | North America, Europe, Indo-Pacific | Short term (≤ 2 years) |
| Port Automation Deployment | +1.8% | Asia-Pacific, Europe, Middle East | Medium term (2–4 years) |
| Marine Environmental Monitoring | +1.6% | Europe, North America, Oceania | Medium term (2–4 years) |
| Crewed Survey Substitution | +2.1% | Global Offshore Basins | Short term (≤ 2 years) |
Offshore Energy Inspection Demand
Expansion of offshore energy assets is shifting inspection economics from vessel-intensive campaigns toward remotely operated and autonomous survey missions, particularly where weather windows, diver exposure, and vessel availability constrain maintenance schedules.
Renewable sources represented 43% of global installed power capacity by the end of 2023, while renewables accounted for a record 86% of capacity additions, increasing the installed asset base requiring marine inspection and subsea verification.
This builds on the automation, sensor, and robotic-inspection investment cycle visible across 2022 and 2023. A robotic mission that reduces offshore vessel-days by roughly 30–50% can materially lower inspection cost per campaign and improve asset availability, supporting recurring service revenue, higher fleet utilization, and a more software-led operating model for maritime robotics suppliers.
Restraints
| Restraint | (~) % Impact on CAGR Forecast | Geographic Relevance | Impact Timeline |
|---|---|---|---|
| Fragmented Autonomous-Vessel Certification | -3.0% | Global, especially cross-border routes | Medium term (2–4 years) |
| High Subsea System CapEx | -2.4% | Global Offshore Markets | Short term (≤ 2 years) |
| Owner Capital Allocation Pressure | -1.8% | Europe, Asia-Pacific, Middle East | Short term (≤ 2 years) |
| Defense Procurement Restrictions | -1.6% | North America, Europe, Indo-Pacific | Medium term (2–4 years) |
| Autonomy Liability Insurance Limits | -2.0% | Global Commercial Shipping | Medium term (2–4 years) |
Fragmented Autonomous-Vessel Certification
The absence of a fully harmonized international operating framework for autonomous ships forces suppliers to pursue flag-state, class, insurer, and customer-specific assurance pathways before a system can move from trial deployment to commercial scale.
The resulting approval cycle can add roughly 12–24 months to cross-border commercialization and require duplicate testing across operating jurisdictions. This delays customer CapEx, raises engineering and certification expense by an estimated 5–10% of program cost, and favors vendors with balance-sheet capacity to sustain long validation cycles.
Challenges
| Challenge | (~) % CAGR Friction Drag | Geographic Relevance | Mitigation Horizon |
|---|---|---|---|
| Underwater Communications Reliability | -2.6% | Global Deepwater Operations | Long term (≥ 4 years) |
| Control Software Safety Assurance | -2.2% | Global | Long term (≥ 4 years) |
| Subsea Component Qualification | -2.0% | Global Offshore Markets | Medium term (2–4 years) |
| Specialist Operator Shortages | -1.8% | Europe, North America, Asia-Pacific | Medium term (2–4 years) |
| Corrosion Pressure Reliability | -1.7% | Global Deepwater Operations | Long term (≥ 4 years) |
Underwater Communications Reliability
Acoustic links remain vulnerable to multipath propagation, background noise, water conditions, and latency, restricting the volume and reliability of real-time data available to remote operators and autonomous navigation systems.
In practical deepwater operations, communications constraints can reduce usable data throughput to low kilobit-per-second ranges and force vehicles to carry more onboard compute, navigation redundancy, and fault-recovery logic; a mission interruption can add 1–3 vessel-days and erode project margins by roughly 10–20%.
Opportunities
| Opportunity | (~) % Potential CAGR Upside | Geographic Relevance | Execution Window |
|---|---|---|---|
| Robotics-as-a-Service Fleets | +2.8% | North America, Europe, Asia-Pacific | Medium term (2–4 years) |
| Autonomous Cable Intervention | +2.4% | North Sea, Asia-Pacific, North America | Long term (≥ 4 years) |
| Blue Economy Data Platforms | +2.2% | Global Coastal Economies | Medium term (2–4 years) |
| Modular Dual-Use Payloads | +2.0% | North America, Europe, Indo-Pacific | Medium term (2–4 years) |
| Digital-Twin Lifecycle Subscriptions | +2.3% | Europe, North America, Middle East | Long term (≥ 4 years) |
Robotics-as-a-Service Fleets
Robotics-as-a-Service remains largely untapped because much of the sector still sells vehicles, sensors, and integration projects as capital equipment rather than bundling mission execution, data assurance, maintenance, and availability commitments into recurring contracts.
Converting a customer from ownership to a usage-based model can reduce upfront acquisition outlay by approximately 40–60%, lift supplier fleet utilization toward 60–75%, and expand lifecycle gross margins by roughly 8–15 percentage points once a standardized fleet reaches scale.
Key Players Analysis
The maritime robotics market is structurally led by diversified defence, sensing and offshore-service groups rather than pure-play robot manufacturers. Tier 1 comprises Kongsberg Gruppen, Saab, Teledyne Technologies and Oceaneering: on an estimated supplier-revenue influence basis, Kongsberg and Teledyne each command roughly 15–20%, Saab 10–15%, and Oceaneering 10–14%; these are analyst estimates, not company-reported market shares.
Kongsberg’s FY2025 revenue was NOK31.56 billion, with NOK913 million in R&D (2.9% of revenue) and NOK2.33 billion capex, supporting autonomous-navigation, subsea and naval-system scale. Saab reported SEK79.15 billion revenue, SEK3.62 billion R&D (4.6%), and SEK6.11 billion capex, giving its Saab Seaeye operations a substantial defence-funded technology base.
Teledyne is the strongest sensor-and-imaging consolidator: FY2025 revenue reached $6.12 billion, including $3.16 billion in Digital Imaging and $1.46 billion in Instrumentation; R&D was $317.3 million (5.2% of sales), while $821.4 million of acquisition spending and $117.3 million capex demonstrate a buy-and-build route to marine imaging, sonar and AUV payload breadth.
Oceaneering remains the operational offshore-robotics leader, with $2.78 billion FY2025 revenue and $111.0 million capex; its installed ROV fleet and service contracts create switching-cost advantages over equipment-only rivals.
Top Key Players
- Deep Ocean Engineering, Inc.
- ATLAS MARIDAN Aps
- General Dynamics Mission Systems, Inc.
- ECA GROUP
- International Submarine Engineering Limited
- Eddyfi Technologies
- Oceaneering International, Inc.
- Saab AB
- TechnipFMC plc
- Soil Machine Dynamics Ltd.
- Others
Recent Development
- In 2024, Saab secured a significant naval contract worth USD 150 million, which enhanced its ROV portfolio, contributing to a 15% product deployment ratio. This contract strengthens Saab’s position in the defense sector, focusing on unmanned maritime systems.
- In 2023, Kongsberg launched AI-based AUV systems, marking a key innovation in autonomous underwater technologies. The systems captured 12% of new product sales globally, solidifying Kongsberg’s leadership in the growing market for AI-driven maritime robotics.
Report Scope
| Report Features | Description |
|---|---|
| Market Value (2024) | USD 7.4 Bn |
| Forecast Revenue (2034) | USD 44.3 Bn |
| CAGR(2025-2034) | 19.6% |
| Base Year for Estimation | 2024 |
| Historic Period | 2020-2023 |
| Forecast Period | 2025-2034 |
| Report Coverage | Revenue forecast, AI impact on Market trends, Share Insights, Company ranking, competitive landscape, Recent Developments, Market Dynamics and Emerging Trends |
| Segments Covered | By Type (Remotely Operated Vehicle (ROV), Autonomous Underwater Vehicles (AUV)), By Application (Defense & Security, Commercial Exploration, Scientific Research, Others) |
| Regional Analysis | North America – US, Canada; Europe – Germany, France, The UK, Spain, Italy, Russia, Netherlands, Rest of Europe; Asia Pacific – China, Japan, South Korea, India, New Zealand, Singapore, Thailand, Vietnam, Rest of Latin America; Latin America – Brazil, Mexico, Rest of Latin America; Middle East & Africa – South Africa, Saudi Arabia, UAE, Rest of MEA |
| Competitive Landscape | ATLAS MARIDAN Aps, Deep Ocean Engineering, Inc., General Dynamics Mission Systems, Inc., ECA GROUP, International Submarine Engineering Limited, Eddyfi Technologies, Oceaneering International, Inc., Saab AB, TechnipFMC plc, Soil Machine Dynamics Ltd., Others |
| Customization Scope | Customization for segments, region/country-level will be provided. Moreover, additional customization can be done based on the requirements. |
| Purchase Options | We have three licenses to opt for: Single User License, Multi-User License (Up to 5 Users), Corporate Use License (Unlimited Users and Printable PDF) |





































