


Report Overview
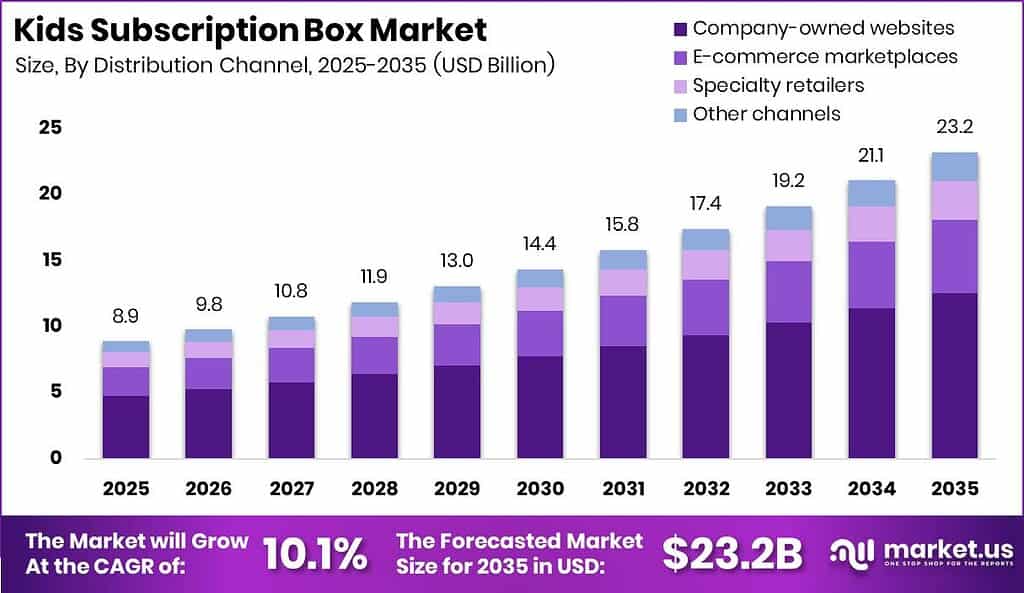
Global Kids Subscription Box Market size is expected to be worth around USD 23.20 Billion by 2035 from USD 8.90 Billion in 2025, growing at a CAGR of 10.1% during the forecast period 2026 to 2035. This trajectory rewards operators who convert one-time gift buyers into multi-year prepaid cohorts. Therefore capital allocation should favor retention systems over pure acquisition spend.
The Kids Subscription Box Market covers recurring shipments of age-matched educational kits, STEM projects, arts materials, books, toys, and themed activity packs sold mainly through direct digital channels. Structure splits cleanly by box type, child age band, price tier, and fulfillment channel. Parents buy predictable learning moments rather than single toys, which stabilizes reorder cycles for brands that refresh content on time.
Key Takeaways
- The market is valued at USD 8.90 Billion in 2025 and is projected to reach USD 23.20 Billion by 2035 at a CAGR of 10.1%.
- Educational and learning kits lead By Box Type with a 30.00% share.
- Preschool children aged 3 to 5 years lead By Age Group with a 35.00% share.
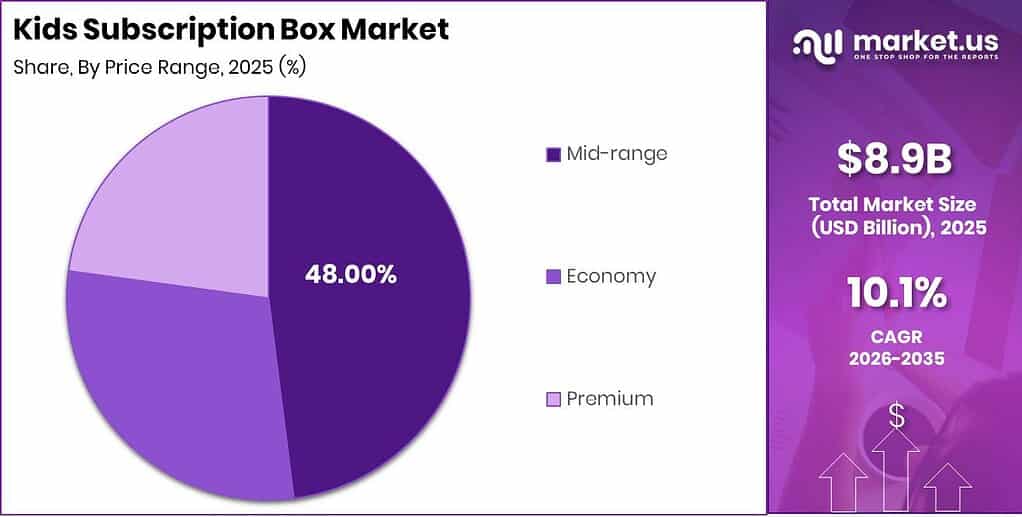
- Mid-range pricing leads By Price Range with a 48.00% share.
- Company-owned websites lead By Distribution Channel with a 54.00% share.
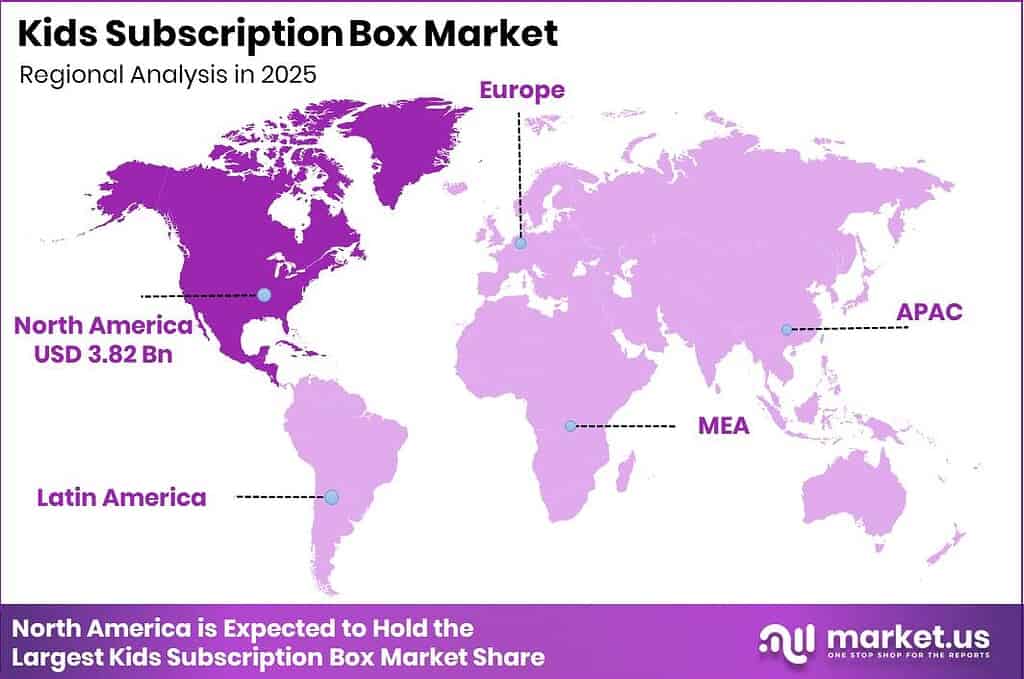
- North America anchors demand through mature e-commerce habits and strong parental spend on screen-free learning products.
As per our research, the average U.S. subscription box priced near USD 43 per month still competes with childcare and housing costs inside family budgets. This price point forces operators to prove monthly learning value or face fast cancellation. Consequently brands that bundle clear skill outcomes retain more of each acquired cohort.
Data from subscription pricing studies shows annual prepay plans cut churn by an average of 51% versus monthly billing. This structure locks cash earlier and lowers payment-failure exits. As a result finance teams can fund content refresh from prepaid balances rather than continuous ad spend.
Figures on e-commerce acquisition show average customer acquisition cost reached USD 68 to USD 84 across categories in 2025, up 60% over five years. This cost pressure makes first-box delight and sibling upsell essential to recover spend. In 2025, Lovevery also opened selected developmental products to one-time purchase outside pure subscription cycles, which gives hesitant parents a lower-risk entry path into the same product system.
Box Type Analysis
Educational and learning kits dominates with 30.00% due to curriculum-aligned hands-on skill building.
In 2025, Educational and learning kits held a dominant market position in the By Box Type segment of Kids Subscription Box Market, with a 30.00% share. UNESCO data show hundreds of millions of children still need stronger foundational learning pathways worldwide. This gap pushes parents toward structured monthly kits that mirror school skills at home. Vendors who map each crate to clear literacy or numeracy outcomes will defend share against pure toy boxes.
STEM and science kits serve parents who want engineering play tied to real experiments and build sequences. Corporate catalogs such as KiwiCo continue to expand hands-on science and engineering crates for multiple ages. This product depth supports longer tenure as children move from simple builds to complex projects. Brands that pair kits with short instructional video layers reduce frustration and protect renewal rates.
Arts and crafts kits convert creative time into repeatable family rituals with consumable materials that justify monthly replenishment. Books and reading boxes anchor literacy habits through curated titles and reading guides each cycle. Toys and games plus other specialty boxes hold the remaining collective share and serve gift and entertainment occasions. Operators who sequence education first and recreation second capture both intent types without diluting brand focus.
Age Group Analysis
Preschool children 3–5 years dominates with 35.00% due to early-learning parent investment intensity.
In 2025, Preschool children aged 3 to 5 years held a dominant market position in the By Age Group segment of Kids Subscription Box Market, with a 35.00% share. U.S. Census figures show e-commerce already equaled 16.9% of total retail sales in the first quarter of 2026, easing online discovery of age-specific crates. This channel maturity lets preschool brands scale without store fixtures. Firms that own clear 3 to 5 year curricula will keep category leadership as more parents shop fully digital.
Infants and toddlers from 0 to 2 years need sensory-safe, stage-based play objects rather than complex projects. KiwiCo assigns Panda Crate to ages 0 to 36 months, covering a full three-year developmental window inside one branded ladder. This design keeps families inside one ecosystem before preschool graduation. Competitors without a 0 to 2 entry product lose lifetime value at the first parenting purchase.
School-age children from 6 to 12 years demand harder STEM builds, coding intros, and multi-session projects that match classroom topics. Teenagers from 13 to 17 years seek advanced kits, creator tools, and identity-led themes that feel less childish. Both older bands require faster content refresh to avoid boredom churn. Portfolio maps that hand families upward paths from toddler to teen protect multi-year revenue.
Price Range Analysis
Mid-range dominates with 48.00% due to balanced quality and household budget fit.
In 2025, Mid-range held a dominant market position in the By Price Range segment of Kids Subscription Box Market, with a 48.00% share. Literati listed children’s monthly book-box plans starting near USD 11.95 in February 2026, illustrating accessible entry pricing inside broader kids subscriptions. This band captures parents who reject both cheap filler and luxury markups. Brands that hold perceived quality at mid stickiness will own the volume core of the category.
Economy tiers attract gift trials and price-sensitive households but raise cancellation risk when material quality disappoints after box one. Premium tiers fund richer components, educator design, and brand prestige for affluent buyers. Both flanks matter for assortment completeness yet rarely match mid-range unit volume. Pricing architecture that upsells economy users into mid annual plans lifts lifetime value without alienating core shoppers.
Household budgets remain the binding constraint on every tier choice. Operators who publish clear cost-per-activity math help parents justify renewals against competing childcare spend. Transparent plan ladders also reduce involuntary churn from payment surprises. Clear tiering therefore becomes a retention tool, not only a merchandising label.
Distribution Channel Analysis
Company-owned websites dominates with 54.00% due to direct subscriber data and margin control.
In 2025, Company-owned websites held a dominant market position in the By Distribution Channel segment of Kids Subscription Box Market, with a 54.00% share. Direct sites capture full first-party profiles, plan preference, and cancellation reasons that marketplaces rarely share. This data advantage funds better cohort content tests and prepaid offers. Owners who invest in site checkout speed and pause flows will defend the majority channel position.
E-commerce marketplaces extend discovery to parents who start product search on large platforms rather than brand URLs. Specialty retailers add tactile trust for gifting seasons and local discovery. Other channels cover wholesale, institutional pilots, and partner bundles. Marketplace and retail paths raise awareness yet compress margin, so smart operators treat them as acquisition funnels back to owned sites.
Channel mix must still respect rising digital retail norms. Census data confirm online sales already exceed 16% of U.S. retail, so pure offline dependence is not viable for subscription renewal mechanics. Brands that keep plan management, swaps, and support on owned properties reduce platform fee drag. Direct control of the renewal moment remains the profit center of this market.
Key Market Segments
By Box Type
- Educational and learning kits
- STEM and science kits
- Arts and crafts kits
- Books and reading boxes
- Toys and games
- Other boxes
By Age Group
- Infants and toddlers: 0–2 years
- Preschool children: 3–5 years
- School-age children: 6–12 years
- Teenagers: 13–17 years
By Price Range
- Economy
- Mid-range
- Premium
By Distribution Channel
- Company-owned websites
- E-commerce marketplaces
- Specialty retailers
- Other channels
Regional Analysis
North America Dominates the Kids Subscription Box Market through deep e-commerce adoption and high parental spend on developmental products
North America leads because routine online purchasing already supports prepaid multi-box plans without store inspection. U.S. e-commerce reached 16.9% of total retail sales in the first quarter of 2026, giving kids box brands a ready checkout habit. Screen-free learning preferences further concentrate demand in the United States and Canada. Operators who localize fulfillment inside the region cut transit risk and protect unboxing quality.
Asia Pacific offers the fastest structural upside as education gaps and rising digital retail expand the addressable parent base. UNESCO still counts well over 250 million children and youth outside school globally, with heavy weight in lower-income Asia markets that need affordable learning tools. Localized language kits and mid-range pricing can unlock this growth. Early movers who build regional content teams will outpace pure import models.
Europe combines strong safety regulation with demand for arts, books, and STEM subscriptions in digitally mature households. Latin America and Middle East and Africa remain earlier-stage but respond to marketplace discovery and diaspora gifting flows. Cross-region players must design compliance and landed-cost models per bloc. Regional depth beats shallow global catalogs when churn depends on cultural fit.
Key Regions and Countries
North America
- US
- Canada
Europe
- Germany
- France
- The UK
- Spain
- Italy
- Rest of Europe
Asia Pacific
- China
- Japan
- South Korea
- India
- Australia
- Rest of APAC
Latin America
- Brazil
- Mexico
- Rest of Latin America
Middle East and Africa
- GCC
- South Africa
- Rest of MEA
Market Dynamics
Market Opportunity Analysis - Institutional buyers, older age bands, and localized mid-range offers still sit below their potential share
Institutional learning subscriptions remain underexploited relative to household crates that dominate current design. Schools and libraries need multi-user packs, educator guides, and term billing rather than single-child parcels. Converting formats for classroom durability opens contracts that household churn dynamics cannot match. New entrants who rebuild SKUs for 20 to 30 learner groups can leapfrog consumer-only brands.
Teenagers aged 13 to 17 years still receive less catalog depth than preschool lines that hold 35.00% share. This band wants advanced STEM, creator tools, and identity-led themes. Sparse teen assortments leave renewal cliffs when children age out of 6 to 12 products. Investors can fund specialized teen ladders that capture families already inside educational box habits.
Asia Pacific localization lags North American content maturity even as education needs scale quickly. Mid-range pricing at 48.00% global share proves parents will pay for quality when language and curriculum fit. Therefore translated kits with local examples can unlock volume without premium sticker shock. Early regional content studios will set switching costs before global majors adapt.
Economy and specialty retail paths remain secondary to company sites at 54.00% share, yet they can seed trial in gift seasons. Using retail as a controlled acquisition funnel into owned prepaid plans improves payback on high CAC. This hybrid motion is still uneven across brands. Operators who instrument that handoff cleanly will raise cohort quality faster than marketplace-only sellers.
Technology and Innovation Landscape - Video-guided builds, stage-based product ladders, and flexible access models reshape retention mechanics
Video-linked engineering instruction now sits beside physical parts in leading STEM subscriptions. CrunchLabs paired build projects with Mark Rober-led lessons so children can see assembly steps before failure frustration sets in. This hybrid layer cuts support tickets and raises completed-project rates. Manufacturers who treat digital guidance as core product, not marketing, will hold older child cohorts longer.
Age-ladder architecture from infant sensory kits through advanced crates keeps families inside one data profile for years. KiwiCo’s assignment of Panda Crate to 0 to 36 months shows how a three-year window anchors early loyalty before preschool upsell. Continuous stage mapping turns product R&D into a retention system. Brands without ladder logic must reacquire the same household at every birthday.
Flexible access beyond pure lock-in subscriptions is expanding trial. Lovevery’s 2025 move to sell selected developmental kits as one-time purchases lets cautious parents test quality before recurring billing. This design reduces first-box regret and still feeds the subscription funnel. Product teams should instrument which one-time SKUs convert fastest into annual plans.
Direct-site plan tools, pause flows, and prepaid annual checkout form the software backbone of margin defense. When company websites already hold majority share, small gains in renewal UX outweigh new marketplace listings. Automation in cohort content testing further lowers creative cost per retained subscriber. Technology spend should follow retention math, not vanity feature lists.
Drivers
Routine online purchasing lowers the barrier to ordering recurring educational products without store inspection. U.S. Department of Commerce data put e-commerce at 16.1% of total retail sales in 2024, up from 15.4% in 2023, while the U.S. Census Bureau recorded 16.9% in the first quarter of 2026. UNESCO reported in 2024 that 110 million more children and young people had entered education since 2015. Vendors can replace one-off toy buys with prepaid 3, 6, or 12 delivery plans and spread acquisition cost across longer cohorts.
Foundational learning demand, screen-free activity preference, developmental personalization, and recurring gift habits reinforce this shift in mature digital markets. Parents pay for structured monthly progress rather than novelty alone. This behavior supports an estimated incremental CAGR effect near 1.9% from e-commerce readiness and further lift from learning-led drivers. Investors should underwrite brands that own curriculum credibility and easy prepaid checkout together.
| Driver | (~) % Impact on CAGR Forecast | Geographic Relevance | Impact Timeline |
|---|---|---|---|
| Established E-Commerce Purchasing | +1.9% | North America, Western Europe, East Asia | Short term (2 years or less) |
| Foundational Learning Demand | +1.6% | Global | Medium term (2 to 4 years) |
| Screen-Free Activity Preference | +1.2% | North America, Europe, Australia | Short term (2 years or less) |
| Developmental Personalization | +0.9% | Digitally mature consumer markets | Medium term (2 to 4 years) |
| Recurring Gift Adoption | +0.7% | North America, Europe, affluent Asia-Pacific | Medium term (2 to 4 years) |
Restraints
Kids subscription boxes remain discretionary and compete with childcare, housing, and food inside family budgets. The Federal Reserve reported that only 63% of U.S. adults could cover a hypothetical 400-dollar emergency expense fully with cash in 2023, down from 68% in 2021. Parents using paid childcare often spent amounts equal to 50% to 70% of monthly housing on care alone. These pressures raise price sensitivity and cancellation risk for every nonessential crate.
Parcel cost escalation, product-safety market access rules, cross-border import exposure, and weak rural connectivity further slow expansion. A discount of 10% paired with a 5% drop in active subscribers can cut cohort revenue by about 14.5%. This math supports an estimated CAGR deduction near 1.8% from affordability alone. Sellers must defend contribution margin with smarter pack design rather than endless list-price cuts.
| Restraint | (~) % Impact on CAGR Forecast | Geographic Relevance | Impact Timeline |
|---|---|---|---|
| Household Affordability Pressure | -1.8% | Global, strongest among middle- and lower-income households | Short term (2 years or less) |
| Parcel Cost Escalation | -1.5% | North America and remote delivery markets | Short term (2 years or less) |
| Product-Safety Market Access | -1.2% | European Union, United Kingdom, North America | Short term (2 years or less) |
| Cross-Border Import Exposure | -0.8% | Import-dependent consumer markets | Medium term (2 to 4 years) |
| Connectivity-Based Exclusion | -0.5% | Low-income and rural markets | Long term (4 years or more) |
Challenges
Children outgrow themes and skill levels quickly, so repetition or mismatch drives churn even after strong acquisition. At monthly churn of 5%, about 54% of an opening cohort remains after 12 months, while cutting churn to 4% lifts retention near 61%. Federal Reserve evidence that only 63% of adults could absorb a 400-dollar emergency expense shows how often optional plans must re-prove value. Lifecycle personalization and pause tools become mandatory operating systems.
Age-matched inventory planning, multi-supplier quality control, peak-season fulfillment volatility, and constant content refresh add further friction. Regulatory attention on negative-option billing also raises reputational stakes around cancellation ease. Meeting these issues creates room for software-led cohort engines and tighter supplier scorecards. Firms that solve churn math unlock durable free cash flow others cannot match.
| Challenge | (~) % CAGR Friction Drag | Geographic Relevance | Mitigation Horizon |
|---|---|---|---|
| Subscriber Churn Management | -1.6% | Global subscription markets | Medium term (2 to 4 years) |
| Age-Matched Inventory Planning | -1.3% | Global multi-segment operators | Medium term (2 to 4 years) |
| Multi-Supplier Quality Control | -1.0% | Global | Long term (4 years or more) |
| Peak-Season Fulfilment Volatility | -0.7% | North America and Europe | Medium term (2 to 4 years) |
| Content Refresh Requirements | -0.5% | Global education-focused segments | Long term (4 years or more) |
Opportunities
Schools, libraries, community centers, and after-school programs remain open white space because most offers still target single households. UNESCO reported 251 million children and youth outside school in 2024, with out-of-school rates near 33% in low-income countries versus 3% in high-income countries. UNICEF notes nearly two-thirds of 10-year-olds globally cannot read and understand a simple text. Institutional cartons for 20 to 30 learners can cut packaging units per child by more than 80%.
Regional-language localization, inclusive learning kits, employer-sponsored family benefits, and reusable kit circulation extend the same logic into new buyer groups. Term contracts can add roughly 3 to 6 contribution points and support potential CAGR upside near 1.7% from institutional channels alone. Early movers who rebuild SKUs for multi-user durability will own procurement relationships. Household brands that ignore this shift leave a parallel market to specialists.
| Opportunity | (~) % Potential CAGR Upside | Geographic Relevance | Execution Window |
|---|---|---|---|
| Institutional Learning Subscriptions | +1.7% | Global schools, libraries, and after-school programs | Medium term (2 to 4 years) |
| Regional-Language Localization | +1.3% | India, Southeast Asia, Latin America, diaspora markets | Medium term (2 to 4 years) |
| Inclusive Learning Kits | +1.0% | North America, Europe, urban Asia-Pacific | Long term (4 years or more) |
| Employer-Sponsored Family Benefits | +0.8% | North America, Europe, developed Asia-Pacific | Medium term (2 to 4 years) |
| Reusable Kit Circulation | +0.5% | Europe and dense urban markets | Long term (4 years or more) |
Key Company Insights
KiwiCo, Inc. positions across STEM, arts, and geography crates with age-ladder design, including Panda Crate for ages 0 to 36 months. In 2025 the company kept expanding monthly programs such as Kiwi Crate and Tinker Crate for hands-on science and engineering. This breadth raises switching costs as children age inside one brand. Fulfillment cost discipline between USD 1.50 and USD 4.00 per box remains critical to protect margins as assortment widens.
Lovevery, Inc. competes on developmental play science and stage-based kits for early years. In 2025 it opened selected products to one-time purchase outside the pure Play Kit subscription path. This move lowers trial friction while still feeding the core recurring model. COGS often equal 40% to 50% of subscription price, so Lovevery must keep component quality high without breaking mid-range willingness to pay.
Key Players
- KiwiCo, Inc.
- Lovevery, Inc.
- Little Passports
- Green Kid Crafts, LLC
- MEL Science
- Raddish Kids
- toucanBox Ltd.
- Bitsbox
- Creation Crate
- Flintobox — Flinto Learning Solutions
- KidStir, Inc.
- Brick Loot
- Bookroo
- OwlCrate Enterprises Inc.
- Literati, Inc.
Recent Developments
- 2025: Little Passports relaunched its World Adventures subscription box with redesigned travel journals, destination activities, collectible coins, refreshed maps, and updated educational kits for geography and cultural learning.
- 2025: CrunchLabs expanded its portfolio with Creative Kit offerings for children aged 6 to 10 beside its Build Box and Hack Pack lines, adding more age-specific STEM products.
- 2025: CrunchLabs integrated build projects with Mark Rober-led instructional videos, combining physical engineering kits with digital learning content for children and teenagers.
Geopolitical Impact Analysis
According to UNCTAD-linked trade reporting, global export tariffs rose sharply in 2025, by about 10% for developed economies and 16% for developing economies. Toy and game supply chains that feed kids activity kits face higher landed costs when components cross multiple borders. This pressure lifts COGS inside boxes that already spend 40% to 50% of price on product. Operators dependent on single-country sourcing must dual-source plastics, paper, and electronics or accept thinner contribution margins.
Figures from U.S. trade practice discussions show toys under HTS Chapter 95 often carry a 0% base MFN rate yet still absorb surcharges such as a 10% Section 122-style tariff layer in 2026 policy windows. Therefore subscription brands shipping monthly parcels feel duty volatility faster than one-time toy retailers. As a result pricing teams need surcharge clauses and regional micro-fulfillment to protect the mid-range USD 43 average box position parents already treat as discretionary.
Report Scope
| Report Features | Description |
|---|---|
| Market Value (2025) | USD 8.90 Billion |
| Forecast Revenue (2035) | USD 23.20 Billion |
| CAGR (2026-2035) | 10.1% |
| Base Year for Estimation | 2025 |
| Historic Period | 2020-2024 |
| Forecast Period | 2026-2035 |
| Report Coverage | Revenue Forecast, Market Dynamics, Market Opportunity Analysis, Technology and Innovation Landscape, Competitive Landscape, Recent Developments |
| Segments Covered | By Box Type (Educational and learning kits, STEM and science kits, Arts and crafts kits, Books and reading boxes, Toys and games, Other boxes), By Age Group (Infants and toddlers 0–2 years, Preschool children 3–5 years, School-age children 6–12 years, Teenagers 13–17 years), By Price Range (Economy, Mid-range, Premium), By Distribution Channel (Company-owned websites, E-commerce marketplaces, Specialty retailers, Other channels) |
| Regional Analysis | North America (US and Canada), Europe (Germany, France, The UK, Spain, Italy, and Rest of Europe), Asia Pacific (China, Japan, South Korea, India, Australia, and Rest of APAC), Latin America (Brazil, Mexico, and Rest of Latin America), Middle East and Africa (GCC, South Africa, and Rest of MEA) |
| Competitive Landscape | KiwiCo, Inc., Lovevery, Inc., Little Passports, Green Kid Crafts, LLC, MEL Science, Raddish Kids, toucanBox Ltd., Bitsbox, Creation Crate, Flintobox — Flinto Learning Solutions, KidStir, Inc., Brick Loot, Bookroo, OwlCrate Enterprises Inc., Literati, Inc. |
| Customization Scope | Customization for segments, region / country-level will be provided. Additional customization can be done based on requirements. |
| Purchase Options | We have three licenses to opt for: Single User License | Multi-User License (Up to 5 Users) | Corporate Use License (Unlimited User and Printable PDF) |





































