


Report Overview
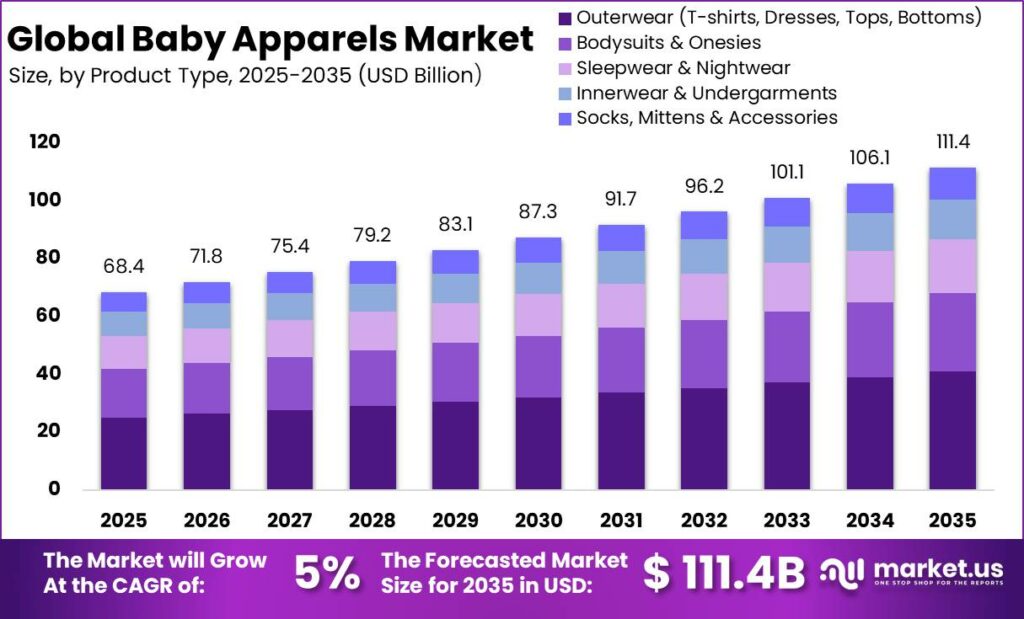
Global Baby Apparels Market size is expected to be worth around USD 111.40 Billion by 2035 from USD 68.40 Billion in 2025, growing at a CAGR of 5.0% during the forecast period 2026 to 2035. This trajectory reflects steady replacement-driven demand tied to infant growth cycles. Vendors gain a durable, recurring revenue base that resists the volatility seen in adult fashion categories.
The Baby Apparel market covers clothing and accessories for newborns through preschoolers, structured across product type, material, age group, gender, price range, and distribution channel. This means the category spans essentials such as bodysuits and sleepwear alongside occasion and gift purchases. Therefore brands must serve both routine caregiver buying and higher-margin gifting demand within a single product architecture.
Key Takeaways
- Baby Apparels Market size will reach USD 111.40 Billion by 2035, up from USD 68.40 Billion in 2025 at a CAGR of 5.0%.
- Outerwear led By Product Type with a 36.80% share, while Socks, Mittens and Accessories grew fastest.
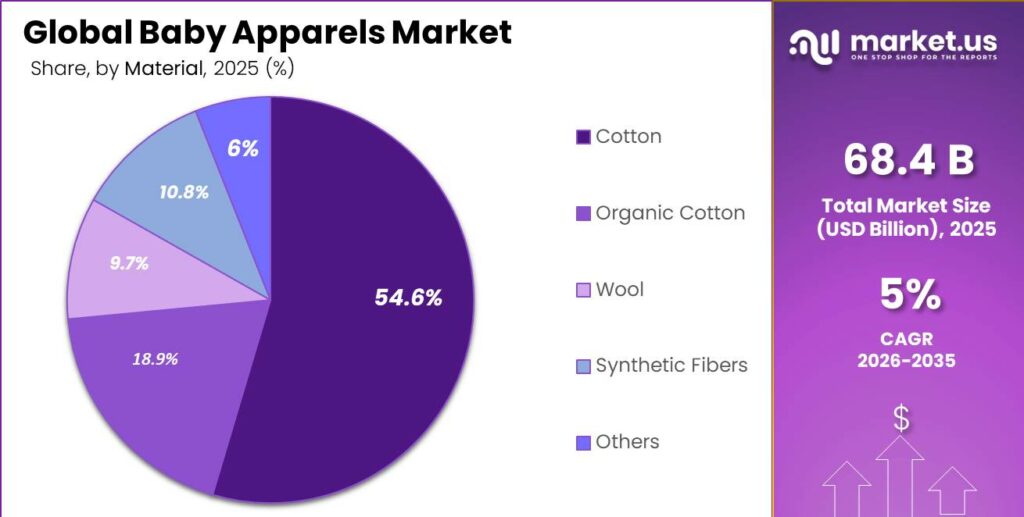
- Cotton dominated By Material Type at 54.60%, with Organic Cotton at 18.90% as the fastest-growing fiber.
- Infants aged 0 to 12 months held 42.30% of By Age Group demand.
- Unisex Apparel captured 39.20% of By Gender sales.
- Mass Market controlled 58.80% of By Price Range revenue.
- Offline Retail Stores held 61.30% of By Distribution Channel sales.
- Individual Consumers accounted for 88.60% of By End User demand.
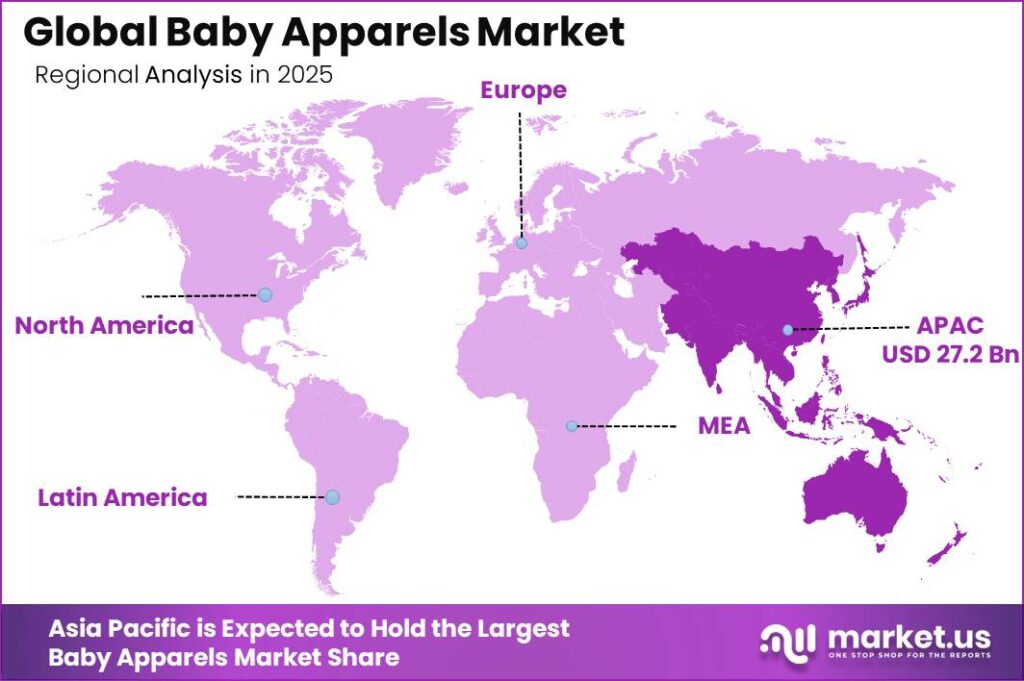
- Asia-Pacific led all regions with a 39.70% share, valued at USD 27.20 Billion.
The market structure rewards scale in essentials and margin in premium tiers. As reported by the U.S. Cotton Trust Protocol, growers achieved an 87% improvement in water use efficiency over the 2015 baseline in the 2024/25 reporting year, producing the same cotton volume with 47% less irrigation water. This strengthens the sustainability case for cotton-based baby apparel. Brands leaning on certified low-impact fiber can command price premiums without sacrificing supply reliability.
Government and regulatory activity now shapes sourcing economics directly. Data from the U.S. Consumer Product Safety Commission shows the agency issued 542 recalls and safety warnings in 2025, a 32% rise and an all-time record. This raises compliance stakes for infant garment sellers. Companies that build testing and traceability early avoid costly recalls and protect shelf access in regulated markets. In July 2025, Carter’s launched Otter Avenue, a toddler-focused brand built around self-dressing ease, signaling a product-innovation response to these shifting buyer expectations.
Product Type Analysis
Outerwear dominates with 36.80% due to daily wear and gifting overlap.
In 2025, Outerwear held a dominant market position in the By Product Type segment of Baby Apparels Market, with a 36.80% share. UN Comtrade classifies knitted babies’ garments under HS 6111, one of the highest-volume infant apparel trade codes worldwide. This breadth spans t-shirts, dresses, tops, and bottoms bought repeatedly across sizes. Therefore brands that anchor assortments in outerwear secure the most frequent repeat-purchase touchpoints with parents.
Bodysuits and onesies serve as the functional core of the newborn wardrobe. India exported US$927.93 Million in babies’ garments and clothing accessories during 2023 to 2024, per India’s Directorate General of Commercial Intelligence and Statistics. This confirms deep global supply for basics that parents replenish constantly. Brands using onesies as entry products can convert first-time buyers into loyal, recurring customers over an infant’s growth cycle.
Sleepwear and nightwear carry stringent flammability and safety expectations that raise buyer trust barriers. Innerwear and undergarments follow, where fit and skin-contact comfort drive selection. Non-knit baby garments under HS 6209 represent a US$3 to 4 Billion annual trade category, per HS classification trade data. This signals a stable base for essentials. Socks, mittens, and accessories, the fastest-growing product line, hold the remaining share collectively as low-ticket impulse and gift add-ons.
Material Type Analysis
Cotton dominates with 54.60% due to breathability and skin safety trust.
In 2025, Cotton held a dominant market position in the By Material Type segment of Baby Apparels Market, with a 54.60% share. According to CottonToday data, 64% of U.S. cotton requires no irrigation at all, with just 5% fully irrigated. This lowers the environmental cost of the leading baby apparel fiber. Brands sourcing rain-fed cotton can credibly market low-impact essentials to eco-conscious parents.
Organic cotton, the fastest-growing material, anchors the premium and safety-led tier. GOTS found that certified facilities reached 17,800 worldwide as of January 2026, a 15.3% year-on-year rise from 15,441 in 2024 across 95 countries. This expanding certification base widens organic supply. Brands can scale certified infant lines without the sourcing bottlenecks that once limited organic pricing power.
Wool and synthetic fibers serve niche thermal and durability needs at lower volumes. OEKO-TEX issued over 57,000 certificates in the 2024/2025 financial year, an 8% increase, with over 18,000 products carrying the MADE IN GREEN label. This raises chemical-safety assurance across fiber types. Manufacturers using certified processing protect market access as buyers scrutinize skin-contact materials. Others hold the remaining share collectively.
Age Group Analysis
Infants dominate with 42.30% due to fastest size replacement cycles.
In 2025, Infants aged 0 to 12 months held a dominant market position in the By Age Group segment of Baby Apparels Market, with a 42.30% share. World Bank data shows global annual births remain above 130 Million, sustaining a large replenishment base. Infants outgrow garments within weeks. Therefore brands targeting this cohort capture the highest purchase frequency and the fastest reorder velocity in the category.
Toddlers aged 1 to 3 years shift buyer priorities toward durability and active-play fit. Newborns aged 0 to 3 months anchor gift and layette demand at the earliest life stage. As per our research, roughly 35% to 40% of baby apparel purchases are gifts. This concentrates spending around birth. Brands with newborn gift bundles capture less price-sensitive buyers who respond to brand and packaging.
Preschoolers aged 3 to 5 years grow fastest as children transition toward self-selected styles and school-adjacent wardrobes. National statistical offices report rising preschool enrollment across urban Asia-Pacific, expanding structured apparel demand. This extends the commercial relationship beyond infancy. Brands that graduate customers from infant to preschool lines lengthen lifetime value and reduce churn to competitors.
Gender Analysis
Unisex Apparel dominates with 39.20% due to gifting and hand-me-down efficiency.
In 2025, Unisex Apparel held a dominant market position in the By Gender segment of Baby Apparels Market, with a 39.20% share. As per our research, over 60% of new parents reuse garments across siblings, favoring neutral designs. Unisex ranges maximize reuse. Therefore brands cut SKU complexity and inventory risk while appealing to value-driven and gift buyers at once.
Baby girls’ apparel drives higher decorative and occasion-specific demand with wider color and print variety. This supports premium pricing on dresses and sets. Baby boys’ apparel emphasizes durability and casual function. Brands balancing both gendered lines against a strong unisex core spread demand risk. The two gendered segments hold the remaining share collectively across mass and premium tiers.
Price Range Analysis
Mass Market dominates with 58.80% due to cost-per-wear value sensitivity.
In 2025, Mass Market held a dominant market position in the By Price Range segment of Baby Apparels Market, with a 58.80% share. As per our research, parents replace infant sizes every 6 to 10 weeks at peak growth. This short wear window caps willingness to pay. Therefore volume-led mass brands win the largest share by aligning price with realized garment utility.
Mid-premium, the fastest-growing tier, blends safety credentials with affordability for aspirational parents. IMF data links rising urban disposable income in Asia-Pacific to trade-up behavior in child goods. This lifts mid-tier demand. Brands positioning certified fabrics at accessible prices capture parents leaving pure value products. Premium and luxury hold the remaining share collectively, concentrated in gifting and occasion buying.
Distribution Channel Analysis
Offline Retail Stores dominate with 61.30% due to tactile fit and safety checks.
In 2025, Offline Retail Stores held a dominant market position in the By Distribution Channel segment of Baby Apparels Market, with a 61.30% share. As per our research, most parents inspect fabric and sizing physically before buying infant wear. This tactile preference sustains store demand. Therefore brands with strong retail placement retain access to first-time and safety-focused buyers.
Online and e-commerce, the fastest-growing channel, expands reach and convenience for repeat replenishment. According to IRP Commerce, the baby and child e-commerce market reported sales growth of +25.44% year-on-year in May 2026, while average order value fell 5.76% to £771.13. This signals higher volume at tighter basket sizes. Brands optimizing subscription and reorder flows capture this shift. In May 2025, JCPenney launched an exclusive PROUDLY baby collection, showing how retailers blend online and store assortments to defend share.
End User Analysis
Individual Consumers dominate with 88.60% due to direct household purchasing.
In 2025, Individual Consumers held a dominant market position in the By End User segment of Baby Apparels Market, with an 88.60% share. As per our research, household caregivers make nearly all routine infant apparel decisions. This concentrates demand in retail and D2C channels. Therefore brands prioritize consumer-facing marketing and loyalty over institutional sales pipelines.
Institutional buyers such as hospitals and daycare centers form a smaller but stable procurement base. These buyers value bulk pricing, durability, and compliance certification over style. Brands serving this tier gain predictable recurring orders that offset consumer seasonality. Institutional buyers hold the remaining share collectively.
Sales Channel Analysis
Supermarkets and Hypermarkets dominate with 27.80% due to convenience and price scale.
In 2025, Supermarkets and Hypermarkets held a dominant market position in the By Sales Channel segment of Baby Apparels Market, with a 27.80% share. As per our research, these outlets bundle grocery and baby-essential trips for busy parents. This convenience drives volume. Therefore brands securing shelf space in large-format retail reach the widest everyday buyer base.
Specialty baby stores offer curated assortments and expert guidance that build trust with new parents. Online marketplaces, the fastest-growing channel, expand assortment breadth and price transparency. According to ITC Trade Map, cross-border infant garment flows continue rising through digital platforms. This favors brands with strong marketplace presence.
Brand-owned stores let manufacturers control experience and capture full margin, while department stores anchor premium and gifting demand. In January 2025, Boots launched the Maybe Junior collection with Mollie King, rolling out to 410 stores alongside a Maybe Baby range in 230 UK stores. This shows how multi-channel expansion drives reach. Brand-owned and department stores hold the remaining share collectively.
Key Market Segments
By Product Type
- Outerwear (T-shirts, Dresses, Tops, Bottoms)
- Bodysuits and Onesies
- Sleepwear and Nightwear
- Innerwear and Undergarments
- Socks, Mittens and Accessories
By Material Type
- Cotton
- Organic Cotton
- Wool
- Synthetic Fibers
- Others
By Age Group
- Infants (0 to 12 Months)
- Toddlers (1 to 3 Years)
- Newborns (0 to 3 Months)
- Preschoolers (3 to 5 Years)
By Gender
- Unisex Apparel
- Baby Girls
- Baby Boys
By Price Range
- Mass Market
- Mid-Premium
- Premium/Luxury
By Distribution Channel
- Offline Retail Stores
- Online/E-commerce
By End User
- Individual Consumers
- Institutional Buyers (Hospitals, Daycare Centers)
By Sales Channel
- Supermarkets and Hypermarkets
- Specialty Baby Stores
- Online Marketplaces
- Brand-Owned Stores
- Department Stores
Regional Analysis
Asia-Pacific Dominates the Baby Apparels Market with a Market Share of 39.70%, Valued at USD 27.20 Billion
Asia-Pacific leads the Baby Apparels Market with a 39.70% share worth USD 27.20 Billion, powered by large birth cohorts and an expanding middle class. Markets led by India and Southeast Asia combine rising incomes with strong family spending on children. This concentrates volume in the region. Therefore global brands must localize distribution and pricing here to defend and grow share. In March 2026, Kidbea raised Rs 30 Crore, around $3.2 Million, to expand its sustainable kidswear brand, signaling active investor confidence in the region.
Urban India stands out as a fast-growing pocket where organic and mid-premium demand rises with disposable income. Millennial and Gen Z parents there premiumize infant wardrobes aggressively. This lifts average selling prices. Brands entering with certified, D2C-led propositions can capture trade-up buyers before mass competitors adjust their assortments.
Key Regions and Countries
North America
- US
- Canada
Europe
- Germany
- France
- The UK
- Spain
- Italy
- Rest of Europe
Asia Pacific
- China
- Japan
- South Korea
- India
- Australia
- Rest of APAC
Latin America
- Brazil
- Mexico
- Rest of Latin America
Middle East and Africa
- GCC
- South Africa
- Rest of MEA
Market Dynamics
Market Opportunity Analysis - Underexploited channels, fibers, and frontier regions open clear entry lanes for new players
Organic Cotton, at 18.90% of By Material Type and the fastest-growing fiber, remains underexploited outside premium tiers. Most brands still anchor volume in conventional cotton. This leaves the mid-market open to certified organic essentials at accessible prices. New entrants that scale organic sourcing early can own the fast-growing safety-led segment before mass players convert their supply chains.
Online and e-commerce sits underexploited against Offline Retail Stores at 61.30% of By Distribution Channel demand. Physical retail still dominates infant apparel buying. This gap signals room for digital-first brands to grow the fastest channel aggressively. New players building subscription and reorder flows online can capture repeat replenishment demand that store-led incumbents serve poorly.
The Sub-Saharan Africa frontier remains structurally underserved relative to Asia-Pacific’s 39.70% regional lead. Organized retail penetration there stays thin despite rising birth cohorts. This creates long-window entry potential for first movers. Brands establishing distribution partnerships now can capture organized-retail share before global competitors prioritize these markets.
Preschoolers, the fastest-growing By Age Group cohort behind Infants at 42.30%, offer an underexploited graduation path. Many infant brands lose customers as children age out. This means brands extending assortments into preschool sizing retain existing parent relationships. Early movers convert one-time infant buyers into multi-year customers, lifting lifetime value across the growth cycle.
Technology and Innovation Landscape - Certification systems and material innovation reshape competitive advantage in infant apparel
Certified sustainable fiber tracking now defines credible baby apparel supply. The U.S. Cotton Trust Protocol delivered a 28% reduction in energy use and a 25% cut in greenhouse gas emissions against the 2015 baseline, meeting or exceeding 5 of 6 national sustainability goals. This gives brands verifiable environmental data. Manufacturers using tracked cotton win premium positioning as parents demand proof over claims.
Chemical-safety certification technology raises the compliance bar for skin-contact infant fabrics. Effective April 2025, OEKO-TEX STANDARD 100 cut the permissible Bisphenol A limit in textiles from 100 mg/kg to 10 mg/kg, a tenfold tightening. This forces upgraded testing across baby apparel supply chains. Brands adopting stricter testing early protect market access and reduce recall exposure in regulated regions.
Soil and input management innovation strengthens raw-material resilience. Trust Protocol cotton fields showed an 89% reduction in soil loss, with 57% of acres under no-till or conservation tillage and 84% applying 4R nutrient management. This lowers the chemical and erosion burden in cotton supply. Brands sourcing from these systems secure more stable, defensible fiber inputs against climate volatility.
Adaptive-sizing and grow-with-me garment design tackles the short wear window head-on. These innovations extend usable life by 3 to 5 months per garment. This directly counters the cost-per-wear resistance that caps pricing. Brands investing in functional design can justify higher price points and differentiate from commodity essentials that offer no lifecycle advantage.
Drivers
Millennial and Gen Z parents now form the dominant baby apparel buying group and spend about 18% more per child than baby boomer parents did at equal income. This shift treats infant clothing as a lifestyle statement, not just a functional buy. In India, urban households spend ₹30,000 to ₹60,000 yearly per child on 0 to 2 year essentials, while U.S. first-year spend averages $600 to $900. Brands that lead with storytelling and social commerce capture these premium buyers first.
Gifting demand reinforces this driver, since 35% to 40% of purchases are gifts commanding a 20% to 35% price premium. Gift buyers show lower price sensitivity and higher brand response than routine caregivers. This means occasion marketing lowers customer acquisition cost by 30% to 40% versus generic search ads. Brands building curated gift bundles convert one-time givers into repeat customers efficiently.
| Driver | (~) % Impact on CAGR Forecast | Geographic Relevance | Impact Timeline |
|---|---|---|---|
| Millennial & Gen Z Parenting Premium Spending Shift | +1.8% | Global, led by India, United States, China, Western Europe | Short term (≤ 2 years) |
| Rising Birth Rates & Growing Middle-Class Population in Asia-Pacific | +1.2% | India, Southeast Asia, Sub-Saharan Africa, Middle East | Short term (≤ 2 years) |
| E-Commerce & D2C Channel Expansion Lowering Market Entry Barriers | +0.9% | India, China, United States, Southeast Asia | Short term (≤ 2 years) |
| Organic & Chemical-Free Baby Fabric Demand Driving Per-Unit ASP Uplift | +0.6% | Europe, North America, Urban India, Japan | Medium term (2–4 years) |
| Gifting Culture & Occasion-Specific Baby Apparel Demand | +0.4% | Global, concentrated in North America, Europe, Gulf States | Short term (≤ 2 years) |
Restraints
Birth rates are falling structurally in the highest-spending markets, including the United States, China, South Korea, Japan, Germany, and Italy. All now sit below the 2.1 replacement rate needed for population stability. South Korea’s fertility rate fell to about 0.72 in 2023, while China’s birth rate declined for the seventh straight year through 2024. This shrinks the premium buyer base that brands depend on most.
The revenue math is direct and painful for global sellers. A 10% drop in annual births in Germany or South Korea, where per-child spend runs €500 to €750, cuts addressable demand proportionally. Premiumization alone cannot offset lost unit volume. This forces brands to redirect marketing and distribution spend toward growing birth cohorts in South and Southeast Asia, a pivot needing 2 to 4 years of supply chain restructuring.
| Restraint | (~) % Impact on CAGR Forecast | Geographic Relevance | Impact Timeline |
|---|---|---|---|
| Structural Birth Rate Decline in High-Spending Developed Markets | -1.3% | China, South Korea, Japan, Germany, Italy, United States | Long term (≥ 4 years) |
| Cotton Supply Tightening & Apparel Input Cost Inflation | -0.8% | Global, most acute in India, Bangladesh, Pakistan sourcing | Short term (≤ 2 years) |
| Stringent Child Product Safety Regulations Raising Compliance CapEx | -0.5% | United States (CPSIA), European Union (REACH/GPSR) | Medium term (2–4 years) |
| Rising Cost of Living Compressing Discretionary Parental Spending | -0.4% | United Kingdom, United States, Europe, Australia | Short term (≤ 2 years) |
| Import Tariffs & Trade Policy Uncertainty Disrupting Sourcing Economics | -0.3% | United States, European Union | Short term (≤ 2 years) |
Challenges
Infants cycle through 4 to 6 size brackets within their first 24 months, with each garment useful for only 6 to 10 weeks at peak growth. This short window depresses realized per-unit value because parents cap what they pay for clothes that get outgrown fast. A premium organic romper at ₹1,200 to ₹2,500 may deliver fewer than 25 to 35 wears. This limits average selling price growth even in premium tiers.
Resale recovery of only 20% to 35% of retail price reinforces cost-per-wear thinking among millennial parents. This squeezes margins in entry and mid-tier segments. Brands can lift margin only through emotional premium, such as gifting, or grow-with-me designs that extend wear windows by 3 to 5 months. This creates a clear revenue opening in subscription replenishment, bundles, and resale trade-in programs.
| Challenge | (~) % CAGR Friction Drag | Geographic Relevance | Mitigation Horizon |
|---|---|---|---|
| Rapid Size Obsolescence & Replacement Cycle Churn | -0.5% | Global, acute in premium and organized retail segments | Medium term (2–4 years) |
| Counterfeit & Unorganized Market Penetration | -0.4% | India, Southeast Asia, Middle East, Africa | Long term (≥ 4 years) |
| Fragmented Multi-Regulatory Compliance Complexity | -0.4% | Global cross-border exporters serving US, EU, Gulf markets | Medium term (2–4 years) |
| Social Media Trend Velocity vs. Inventory Cycles | -0.3% | United States, Europe, India, China | Medium term (2–4 years) |
| Skilled Textile & Design Talent Shortage | -0.2% | India, Bangladesh, Vietnam manufacturing hubs | Long term (≥ 4 years) |
Opportunities
The baby clothing resale segment is expanding at a CAGR of about 12.4%, yet original brands capture zero percent of that transaction value today. Peer-to-peer and third-party platforms hold the activity. This leaves a clear first-party white space. Brands launching trade-in and recommerce programs can intercept an estimated 20% to 30% of secondhand volume while reaching price-sensitive buyers who trust branded pre-owned goods.
The unit economics reward early movers strongly. Brand-authenticated used garments can reach 60% to 75% gross margin versus 40% to 55% on new product, since reconditioning costs only 10% to 15% of resale price. Parents using branded resale show 35% to 50% higher retention. This turns an unmonetized secondary market into a loyalty flywheel that extends the customer relationship beyond one infant’s early years.
| Opportunity | (~) % Potential CAGR Upside | Geographic Relevance | Execution Window |
|---|---|---|---|
| Branded Baby Clothing Resale & Circular Commerce Platform Integration | +1.2% | North America, Europe, India, Australia | Medium term (2–4 years) |
| Gender-Neutral & Inclusive Apparel Range Expansion | +0.6% | United States, Europe, Urban India, Canada, Australia | Short term (≤ 2 years) |
| Subscription-Based Baby Apparel Replenishment Model | +0.5% | United States, Europe, India | Medium term (2–4 years) |
| Sub-Saharan Africa & Frontier Market Organized Retail Penetration | +0.4% | Nigeria, Ethiopia, Kenya, DRC, Tanzania | Long term (≥ 4 years) |
| Smart & Functional Baby Apparel Innovation (Wearable Sensors, Adaptive Sizing) | +0.3% | United States, Japan, South Korea, Germany | Long term (≥ 4 years) |
Key Company Insights
Carter’s, Inc. holds a structural advantage through deep brand trust in core infant essentials and broad multi-channel retail reach. In July 2025, the company launched Otter Avenue, a toddler brand built to help children dress themselves. This move extends its customer relationship past infancy and defends share as buyers age up. However, heavy exposure to slowing North American birth cohorts leaves the brand reliant on premiumization and category expansion to sustain revenue growth.
The Children’s Place, Inc. competes on value pricing and high-frequency assortment turnover across a large store and digital footprint. This positioning captures mass-market and cost-sensitive parents who prioritize cost-per-wear in short garment lifecycles. Strong promotional cadence sustains traffic and repeat purchase volume. However, thin margins and limited premium positioning expose the company to input-cost inflation and tariff pressure, leaving less room to absorb sourcing shocks than higher-margin rivals.
Key Players
- Carter’s, Inc.
- The Children’s Place, Inc.
- Gap Inc.
- H&M Group
- Zara (Inditex)
- Mothercare plc
- Gerlach Children’s Wear
- Primark
- Nike, Inc.
- Adidas AG
- Benetton Group
- Gymboree Group
- Ralph Lauren Corporation
- Jockey International
- Kiabi
Recent Developments
- January 2025: Boots launched the Maybe Junior clothing collection with Mollie King for toddlers and children up to 6 years old, while adding 60 new styles to the Maybe Baby Spring Summer 2025 range.
- January 2025: Boots confirmed the combined Maybe Junior and Maybe Baby SS25 offer included 89 pieces priced from £6, with Maybe Junior launching in 410 stores and Maybe Baby SS25 available in 230 UK stores.
- March 2026: Kidbea raised Rs 30 Crore, around $3.2 Million, in Series A funding led by Enrission India Capital to expand its sustainable kidswear and childcare brand.
Geopolitical Impact Analysis
According to the U.S. Trade Representative, Section 301 tariffs now cover roughly 40% of U.S. imports, including 70% of textile and apparel imports from China. As reported by the USITC, U.S. woven apparel imports from China fell 14.7% under this pressure. This reshapes infant garment sourcing directly, since China supplies a large share of low-cost baby cotton basics. Brands are rerouting production to India, Bangladesh, and Vietnam to protect landed-cost economics and shelf pricing.
Based on WTO data, global merchandise trade growth remains under strain from shipping disruption and rerouting around key maritime corridors. As reported by the World Shipping Council, Red Sea diversions have added roughly 10 to 14 days to Asia-to-Europe transit, lifting freight costs sharply. This raises delivered costs for cotton baby apparel moving from Asian hubs to European retailers. Consequently brands hold larger safety stock and localize sourcing to shield margins from logistics volatility.
Report Scope
| Report Features | Description |
|---|---|
| Market Value (2025) | USD 68.40 Billion |
| Forecast Revenue (2035) | USD 111.40 Billion |
| CAGR (2026-2035) | 5.0% |
| Base Year for Estimation | 2025 |
| Historic Period | 2020-2024 |
| Forecast Period | 2026-2035 |
| Report Coverage | Revenue Forecast, Market Dynamics, Market Opportunity Analysis, Technology and Innovation Landscape, Competitive Landscape, Recent Developments |
| Segments Covered | By Product Type (Outerwear, Bodysuits and Onesies, Sleepwear and Nightwear, Innerwear and Undergarments, Socks Mittens and Accessories), By Material Type (Cotton, Organic Cotton, Wool, Synthetic Fibers, Others), By Age Group (Infants 0 to 12 Months, Toddlers 1 to 3 Years, Newborns 0 to 3 Months, Preschoolers 3 to 5 Years), By Gender (Unisex Apparel, Baby Girls, Baby Boys), By Price Range (Mass Market, Mid-Premium, Premium/Luxury), By Distribution Channel (Offline Retail Stores, Online/E-commerce), By End User (Individual Consumers, Institutional Buyers), By Sales Channel (Supermarkets and Hypermarkets, Specialty Baby Stores, Online Marketplaces, Brand-Owned Stores, Department Stores) |
| Regional Analysis | North America (US and Canada), Europe (Germany, France, The UK, Spain, Italy, and Rest of Europe), Asia Pacific (China, Japan, South Korea, India, Australia, and Rest of APAC), Latin America (Brazil, Mexico, and Rest of Latin America), Middle East and Africa (GCC, South Africa, and Rest of MEA) |
| Competitive Landscape | Carter’s Inc., The Children’s Place Inc., Gap Inc., H&M Group, Zara (Inditex), Mothercare plc, Gerlach Children’s Wear, Primark, Nike Inc., Adidas AG, Benetton Group, Gymboree Group, Ralph Lauren Corporation, Jockey International, Kiabi |
| Customization Scope | Customization for segments, region / country-level will be provided. Additional customization can be done based on requirements. |
| Purchase Options | We have three licenses to opt for: Single User License | Multi-User License (Up to 5 Users) | Corporate Use License (Unlimited User and Printable PDF) |





































