


Report Overview
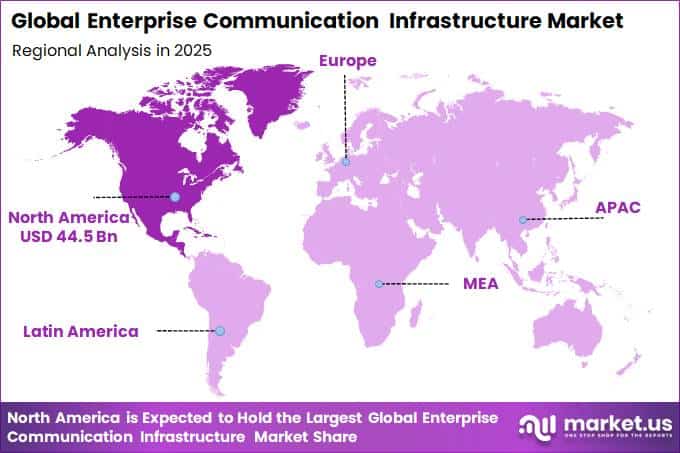
In 2025, the Global Enterprise Communication Infrastructure Market was valued at USD 115.1 billion. The market is projected to grow at a CAGR of 16.7% during 2026–2035, reaching approximately USD 539.1 billion by 2035. North America dominated the global market in 2025, accounting for more than 38.7% of the total market share and generating approximately USD 44.5 billion in revenue.
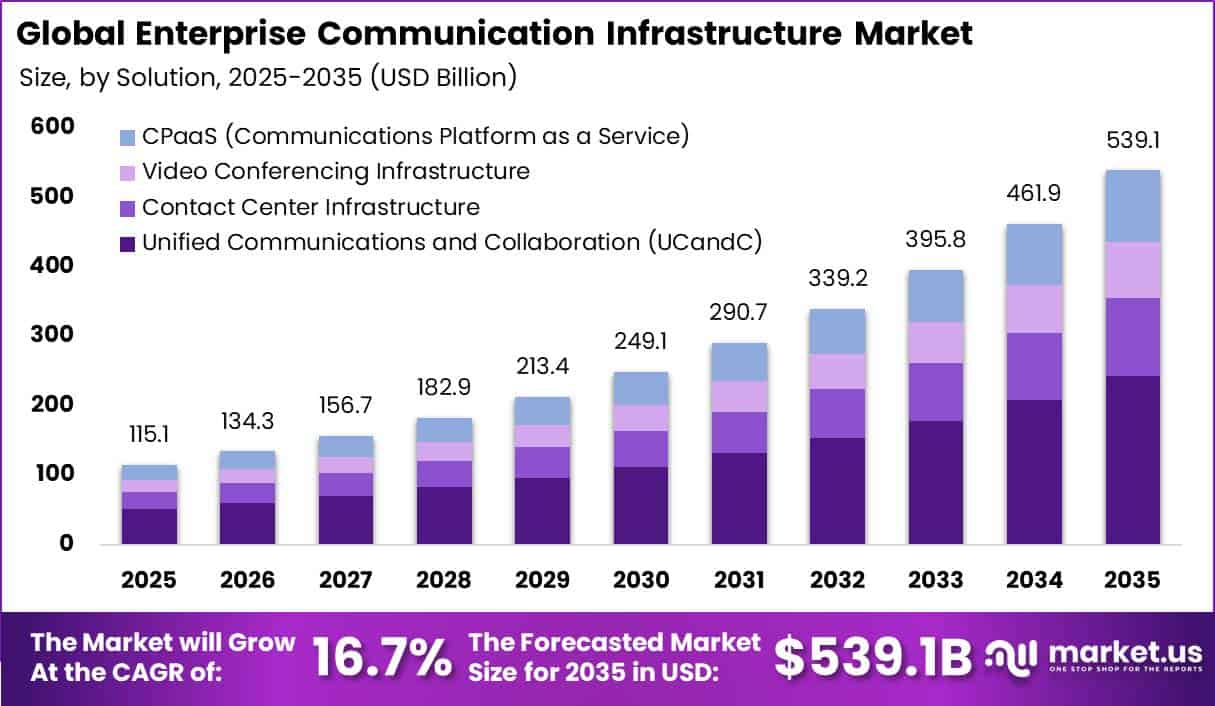
Market growth is supported by rapid digital adoption across businesses worldwide. According to the International Telecommunication Union, around 6 billion people used the internet in 2025, compared with 5.8 billion in 2024, meaning nearly three-quarters of the global population is now connected. This expanding digital user base is increasing enterprise demand for stronger networks, cloud communication systems, and collaboration platforms.
Mobile connectivity is also supporting market expansion. Global 5G connections exceeded 2.7 billion by the end of 2025, while subscriptions approached 3.3 billion by mid-2026. At the same time, 5G accounted for 48% of global mobile data traffic, encouraging enterprises to upgrade internal networks, video conferencing systems, unified messaging platforms, and data infrastructure.
Enterprises are increasingly investing in AI-enabled contact centers, cloud PBX systems, and video-based collaboration solutions. Global 5G coverage has reached 60% of the population, supported by around 400 million new users in 2025, further strengthening demand for faster and more reliable enterprise communication infrastructure.
Key Takeaway
- Enterprise Communication Infrastructure Market is valued at USD 115.1 billion in 2025, projected to reach USD 539.1 billion by 2035 at a 16.7% CAGR.
- Unified Communications and Collaboration (UC&C) led the market with a 45.2% share.
- Cloud deployment dominated the market with a 63.2% share.
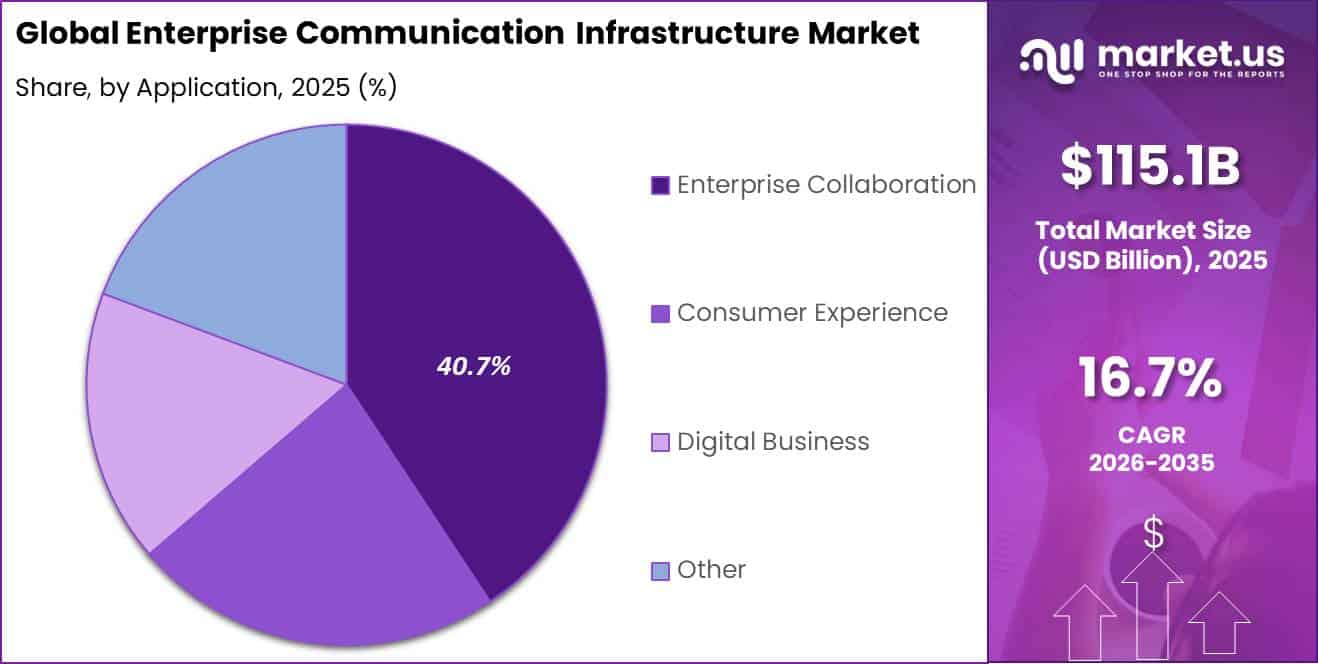
- Enterprise Collaboration captured the leading position with a 40.7% share.
- Large Enterprises accounted for the largest share at 54.3%.
- IT and Telecommunications led the end-use segment with a 20.8% share.
- North America led the market in 2025 with a 38.7% share and USD 44.5 billion in revenue.
Market Statistics and Data Insights
- In 2025, 52.74% of EU enterprises used paid cloud computing services. Cloud adoption reached 84.67% among large enterprises, while 75.04% of large firms used cloud-hosted email services. These figures directly support the migration of enterprise communications toward cloud infrastructure.
- In the United States, 35.38 million people, or 22.4% of people at work, teleworked or worked from home for pay in 2025. The rate increased to 37.2% for management, professional, and related occupations, showing a large continuing requirement for secure remote communication infrastructure.
- International trade in digitally deliverable services increased by 10% in 2025. Developed economies exported approximately USD 4.1 trillion of these services, while developing economies exported around USD 1.3 trillion, creating substantial demand for cross-border digital communication and cloud infrastructure.
- In 2024, 52.9% of EU enterprises with 10 or more employees conducted online meetings, increasing by 2.9 percentage points from 2022. Among large enterprises, 94.36% held online meetings, showing how video communication has become embedded in large-company operations.
- Around 60.2% of EU enterprises provided employees with all 3 major forms of remote access in 2024. The rate reached 91.9% among large enterprises and 78.2% among medium-sized enterprises, supporting demand for secure enterprise connectivity and identity infrastructure.
- In 2024, 81.02% of EU enterprises provided remote access to corporate email, 69.01% provided access to company documents, and 65.57% provided access to business applications or software. These usage patterns support unified collaboration, VPN, identity, and cloud-network spending.
- BLS data show that 34.5% of employed Americans who worked on an average day performed some work at home in 2025. The share reached 51.4% for workers with a bachelor’s degree or higher and 56.7% for those with an advanced degree.
- Among EU enterprises using paid cloud services in 2025, 85.2% used cloud-based e-mail, 71.7% used cloud office software, and 71.5% used cloud file storage, directly showing how communication and collaboration workloads are shifting to cloud infrastructure.
- Zoom Phone surpassed 10 million cloud-telephony seats worldwide in October 2025, providing a direct usage indicator for enterprise migration from traditional PBX infrastructure toward cloud-based voice platforms.
By Solution
The Unified Communications and Collaboration (UC&C) segment held a dominant market position, capturing a 45.2% share. This strong position is mainly supported by the growing adoption of hybrid and remote working models. According to the U.S. Bureau of Labor Statistics, 22.4% of the U.S. workforce teleworked in 2025, while the share reached 37.2% among managers and professional workers.
This shift is encouraging companies to combine meetings, voice calls, messaging, video conferencing, and file sharing within a single digital platform rather than using separate communication systems. Cloud adoption is also strengthening demand for UC&C solutions.
According to the OECD, cloud computing is used by 49% of firms with 10 or more employees, providing the digital infrastructure required to deliver voice, video, chat, and collaboration services through connected platforms.
By Deployment Model
The Cloud deployment segment held a dominant market position, capturing a 63.2% share. This leadership is supported by the steady shift of enterprise communication systems from on-site infrastructure to large-scale cloud and data center environments.
According to the U.S. Census Bureau, private data center construction reached a record annualized rate of USD 50.7 billion in April 2026, increasing 27.4% year-on-year and rising nearly 4 times from USD 9.9 billion in 2021.
This rapid expansion shows growing demand for cloud capacity, as voice, video, messaging, and collaboration workloads increasingly move away from physical office servers. In Europe, Eurostat reported that 52.74% of EU enterprises used paid cloud services in 2025, representing a 7.42 percentage-point increase from 2023. Cloud adoption among large enterprises was even higher at 84.67%.
By Application
The Enterprise Collaboration segment held a dominant market position, capturing a 40.7% share. This leadership is supported by the growing need for real-time coordination across distributed teams, offices, and international operations. According to Eurostat, 52.9% of EU enterprises with 10 or more employees conducted online meetings in 2024, increasing by nearly 3 percentage points from 2022.
At the same time, 69.01% of enterprises provided employees with remote access to company documents. This trend is also supported by the expansion of global service-based business activity. World Bank data shows that global services trade increased by 7.8% in 2025, while ICT services grew by 9.6%.
Professional and technical services also recorded online-meeting adoption of 84.2%, showing particularly strong use of collaboration tools in sectors where teamwork, project coordination, and client communication are central to daily operations.
By Organization Size
The Large Enterprises segment held a dominant market position, capturing a 54.3% share. This leadership is mainly supported by the higher operational complexity of large organizations and their greater need for advanced communication infrastructure. According to Eurostat, 88.71% of large EU enterprises use ERP software and 69.24% use Business Intelligence systems, compared with only 41.08% and 11%, respectively, among small enterprises.
This creates an adoption gap of more than 48 percentage points. Large companies often operate several connected systems, including ERP, CRM, and BI platforms, which require reliable communication networks, secure data links, video systems, and unified collaboration tools to work efficiently across departments. The scale of major global companies further supports this demand.
Fortune Global 500 companies generated around USD 43.1 trillion in combined revenue in 2025 and employed approximately 70.2 million people. Managing such large workforces across different countries and time zones increases the need for secure networks, system redundancy, high-capacity communication platforms, and enterprise-grade collaboration infrastructure, supporting higher spending compared with smaller organizations.
By End-User Industry
The IT and Telecommunications segment held a dominant market position, capturing a 20.8% share. This leadership is supported by the sector’s direct role in operating and expanding the digital infrastructure used by other industries. IT and telecom companies manage large networks, switching systems, data platforms, and communication tools.
According to the International Energy Agency, global data center electricity consumption reached around 485 TWh in 2025, increasing 17% year-on-year, while electricity use at hyperscale AI facilities increased by 50% during the same period. This rising computing demand requires continuous investment in high-capacity communication infrastructure and reliable connectivity.
The IEA also reported that Meta, Amazon, Alphabet, and Microsoft committed around USD 320 billion to AI and data center investment in 2025, compared with USD 230 billion in the previous year. As digital infrastructure expands, IT and telecom firms continue upgrading internal communication and coordination platforms.
Key Market Segments
By Solution
- Unified Communications and Collaboration (UC&C)
- Contact Center Infrastructure
- Video Conferencing Infrastructure
- CPaaS (Communications Platform as a Service)
By Deployment Model
- Cloud
- On-Premises
By Application
- Enterprise Collaboration
- Consumer Experience
- Digital Business
- Other
By Organization Size
- Large Enterprises
- Small and Medium Enterprises (SMEs)
By End-User Industry
- IT and Telecommunications
- BFSI
- Healthcare
- Retail and E-commerce
- Government and Education
- Others
Geopolitical Impact Analysis
Rising trade barriers are increasing costs across the Enterprise Communication Infrastructure Market, particularly for networking hardware and semiconductor components. Under the current U.S. tariff structure, China-origin semiconductors and integrated circuits face a combined duty of around 60%, including a 50% Section 301 surcharge and a 10% Section 122 tariff.
Connectors, printed circuit boards, and passive components carry an additional 35% duty, while routers and switches face an effective tariff of around 37.5%. Since July 2026, the FCC’s expanded Covered List has also restricted new imports of communication equipment from Huawei, ZTE, Hytera, and Hikvision. This is pushing vendors toward alternative suppliers in Taiwan, Vietnam, and India.
WTO-IMF data shows that global trade-restrictive policy activity between January and May 2026 was nearly 2 times the 2024 level and 25% above the 2025 average, reaching its highest level since 2008. Maritime disruptions are adding further pressure to supply chains. Red Sea security risks have forced many container carriers to reroute around the Cape of Good Hope, adding around 10 to 14 days and approximately USD 1 million to USD 2.5 million in fuel costs per voyage.
Round-trip shipping times have increased from nearly 70 days to around 90–100 days. UNCTAD also recorded a 42% decline in Suez Canal transits and a 67% fall in weekly container transits during the initial disruption. These conditions are extending delivery times for servers, PBX systems, and fiber-optic equipment, encouraging regional sourcing and greater adoption of cloud-based communication infrastructure.
Regional Analysis
North America held a dominant position in the Enterprise Communication Infrastructure Market, capturing a 38.7% share and generating approximately USD 44.5 billion in revenue in 2025. The region’s leadership is supported by its well-developed broadband and fiber infrastructure. According to the Fiber Broadband Association, fiber networks passed 84.6 million U.S. homes by year-end 2025, representing an annual growth rate of 11%.
Around 95% of fiber subscribers also received internet speeds of 200 Mbps or higher. This strong connectivity base allows enterprises to adopt and regularly upgrade unified communications, cloud PBX, video conferencing, and other collaboration systems, supporting North America’s leading market position.
Asia Pacific is the fastest-growing region, supported by rapid digitalization and expanding internet connectivity. According to the ITU, internet penetration across Asia and the Pacific reached 66% in 2024, while connectivity expanded at an average annual rate of 10.7% since 2005, compared with the 8% global average.
India crossed 1 billion broadband subscribers by November 2025, while total telephone subscribers increased to 1,330.58 million by March 2026, recording monthly growth of 0.70%. As more consumers, employees, and businesses connect across India, China, and Southeast Asia, enterprises are increasing investment in networking hardware, cloud collaboration platforms, and mobile-first communication tools, strengthening Asia Pacific’s long-term growth potential.
Key Regions and Countries
North America
- US
- Canada
Europe
- Germany
- France
- The UK
- Spain
- Italy
- Rest of Europe
Asia Pacific
- China
- Japan
- South Korea
- India
- Australia
- Rest of APAC
Latin America
- Brazil
- Mexico
- Rest of Latin America
Middle East & Africa
- GCC
- South Africa
- Rest of MEA
Market Dynamics
Drivers
| Driver | (~) % CAGR | Geographic Relevance | Impact Timeline |
|---|---|---|---|
| AI-ready data-center networking | +2.4% | Global | Short term (2 years or less) |
| Cloud UC migration | +1.9% | North America and Europe | Short term (2 years or less) |
| Enterprise fiber densification | +1.5% | North America and Asia Pacific | Medium term (2 to 4 years) |
| Private wireless adoption | +1.2% | North America, Europe and East Asia | Medium term (2 to 4 years) |
| Hybrid workforce coordination | +1.0% | Global | Short term (2 years or less) |
AI-ready data-center networking
AI deployment is changing enterprise communication infrastructure by increasing demand for high-speed, low-latency networks. The IEA projects global data-center electricity demand to increase from 485 TWh in 2025 to around 950 TWh by 2030, reaching nearly 3% of global electricity demand.
Cisco also reported that AI-infrastructure orders from webscale customers exceeded USD 2 billion in fiscal 2025, more than 2 times its original USD 1 billion annual target. Growing AI workloads require more switching capacity, optical interconnects, security systems, and network bandwidth. IBM invested USD 8.3 billion in R&D in 2025, supporting development across AI and hybrid-cloud technologies.
As enterprises expand AI-connected workflows, spending is shifting toward recurring software, automation, observability, and managed network services. This trend could contribute an estimated +2.4% incremental upside to the market’s baseline CAGR.
Restraints
| Restraint | (~) % CAGR | Geographic Relevance | Impact Timeline |
|---|---|---|---|
| Telecom capital-spending cuts | -2.1% | Europe and Asia Pacific | Short term (2 years or less) |
| Restricted telecom equipment approvals | -1.5% | North America and Europe | Short term (2 years or less) |
| High financing costs | -1.2% | Global | Medium term (2 to 4 years) |
| Legacy PBX replacement deferrals | -0.9% | Global | Medium term (2 to 4 years) |
| Public-sector procurement constraints | -0.7% | North America and Europe | Medium term (2 to 4 years) |
Telecom capital-spending cuts
Telecom operator investment restraint is creating near-term pressure on infrastructure orders, as carriers remain major buyers of routing, radio, optical, and network-management systems. NEC reported that restrained telecom investment affected its Telecom Services business in the fiscal year ending March 2025, despite company revenue reaching JPY 3,423.4 billion.
AT&T also reported an 8.4% decline in Business Wireline revenue to USD 17.2 billion in 2025. Verizon recorded a similar trend, with Business segment revenue declining 1.6% to USD 29.1 billion in 2025.
When telecom operators prioritize spectrum purchases, fiber integration, or debt reduction, network upgrades can be delayed, reducing equipment orders and extending enterprise deployment cycles. This investment restraint could create an estimated -2.1% drag on the market’s baseline CAGR in the short term.
Challenges
| Challenge | (~) % CAGR | Geographic Relevance | Mitigation Horizon |
|---|---|---|---|
| Data-center power availability | -1.8% | Global | Long term (4 years or more) |
| Cybersecurity skills shortage | -1.3% | Global | Medium term (2 to 4 years) |
| Interoperability integration complexity | -1.1% | Global | Medium term (2 to 4 years) |
| Optical component lead times | -0.8% | North America, Europe and Asia Pacific | Short term (2 years or less) |
| Cross-border data governance | -0.7% | Europe, Middle East and Asia Pacific | Long term (4 years or more) |
Data-center power availability
Power availability is becoming a major challenge for AI-enabled communication infrastructure as network expansion increasingly depends on data-center capacity. The IEA projects global data-center electricity consumption to rise from 485 TWh in 2025 to around 950 TWh by 2030.
In the European Union, electricity demand is also expected to increase at an average annual rate of 2.3% through 2030, adding pressure on power grids and transmission systems. Grid connection delays, limited transmission capacity, and long construction timelines can slow new data-center and AI infrastructure projects.
The U.S. Department of Energy has also identified data centers as an important source of new electricity demand. These constraints can delay cloud regions, AI clusters, switches, optical links, and collaboration infrastructure, creating an estimated -1.8% drag on the market’s achievable growth until additional generation and grid capacity becomes available.
Opportunities
| Opportunity | (~) % CAGR | Geographic Relevance | Execution Window |
|---|---|---|---|
| Rural broadband enterprise edge | +2.2% | North America | Medium term (2 to 4 years) |
| Regulated industry sovereign UC | +1.8% | Europe, Middle East and Asia Pacific | Medium term (2 to 4 years) |
| Network-as-a-service bundles | +1.6% | Global | Short term (2 years or less) |
| Private network verticals | +1.4% | Asia Pacific, Europe and North America | Long term (4 years or more) |
| Communications compliance automation | +1.1% | Europe and North America | Medium term (2 to 4 years) |
Rural broadband enterprise edge
Rural broadband enterprise edge infrastructure remains a future growth opportunity rather than a major current market driver. The U.S. NTIA obligated the full USD 42.45 billion BEAD allocation to 56 states and territories by December 2024, while the Congressional Research Service reported that no BEAD deployment funding had reached projects as of August 2025.
Centralized network management could reduce field-service requirements and improve gross-margin potential by an estimated 5% to 10% compared with fragmented on-premises support. This delayed broadband investment cycle could provide approximately +2.2% additional CAGR upside over the medium term.
Key Players Analysis
Tier-1 companies lead the Enterprise Communication Infrastructure Market through large-scale operations, strong R&D spending, and integrated communication platforms. Cisco Systems generated USD 56.65 billion in total revenue in fiscal 2025, including USD 4.15 billion from Collaboration and USD 28.3 billion from Networking. The company also invested a record USD 9.3 billion in R&D, equal to 16.4% of revenue.
Microsoft’s Intelligent Cloud business reached USD 137.79 billion in FY2026, while Azure generated USD 101.94 billion, highlighting growing enterprise demand for cloud-hosted communication workloads. IBM invested more than USD 8.3 billion in R&D in 2025 against revenue of USD 67.5 billion, while Hybrid Cloud revenue increased 12.9% to USD 7.33 billion.
Telecom operators form another important competitive group. AT&T’s Business Wireline revenue reached USD 17.23 billion in 2025, declining 8.4%, while Mobility revenue increased 5.0% to USD 89.48 billion. Verizon Business generated USD 29.1 billion, including USD 13.5 billion, or around 46%, from Enterprise and Public Sector customers. NEC reported JPY 3,423.4 billion in FY25/3 revenue, increasing 5.3%.
Tier-2 players are focused on restructuring and specialized communication solutions. Avaya emerged from Chapter 11 bankruptcy in 2023, reduced debt by more than 75%, and secured USD 650 million in liquidity. Mitel remains a privately held, PE-backed competitor focused on replacing legacy unified communication systems.
Top Key Players in the Market
- Microsoft Corporation
- Orange SA
- Avaya Inc.
- IBM Corporation
- Cisco Systems Inc.
- Alcatel-Lucent SA
- Verizon Communications
- DXC Technology
- NEC Corporation
- 88 Inc.
- Mitel Network Corporation
- AT&T Corporation
Recent Developments
- In 2026, Verizon completed its acquisition of Frontier Communications on January 20 for total consideration of approximately USD 22.3 billion, including around USD 9.4 billion in cash and USD 12.9 billion of assumed debt. The combination expanded Verizon’s fiber footprint to approximately 30 million fiber passings across 31 states and Washington, D.C. This acquisition strengthens Verizon’s ability to provide fiber broadband, 5G, and converged connectivity services to enterprise and business customers.
- In 2026, AT&T completed its USD 5.75 billion all-cash acquisition of Lumen Technologies’ Mass Markets fiber business on February 2. The transaction added more than 1 million fiber subscribers and over 4 million fiber locations across 11 states.
Report Scope
| Report Features | Description |
|---|---|
| Market Value (2025) | USD 115.1 Billion |
| Forecast Revenue (2035) | USD 539.1 Billion |
| CAGR (2026-2035) | 16.7% |
| Base Year for Estimation | 2025 |
| Historic Period | 2020-2024 |
| Forecast Period | 2026-2035 |
| Report Coverage | Revenue Forecast, Market Dynamics, Competitive Landscape, Recent Developments |
| Segments Covered | By Solution (Unified Communications and Collaboration (UC&C), Contact Center Infrastructure, Video Conferencing Infrastructure, CPaaS); By Deployment Model (Cloud, On-Premises); By Application (Enterprise Collaboration, Consumer Experience, Digital Business, Other); By Organization Size (Large Enterprises, Small and Medium Enterprises (SMEs)); By End-User Industry (IT and Telecommunications, BFSI, Healthcare, Retail and E-commerce, Government and Education, Others) |
| Regional Analysis | North America – US, Canada; Europe – Germany, France, The UK, Spain, Italy, Rest of Europe; Asia Pacific – China, Japan, South Korea, India, Australia, Singapore, Rest of APAC; Latin America – Brazil, Mexico, Rest of Latin America; Middle East & Africa – GCC, South Africa, Rest of MEA |
| Competitive Landscape | Microsoft Corporation, Orange SA, Avaya Inc., IBM Corporation, Cisco Systems Inc., Alcatel-Lucent SA, Verizon Communications, DXC Technology, NEC Corporation, 88 Inc., Mitel Network Corporation, AT&T Corporation |
| Customization Scope | Customization for segments and region/country-level will be provided. Moreover, additional customization can be done based on the requirements. |
| Purchase Options | We have three licenses to opt for: Single User License, Multi-User License (Up to 5 Users), Corporate Use License (Unlimited Users and Printable PDF) |





























