


Report Overview
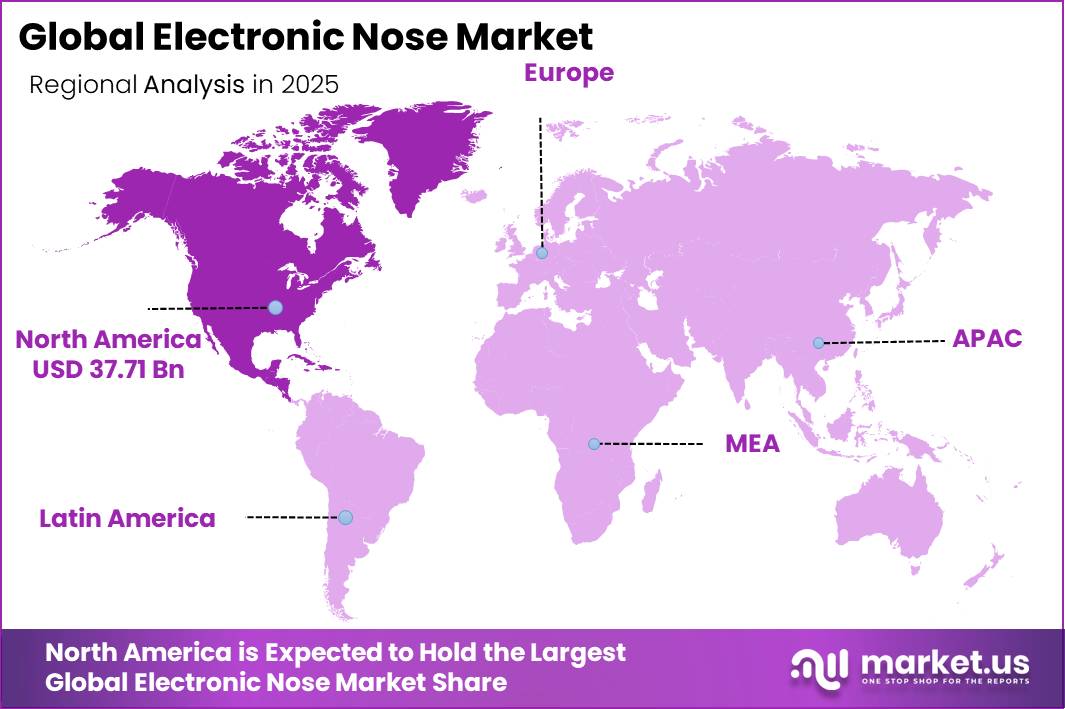
In 2025, the Global Electronic Nose Market was valued at USD 96.2 billion. The market is expected to grow at a CAGR of 11.8% during 2026–2035, reaching approximately USD 292.8 billion by 2035. North America led the global market in 2025, accounting for more than 39.2% of total revenue, with an estimated USD 37.71 billion.
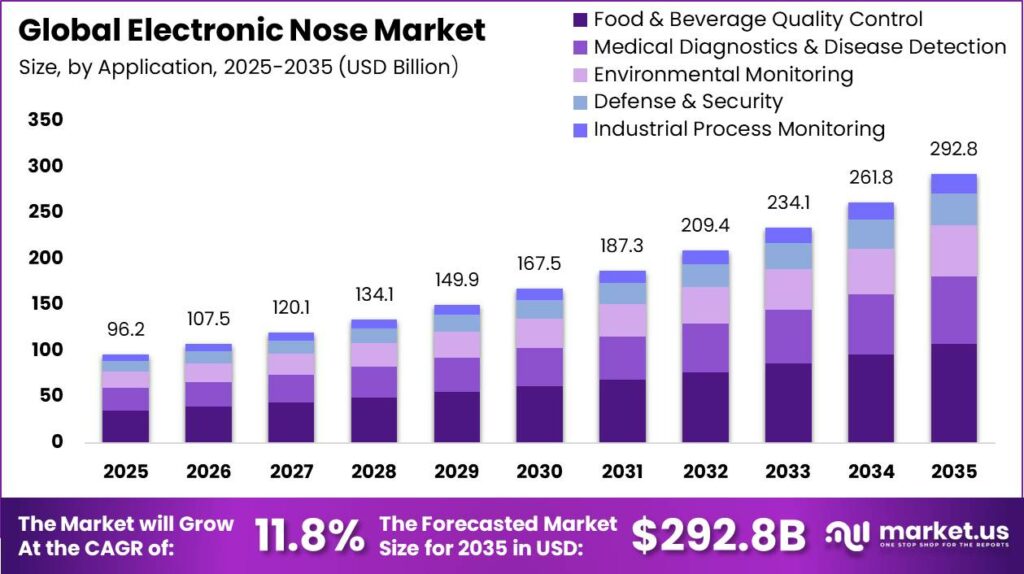
The market is expanding steadily due to growing demand from the food, healthcare, and environmental monitoring industries, where accurate odor and gas detection is becoming increasingly important. According to the FAO, the global harvested area for major crops reached about 1.5 billion hectares in 2024, while cereal production increased to around 3.1 billion tonnes.
The FAO also reports that primary crop production reached 9.6 billion tonnes and the global agricultural sector generated approximately USD 3.8 trillion in value, highlighting the increasing need for automated quality control, freshness testing, and contamination detection using electronic nose systems. In healthcare, high spending on medical services is encouraging the adoption of advanced diagnostic technologies.
Germany spent about EUR 489 billion, or 12.6% of GDP, on healthcare, supporting greater use of non-invasive tools such as electronic noses for breath analysis and disease detection. North America maintains its leading position because of its strong industrial base. The USDA reports more than 42,700 food and beverage manufacturing facilities and 1.7 million workers in the sector, creating consistent demand for electronic nose systems for air quality monitoring, leak detection, and product odor inspection across production and storage facilities.
Key Takeaway
- The Electronic Nose Market was valued at USD 96.2 billion in 2025 and is projected to reach USD 292.8 billion by 2035, growing at a CAGR of 11.8%.
- Metal-Oxide Semiconductor (MOS) Sensors led the technology type segment with a 41.30% market share in 2025.
- Food & Beverage Quality Control was the leading application, contributing 36.8% of the global market.
- Sensor Modules accounted for the largest component share at 52.6%, driven by their central role in odor detection.
- Standalone Devices dominated the deployment mode segment with a 48.2% market share.
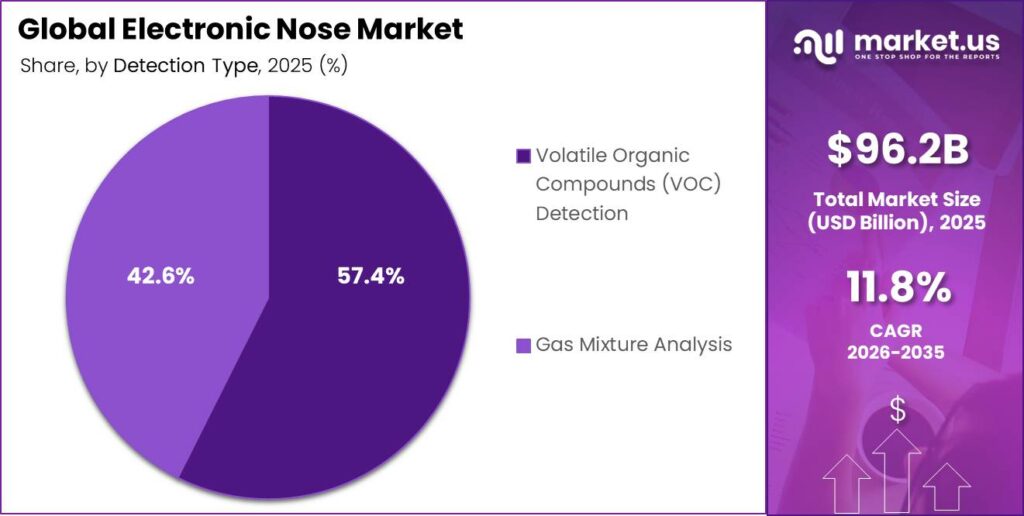
- Volatile Organic Compound (VOC) Detection represented the largest detection type, capturing 57.40% of the market.
- AI & Machine Learning-Based Pattern Recognition led the technology integration segment with a 44.1% share, supporting higher detection accuracy and data analysis.
- North America dominated the market in 2025, accounting for 39.2% of global revenue, equivalent to approximately USD 37.71 billion.
Technology Type
MOS sensors are expected to account for around 41.30% of electronic nose sensor deployments in 2026, reflecting their strong position in low-cost gas sensing and volatile organic compound (VOC) monitoring. In the broader gas sensing market, MOS sensors typically represent 50–60% of total shipment volumes because of their low cost, mature manufacturing base, and proven reliability. A similar, although slightly lower, share is expected in the specialized electronic nose market.
Typical MOS-based electronic nose modules are priced between USD 200 and USD 800 for multi-sensor boards, while complete industrial electronic nose systems generally cost between USD 2,000 and USD 5,000 per unit. Adoption is highest in food processing and industrial facilities, where MOS-based electronic noses are estimated to be installed in 20–30% of large plants in developed markets, compared with less than 5–10% in emerging economies.
In many electronic nose systems, MOS sensors account for 60–70% of the sensing channels within a sensor array, forming the foundation of calibration models and creating higher switching costs because changing sensor technology requires retraining detection algorithms. Device utilization is also high, with a large food processing plant typically performing 5–10 readings per production line per day, resulting in thousands of measurements per device every year.
Application
Food and beverage quality control is expected to account for 36.80% of the global electronic nose application market in 2026, making it the largest application area because of its clear economic benefits and widespread industrial use. Around 20–30% of large food processing plants in developed markets have already adopted or tested electronic nose systems for spoilage detection, flavor profiling, and packaging integrity.
Typical implementation projects range from USD 50,000 to USD 300,000 per facility, including 5–15 devices per site along with software integration and installation services. These systems are used multiple times during each production run, helping manufacturers reduce spoilage and off-specification batches by 10–20%, which can prevent costly product recalls. The segment is expected to grow at a 12–16% CAGR, supported by increasing adoption among mid-sized manufacturers, although global penetration remains below 15–20% of large food plants, leaving considerable room for future expansion.
Medical diagnostics and disease detection are expected to record the fastest growth. Although hundreds of research studies have explored breath analysis applications, only 5–10% have advanced into commercial or pre-commercial products. Electronic nose diagnostic systems are typically priced between USD 20,000 and USD 80,000, with hospitals and clinics usually deploying 1–5 devices capable of performing dozens of tests per day.
Component
Sensor modules, including sensor arrays, front-end electronics, and related hardware, are estimated to account for 52.6% of total electronic nose revenues, reflecting the hardware-focused nature of the current market. In a standard commercial electronic nose, 40–60% of the bill of materials is typically allocated to the sensor and front-end module, and vendors often generate a similar share of revenue from hardware sales, particularly in industrial and food and beverage applications.
Shipment volumes vary significantly, with specialized OEMs supplying only tens or hundreds of units per year, while established manufacturers can ship low tens of thousands of units annually across multiple industries. The segment is expected to grow at a 12–15% CAGR, supported by demand for new sensor materials, replacement hardware, and expansion into regions with lower automation levels.
Software and pattern recognition systems are expected to be the fastest-growing component segment. Software is commonly sold through licenses or subscription models, with annual recurring revenue representing 20–40% of the total contract value over the lifetime of the device. Typical software contracts range from USD 10,000 to USD 100,000 per year for each customer, depending on the number of devices, users, and advanced features such as cloud analytics, predictive maintenance, and MES or LIMS integration. In advanced deployments, each device can process dozens to hundreds of measurements per day, continuously improving AI-based detection models. T
Deployment Mode
Standalone devices currently likely hold around 48.20% of e-nose deployments, reflecting the historical pattern where early systems are self-contained instruments used in labs, QC rooms, or clinical environments. These devices often include local displays, on-board storage, and limited connectivity, making them easy to deploy without major IT integration. Typical unit prices can range from 5,000–50,000 USD depending on sensitivity, channel count, and application (with industrial safety and medical versions at the higher end).
Growth for standalone devices is moderate, likely in the 10–13% CAGR band, as they face competition from more integrated, IoT-enabled architectures. While there is still demand in settings that value simplicity and isolation (e.g., small labs, early-stage pilots, cost-constrained facilities), larger enterprises increasingly prefer systems that feed data directly into their digital infrastructure.
Over time, the share of standalone devices may decline toward 30–40% as integrated systems proliferate, even if absolute unit volumes continue to rise. Standalone devices remain important as entry-level solutions and in markets where connectivity or data governance concerns limit cloud adoption.
Integrated, IoT-enabled e-nose systems likely account for around 30–35% of current deployments but are the fastest-growing deployment mode. These systems connect sensors to local gateways or the cloud, integrate with SCADA/MES/LIMS in industrial settings, and with hospital information systems or research data platforms in healthcare.
Typical projects can involve 5–20 devices networked across a plant or campus, with total deal sizes in the 100,000–500,000 USD range including connectivity, integration, and analytics. Data volumes are substantial; a single integrated deployment could generate tens of thousands of readings per month, supporting advanced predictive and anomaly detection models.
Detection Type
Volatile Organic Compound (VOC) detection accounts for approximately 57.4% of total electronic nose usage and revenue, making it the leading detection type. Most applications, including food freshness testing, spoilage detection, industrial emissions monitoring, indoor air quality assessment, and breath analysis, rely on VOC profiling. Typical VOC-focused electronic noses include 5–32 sensing channels, while a single industrial device can generate hundreds to thousands of VOC pattern readings per week for AI-based analysis.
The segment is expected to grow at a 13–16% CAGR, supported by increasing use in logistics, retail, smart buildings, and environmental monitoring. Over the coming decade, an estimated 10–20% of factories and commercial buildings in advanced markets are expected to adopt multi-gas or VOC-capable electronic nose systems.
Typical gas mixture analysis systems are priced between USD 20,000 and USD 80,000 per unit and are commonly bundled with advanced calibration and analytics services. Each measurement captures dozens of sensing parameters, allowing every deployment to generate tens or hundreds of thousands of multidimensional data points per year, providing richer datasets for advanced AI-based analytics and process optimization.
Technology Integration
AI and machine learning-based pattern recognition likely underpin around 44.10% of commercial e-nose deployments, especially those targeted at complex classification tasks in food, industrial, and early medical applications. Many modern e-nose systems rely on supervised learning models (e.g., SVMs, random forests, basic neural networks) trained on thousands to tens of thousands of labeled samples to distinguish between odor profiles.
For a typical deployment, a vendor might build models using 5,000–50,000 historical measurements, achieving classification accuracies in the 80–95% range for specific tasks under controlled conditions. AI/ML components often account for 20–40% of the perceived value in these solutions, even if they do not yet generate the majority of revenue directly.
Growth in AI/ML-based pattern recognition is strong, likely in the 16–20% CAGR band, as more deployments shift from simple thresholding to model-based classification and prediction. AI integration tends to increase as datasets grow: once an e-nose has been in use for 1–2 years, operators often move beyond simple rules to more sophisticated analytics to reduce false alarms and improve specificity.
This creates a reinforcing loop: better models lead to more trust and usage, which create more data for further model improvement. However, AI adoption is not uniform; some lower-end systems still rely on simpler methods due to cost or expertise constraints. Over the next 5–7 years, it is plausible that 60–70% of e-nose deployments will incorporate some form of ML-driven analytics, with AI becoming a de facto standard.
Key Market Segments
Technology Type
- Metal-Oxide Semiconductor (MOS) Sensors
- Conducting Polymer Sensors
- Quartz Crystal Microbalance (QCM) Sensors
- Surface Acoustic Wave (SAW) Sensors
Application
- Food & Beverage Quality Control
- Medical Diagnostics & Disease Detection
- Environmental Monitoring
- Defense & Security (Explosives/Detection)
- Industrial Process Monitoring
Component
- Sensor Modules
- Software & Pattern Recognition Systems
- Data Processing Units
Deployment Mode
- Standalone Devices
- Integrated Systems (IoT-enabled e-noses)
Detection Type
- Volatile Organic Compounds (VOC) Detection
- Gas Mixture Analysis
Technology Integration
- AI & Machine Learning-Based Pattern Recognition
- Deep Learning-Enhanced Olfactory Systems
Regional Analysis
North America dominated the global electronic nose market in 2025, accounting for 39.2% of total revenue, equivalent to approximately USD 37.71 billion. The region leads the market due to its advanced research ecosystem, strong presence of sensor manufacturers and AI-based analytics providers, and early adoption of electronic nose technologies across healthcare, food and beverage, environmental monitoring, and defense applications.
Strict regulations for air quality monitoring, contamination detection, and workplace safety, together with high levels of industrial automation and digitalization, continue to support large-scale deployment of electronic nose systems across the United States and Canada.
Asia Pacific is the fastest-growing regional market, driven by rapid industrialization and expanding adoption of electronic nose technologies in China, Japan, South Korea, and India. Growing investments in process automation, predictive maintenance, and real-time quality control across the food processing, pharmaceutical, and chemical industries are accelerating market growth.
Key Regions and Countries
North America
- US
- Canada
Europe
- Germany
- France
- The UK
- Spain
- Italy
- Rest of Europe
Asia Pacific
- China
- Japan
- South Korea
- India
- Australia
- Rest of APAC
Latin America
- Brazil
- Mexico
- Rest of Latin America
Middle East & Africa
- GCC
- South Africa
- Rest of MEA
Market Dynamics
Drivers
| Driver | (~) % Impact on CAGR Forecast | Geographic Relevance | Impact Timeline |
|---|---|---|---|
| Food safety quality control adoption | +3.0% | North America, Europe, East Asia | Short term (≤ 2 years) |
| Expansion in medical breath diagnostics | +2.2% | North America, Europe, Asia-Pacific | Medium term (2–4 years) |
| Industrial and environmental odor monitoring | +2.0% | Europe, North America, China | Short term (≤ 2 years) |
| Sensor miniaturization and MEMS platforms | +1.8% | Global | Medium term (2–4 years) |
| AI pattern recognition accuracy gains | +1.5% | Global | Medium term (2–4 years) |
| Agriculture and post-harvest monitoring | +1.3% | Asia-Pacific, Latin America | Long term (≥ 4 years) |
Food safety quality control adoption
Over the 2024–2026 window, tightening food-safety regimes and retailer quality audits have pushed large dairy, meat, and packaged-food processors to integrate electronic noses into in-line quality-control and spoilage-detection workflows, directly shifting procurement from legacy lab-only chromatography toward hybrid sensor–analytics architectures that support higher test frequency at lower marginal cost per batch.
At scale, plants handling tens of thousands of tonnes per year can move from sampling 1–2 lots per day to screening 10–20 lots per hour with e-nose arrays, cutting per-test costs by an estimated 30–50% while reducing recalls and write-offs by low single-digit percentage points of cost of goods sold, which supports willingness to pay premium pricing for robust, networkable systems.
This has begun to alter vendor business models from one-off hardware sales toward bundled sensor plus software subscriptions and calibration services, where recurring analytics licenses can represent roughly 20–30% of a system’s lifetime revenue and help lift the sector’s baseline CAGR by around +3.0 percentage points in core food and beverage applications.
Restraints
| Restraint | (~) % Impact on CAGR Forecast | Geographic Relevance | Impact Timeline |
|---|---|---|---|
| High system and integration cost | -2.8% | Global | Short term (≤ 2 years) |
| Limited standardization of test protocols | -1.9% | Global | Medium term (2–4 years) |
| Regulatory validation hurdles in healthcare | -1.7% | North America, Europe | Medium term (2–4 years) |
| Sensor drift and calibration overhead | -1.5% | Global | Short term (≤ 2 years) |
| Competing low-cost gas detection methods | -1.3% | Global | Long term (≥ 4 years) |
| Procurement conservatism in heavy industry | -1.1% | Middle East, CIS, Latin America | Medium term (2–4 years) |
High system and integration cost
Full-featured electronic nose deployments that combine multi-sensor arrays, sampling hardware, and pattern-recognition software typically require upfront capital outlays in the mid five- to low six-figure range per site, once installation, enclosure modifications, and SCADA or manufacturing execution system integration are counted, which makes payback periods of 3–5 years marginal for cash-constrained plants compared with incremental investments in conventional sensors.
At current pricing, integrating e-noses into distributed environmental or industrial safety networks can cost 2–3 times more per monitored point than simpler gas-detection setups, while annual maintenance, calibration, and sensor replacement can reach 10–15% of the original hardware cost, compressing margins for both buyers and vendors and slowing refresh cycles.
This capital intensity acts as a structural restraint on near-term adoption, shaving an estimated 2.8 percentage points off the otherwise achievable CAGR by keeping many mid-size facilities, municipalities, and smaller healthcare institutions on pilot-scale or single-site deployments rather than fleet-wide rollouts through the baseline period.
Challenges
| Challenge | (~) % CAGR Friction Drag | Geographic Relevance | Mitigation Horizon |
|---|---|---|---|
| Algorithm robustness and data bias | -2.4% | Global | Medium term (2–4 years) |
| Complex sensor drift compensation | -2.0% | Global | Long term (≥ 4 years) |
| Lack of skilled chemometrics talent | -1.8% | North America, Europe | Medium term (2–4 years) |
| Integration into legacy plant IT | -1.6% | Global | Short term (≤ 2 years) |
| Field reliability in harsh environments | -1.4% | Middle East, Africa, heavy industry hubs | Long term (≥ 4 years) |
| Interoperability across vendors’ platforms | -1.2% | Global | Medium term (2–4 years) |
Algorithm robustness and data bias
Because electronic nose systems classify complex gas mixtures using pattern-recognition models trained on historical datasets, their performance can degrade when deployed in real-world environments where temperature, humidity, and interferent gases differ from the training conditions, leading to false positives or negatives that undermine user confidence and slow scaling of installations beyond controlled pilots.
Recent miniaturized e-nose prototypes combining MEMS sensor arrays with deep-learning models have reported high laboratory accuracies on specific analytes, but even small shifts of a few percentage points in misclassification rates or a 5–10 degree Celsius change in operating temperature can materially affect detection thresholds and require costly on-site retraining or cloud-based model updates.
This structural challenge forces vendors to invest continuously in data collection, domain adaptation techniques, and remote update pipelines, pushing up R&D and support costs by an estimated high single-digit share of revenue and creating a friction drag of roughly 2.4 percentage points on the market’s maximum attainable growth until more robust, generalizable algorithms are widely proven in the field.
Opportunities
| Opportunity | (~) % Potential CAGR Upside | Geographic Relevance | Execution Window |
|---|---|---|---|
| Subscription-based cloud odor analytics | +2.6% | Global | Medium term (2–4 years) |
| Wearable and consumer air-quality devices | +2.1% | North America, Europe, East Asia | Long term (≥ 4 years) |
| Adjacency into smart building management | +1.9% | Global urban centers | Medium term (2–4 years) |
| Defense and security trace detection | +1.7% | North America, Europe, Middle East | Long term (≥ 4 years) |
| Agritech disease and spoilage platforms | +1.6% | Asia-Pacific, Latin America | Long term (≥ 4 years) |
| Cross-industry data marketplaces | +1.4% | Global | Long term (≥ 4 years) |
Subscription-based cloud odor analytics
This opportunity remains largely untapped because most installed electronic noses still operate as site-specific instruments with local pattern libraries, whereas cloud-connected fleets could pool millions of sensor-hours of odor fingerprints from food plants, wastewater facilities, and urban air-quality monitors into shared models, enabling differentiated subscription tiers for anomaly detection, benchmarking, and predictive maintenance.
Shifting from a pure hardware sale with occasional calibration fees to a per-sensor or per-facility analytics subscription can reshape unit economics: recurring software margins in the 60–80% range versus hardware margins in the 25–40% range, plus a potential 10–20% reduction in per-user support costs as centralized models improve automatically from aggregated data.
For vendors that successfully execute this cloud and data-platform play over the next 2–4 years, the model could add roughly 2.6 percentage points of CAGR upside above the current baseline by unlocking new revenue per deployed device, extending asset lifetimes via software upgrades, and creating stickier, multi-year contracts that capture a greater share of the addressable monitoring and compliance spend without relying on higher hardware prices.
Geopolitical Impact Analysis
Geopolitical tensions are tightening the electronic nose supply chain because these systems depend on imported sensor arrays, MEMS/semiconductor ICs, precision gas-sensitive materials, and calibrated enclosures that typically move by sea. UNCTAD says disruptions around the Suez and Panama chokepoints cut Gulf of Aden tonnage by 76% and Suez tonnage by 70% by mid-2024, while rerouting around the Cape of Good Hope lifted ton-mile demand by 3% and container ship demand by 12%; for electronic nose makers, that translates directly into longer lead times for sensor substrates, MCU boards, and calibration gases, plus higher freight, insurance, and working-capital needs.
Pricing pressure is rising as shipping inflation and energy volatility feed into factory costs. UNCTAD projects a 0.6% increase in global consumer prices by 2025 from higher shipping costs, with small island developing states facing a 0.9% rise; that matters for electronic noses because the market is still cost-sensitive and often assembled in Asia, then shipped globally to healthcare, food-quality, and industrial-monitoring buyers.
The IEA also notes higher electricity-price volatility in major industrial economies, including the EU and India, which raises power-cost uncertainty for cleanroom assembly, sensor burn-in, and test-calibration operations that are electricity-intensive. At the same time, WTO reporting indicates that increased tariffs are dampening trade in 2025 and 2026, reinforcing a trend toward supplier diversification and regionalized sourcing for chips, printed circuit boards, and specialty polymers used in electronic nose devices.
Key Players Analysis
The global electronic nose market remains highly fragmented, with Tier 1 companies such as Alpha MOS, Aryballe, and AIRSENSE Analytics leading technology development and commercialization. Alpha MOS reported EUR 4.5 million in revenue in 2023, down 22% from EUR 5.8 million in 2022. An estimated 60–70% of its revenue is generated from electronic nose instruments and related services, while the top five companies together are estimated to account for 35–40% of total market revenue.
Aryballe generates an estimated USD 10 million in annual revenue and has secured approximately EUR 17 million in total funding, including a EUR 7 million investment round in 2020 and a EUR 1.1 million French government grant, enabling the company to pursue a high single-digit global market share through OEM partnerships.
Tier 1 companies continue to invest heavily in research, product development, and commercialization rather than large-scale manufacturing. Aryballe is using its EUR 1.1 million government grant to establish a pilot production line for miniaturized odor sensors. Alpha MOS reported a negative EBITDA of EUR 3.8 million on EUR 4.5 million of revenue in 2023, indicating operating and R&D expenses exceeding 70% of revenue as the company continues technology development.
Tier 2 vendors, including E-Nose Pty Ltd and Odotech, generally generate low single-digit million revenues or less, yet collectively account for more than 60% of the industry’s vendor base. No single company is estimated to hold more than a low-teens percentage of the global market, with competition centered on application expertise, AI-based pattern recognition, and industry-specific solutions rather than manufacturing scale.
Top Key Players in the Market
- Alpha MOS
- Airsense Analytics
- Odotech
- Sensigent
- Brechbühler AG
- Aryballe Technologies
- Electronic Sensor Technology
- Figaro Engineering
- Smiths Detection
- Bosch Sensortec
- Honeywell
- Siemens
- Bruker
- Flair Systems
- Scentian Bio
Recent Developments
- In May 2025, Alpha MOS exhibited its electronic nose and sensory analysis solutions at the Barcelona Perfumery Congress, showcasing technologies for analyzing the odor, taste, and visual characteristics of raw materials and finished products, reinforcing its position in aroma analytics.
- In September 2025, Alpha MOS announced its 2025 event pipeline, including participation in ASIC 2025 in Lisbon, Portugal, where it planned to showcase its HERACLES electronic nose solution for coffee quality assessment.
Report Scope
| Report Features | Description |
|---|---|
| Market Value (2025) | USD 96.2 Billion |
| Forecast Revenue (2035) | USD 292.8 Billion |
| CAGR (2026-2035) | 11.8% |
| Base Year for Estimation | 2025 |
| Historic Period | 2020-2024 |
| Forecast Period | 2026-2035 |
| Report Coverage | Revenue Forecast, Market Dynamics, Competitive Landscape, Recent Developments |
| Segments Covered | By Technology Type (Metal-Oxide Semiconductor (MOS) Sensors, Conducting Polymer Sensors, Quartz Crystal Microbalance (QCM) Sensors, and Surface Acoustic Wave (SAW) Sensors), By Application (Food & Beverage Quality Control, Medical Diagnostics & Disease Detection, Environmental Monitoring, Defense & Security (Explosives/Detection), and Industrial Process Monitoring), By Component (Sensor Modules, Software & Pattern Recognition Systems, and Data Processing Units), By Deployment Mode (Standalone Devices and Integrated Systems (IoT-enabled e-noses)), By Detection Type (Volatile Organic Compounds (VOC) Detection and Gas Mixture Analysis), By Technology Integration (AI & Machine Learning-Based Pattern Recognition and Deep Learning-Enhanced Olfactory Systems) |
| Regional Analysis | North America – US, Canada; Europe – Germany, France, The UK, Spain, Italy, Rest of Europe; Asia Pacific – China, Japan, South Korea, India, Australia, Singapore, Rest of APAC; Latin America – Brazil, Mexico, Rest of Latin America; Middle East & Africa – GCC, South Africa, Rest of MEA |
| Competitive Landscape | Alpha MOS, Airsense Analytics, Odotech, Sensigent, Brechbühler AG, Aryballe Technologies, Electronic Sensor Technology, Figaro Engineering, Smiths Detection, Bosch Sensortec, Honeywell, Siemens, Bruker, Flair Systems, Scentian Bio |
| Customization Scope | Customization for segments, region/country-level will be provided. Moreover, additional customization can be done based on the requirements. |
| Purchase Options | We have three licenses to opt for: Single User License, Multi-User License (Up to 5 Users), Corporate Use License (Unlimited Users and Printable PDF) |





































