Report Overview
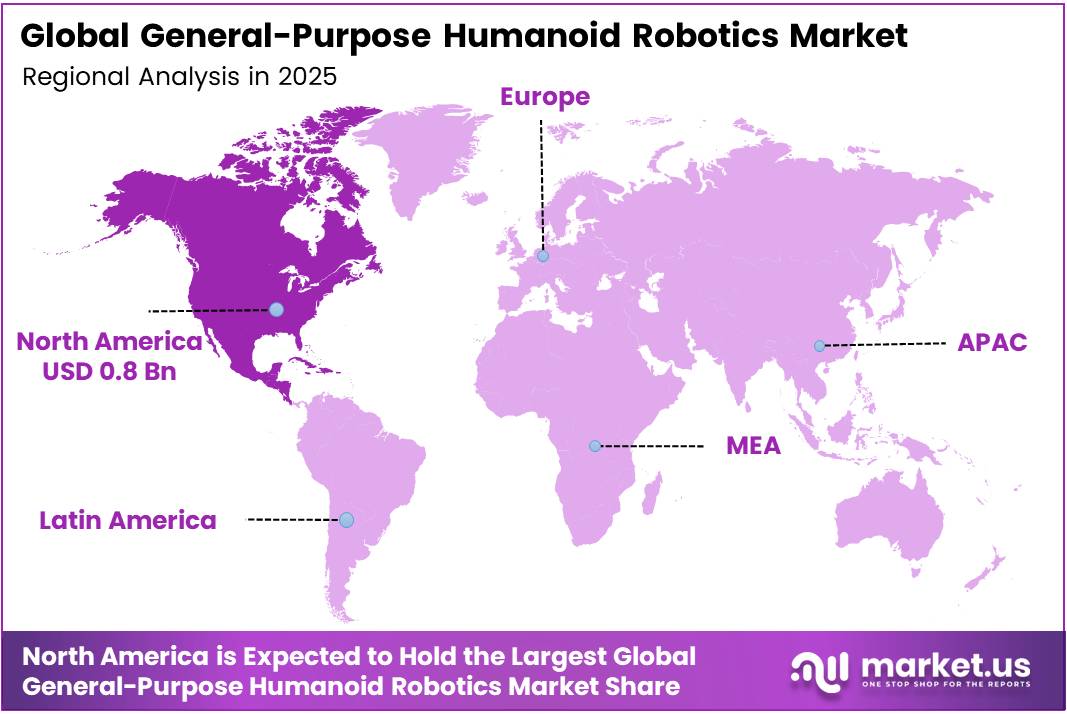
In 2025, the Global General-Purpose Humanoid Robotics Market was valued at USD 1.2 billion. The market is projected to grow at a CAGR of 43.4% during 2026–2035, reaching approximately USD 43.1 billion by 2035. North America dominated the global market in 2025, accounting for more than 63.5% of the total market share and generating approximately USD 0.8 billion in revenue.
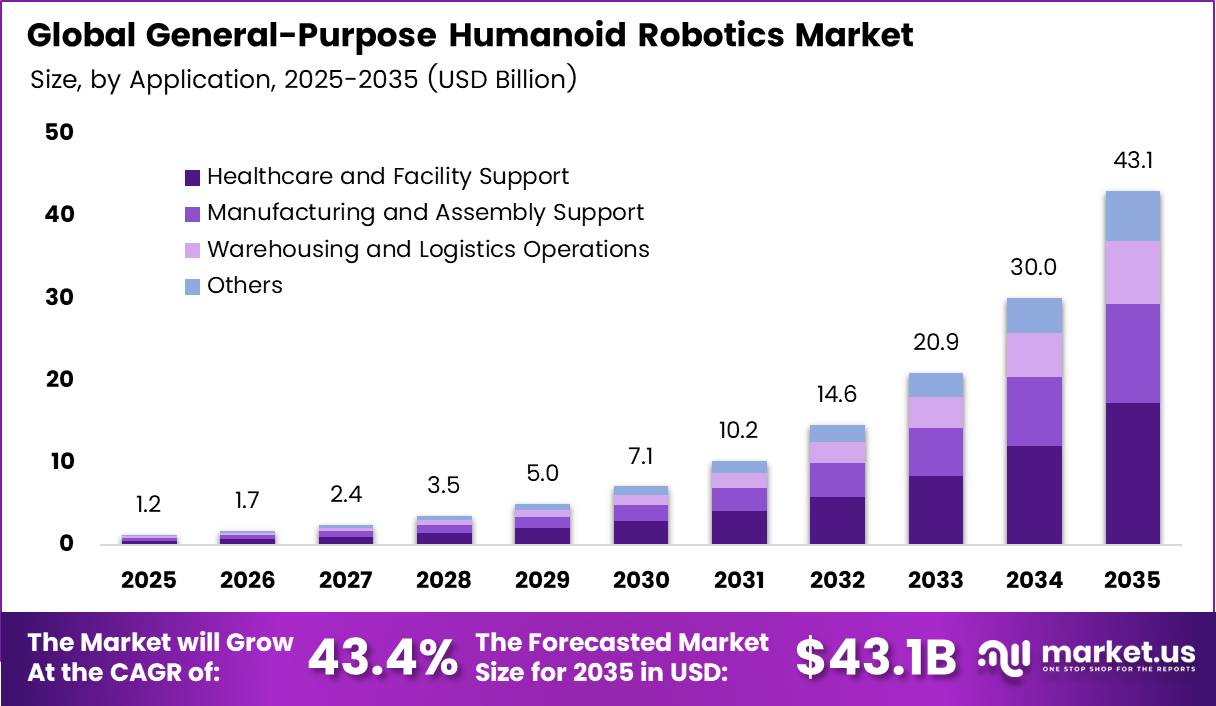
Factory automation gives this market a strong base. The International Federation of Robotics (IFR) reported that the global stock of working industrial robots hit a record 5 million units in 2025, up 9%. Yearly installations rose 11% to more than 600,000 units. These numbers show that factories already trust robots for repetitive tasks.
Humanoids carry this trust into jobs that fixed robot arms cannot do, such as carrying bins across a shop floor or working in spaces built for people. The IFR also counted about 7,000 humanoid robots sold worldwide in 2025 for industrial and service use. Labor gaps in warehouses, hospitals, and plants push buyers further toward these machines.
The North America region combines deep private capital, large industrial buyers, and strong AI chip supply. Hyundai Motor Group plans to invest USD 26 billion in the United States over four years from 2025, including a new robot factory.
Tesla’s FY2025 Form 10-K states that the company plans capital spending above USD 20 billion in 2026, driven by AI and new production lines. Figure AI reported about 740 robots in operation by November 2026, up from just over 100 at the end of 2025. These moves give US buyers early access to working robot fleets.
Key Takeaways
- The General-Purpose Humanoid Robotics Market reached USD 1.2 billion in 2025 and will reach USD 43.1 billion by 2035. grow at a CAGR of 43.4% from 2026 to 2035.
- By product type, Quadruped-like Legged Base with Humanoid Upper Body leads with a 27.9% share.
- By application, Healthcare and Facility Support lead with a 29.6% share.
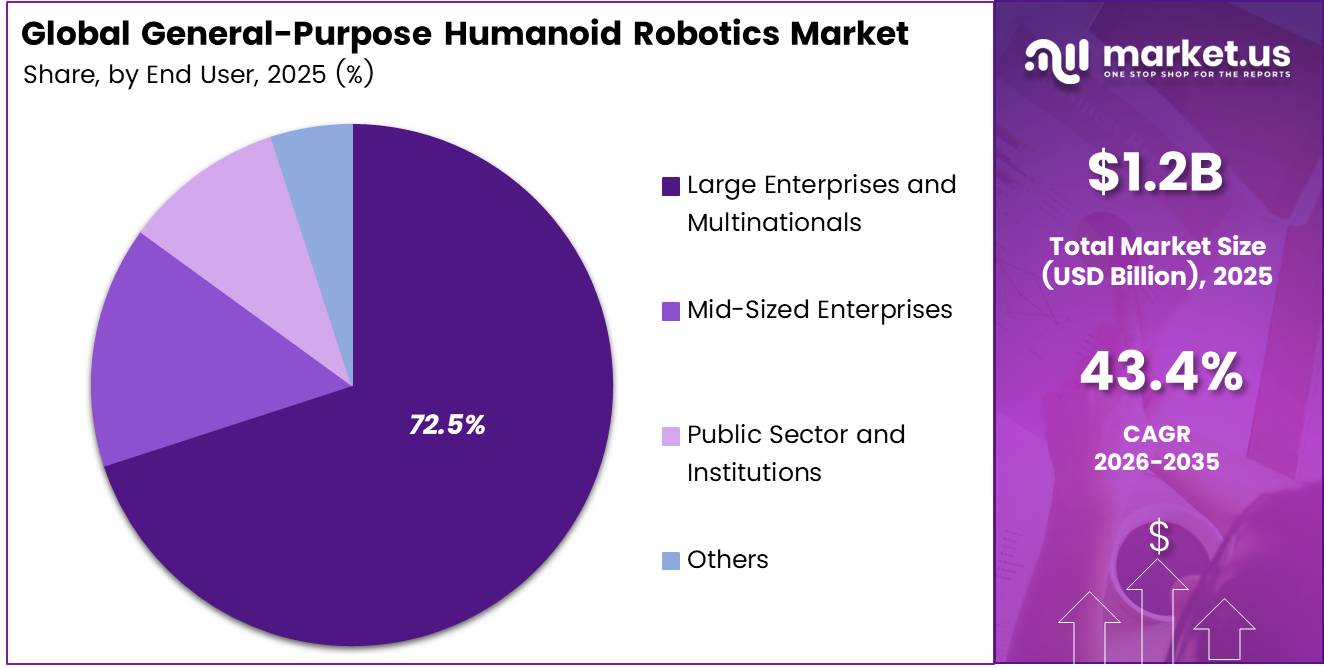
- By end user, Large Enterprises and Multinationals lead with a 72.5% share.
- North America dominates with a 63.5% share and USD 0.8 billion in revenue.
By Product Type
Quadruped-like Legged Base with Humanoid Upper Body dominates with 27.9% due to stable movement across rough factory floors.
Buyers pick the four-legged base with a human-like upper body because it stays balanced while its arms do skilled work. Factories already rely on robots on a large scale. Global industrial robot installations reached 603,307 units in 2025, and the operational stock hit a record 5,079,078 units.
Bipedal Walking is the fastest-growing type because two-legged robots fit spaces built for people: stairs, narrow doors, and existing workstations. China installed 354,226 industrial robots in 2025, which is 59% of the global total. That shows how quickly large buyers scale up once a design proves itself. As balance software improves, more buyers move pilot bipedal robots into real production.
By Application
Healthcare and Facility Support dominates with 29.6% due to constant staff shortages in care sites.
Hospitals, care homes and large facilities use humanoid robots for routine work such as fetching supplies, cleaning and patrol rounds. These sites run around the clock, so a robot that covers repetitive tasks frees nurses and staff for patient care. That direct labour benefit keeps healthcare and facility support in first place.
Warehousing and Logistics Operations is growing fastest because the work is repetitive, physical, and huge in volume. US warehousing and storage employed about 1,839,200 workers in October 2026. In the same sector, 457,740 people worked as stock clerks and order fillers, and 433,060 worked as hand freight and material movers in 2025.
The number of private warehouse sites rose to 23,848 in early 2026. More sites mean more demand for flexible machines that can pick, carry, and sort without rebuilding the whole building.
By End User
Large Enterprises and Multinationals dominate with 72.5% due to large budgets for early-stage pilots.
Big companies lead because humanoid robots still cost a lot and need skilled teams to set up, test, and maintain them. Multinationals can run pilots across many plants at once and spread the cost over several sites. They also have the data systems needed to connect robots to existing operations.
Automation demand in the leading economies supports this lead. US robot installations rose 12% to 38,428 units in 2025, while Japan installed 36,219 units. Public Sector and Institutions is the fastest-growing user group, as governments, universities, and public hospitals fund robotics programmes to build national skills.
India installed almost 10,500 robots in 2025, up 15%, and its installations grew 27% a year on average from 2020 to 2025. Steady public support for automation like this opens new routes for humanoid trials in labs, hospitals, and public services.
Key Market Segments
By Product Type
- Quadruped-Like Legged Base with Humanoid Upper Body
- Bipedal Walking
- Wheeled Base with Humanoid Upper Body
- Others
By Application
- Healthcare and Facility Support
- Manufacturing and Assembly Support
- Warehousing and Logistics Operations
- Others
By End User
- Large Enterprises and Multinationals
- Mid-Sized Enterprises
- Public Sector and Institutions
- Others
Geopolitical Impact Analysis
Rare earth magnets are the biggest pressure point for humanoid makers. Every robot joint uses compact motors built with neodymium magnets. The IEA reported that China made 94% of the world’s sintered rare earth magnets in 2024. In April 2025, Beijing put export licenses on 7 heavy rare earths, and in October 2025 it added 5 more. China’s magnet exports fell 74% year over year in May 2025, and shipments to the US dropped 93%.
Tariffs raise the cost of every imported part. In April 2025, US tariffs on Chinese goods reached triple-digit levels of up to 145%, which hit sensors, gearboxes, batteries and wiring sets. The WTO reported that trade-restrictive measures now cover a record 21.3% of world imports. This pushes robot builders to pay more or to qualify slower suppliers outside China.
Shipping routes add delays to the hardware supply chain. UNCTAD reported that Suez Canal tonnage stayed about 70% below the 2023 average in May 2025. Ships now sail around the Cape of Good Hope, which adds roughly 10 to 14 days to Asia-to-Europe voyages. Longer transit ties up inventory of actuators and battery packs, and it delays pilot fleet deliveries to European plants.
Energy shocks add more cost risk. The WTO found that Middle East LNG exports fell 47% in the first half of 2026 after the Gulf conflict began. Higher power prices raise costs for magnet sintering and for aluminum used in robot frames. Even so, the WTO raised its 2026 merchandise trade growth forecast to 3.9%, helped by demand for AI goods. AI chips for robot brains keep moving, while magnet and motor supply stays tight.
Regional Analysis
North America dominates the General-Purpose Humanoid Robotics Market, holding a 63.5% share and generating USD 0.8 billion in revenue. The US sets the pace because it brings together money, factories, and AI talent in one place. Tesla plans a first Optimus production line before the end of 2026, with a long-term goal of 1 million robots per year.
Figure AI built its BotQ plant to make up to 12,000 humanoids each year. Agility Robotics runs a factory in Salem, Oregon, designed to produce more than 10,000 robots a year. Hyundai Motor Group is building a US plant that can make 30,000 robots a year by 2028.
Hyundai Mobis will add an actuator plant with yearly capacity of 350,000 units, and actuators make up about 60% of a robot’s material cost. Buyers also help the region lead. Automakers, chipmakers and third-party logistics firms run large sites with labor gaps and repetitive tasks. These companies can test robots at scale and then sign multi-year deals.
Canada adds strength through AI research hubs in Toronto, Montreal and Vancouver, and Toyota Motor Manufacturing Canada already uses humanoid robots in its plants. Funding keeps flowing, too. Robotics startups raised nearly USD 14 billion in 2025, up from USD 8.2 billion in 2024, and US firms took the largest part of that capital.
Asia Pacific is the fastest-growing region in the market. China leads the region’s factory base, installing 59% of all industrial robots worldwide in 2025, with installations up 20%. India installed almost 10,500 robots in 2025, up 15%, and its installations grew 27% a year on average from 2020 to 2025. The WTO expects Asia’s merchandise imports to grow 9.5% in 2026, the fastest of any region.
Europe holds a solid third position, built on deep engineering skills and strong safety rules. Germany ranks third in the world for robot density, even though it buys fewer robots than China. NEURA Robotics in Germany reported an order book of EUR 1 billion. The WTO expects Europe’s merchandise imports to grow only 0.5% in 2026, which slows capital spending.
Key Regions and Countries
North America
- US
- Canada
Europe
- Germany
- France
- The UK
- Spain
- Italy
- Rest of Europe
Asia Pacific
- China
- Japan
- South Korea
- India
- Australia
- Rest of APAC
Latin America
- Brazil
- Mexico
- Rest of Latin America
Middle East and Africa
- GCC
- South Africa
- Rest of MEA
Market Dynamics
Drivers
| Driver | (~) % Impact on CAGR Forecast | Geographic Relevance | Impact Timeline |
|---|---|---|---|
| Embodied AI Foundation Models Maturation | +3.2% | Global, led by North America and China | Short term (2 years or less) |
| State-Backed Humanoid Industrial Policy | +2.6% | China, South Korea, Japan | Short term (2 years or less) |
| Manufacturing and Logistics Labor Scarcity | +2.1% | North America, Europe, East Asia | Medium term (2 to 4 years) |
| Venture and Hyperscaler Capital Inflows | +1.7% | United States, China | Short term (2 years or less) |
| Automotive OEM Pilot Deployments | +1.4% | United States, Germany, China | Short term (2 years or less) |
| Actuator and Battery Cost Deflation | +1.1% | China, Asia Pacific | Medium term (2 to 4 years) |
Embodied AI Foundation Models Maturation
The main driver is the move from task-specific robot programming to general-purpose vision-language-action (VLA) foundation models. Humanoid makers no longer have to build perception and manipulation software from scratch, and per company investor disclosures, this cuts integration engineering time for each new task by roughly 40% to 60%.
In numbers, simulation-first training through synthetic data pipelines turns the cost of collecting physical teleoperation data from a linear, per-task expense into a mostly fixed compute cost. Per NVIDIA earnings call commentary, robotics and automotive revenue grew more than 70% year-over-year in fiscal 2025 quarters.
Model updates delivered over the air can raise gross margin per deployed unit by an estimated 8 to 12 percentage points over the unit’s life, according to robotics OEM investor deck guidance. Per IFR World Robotics data, operational industrial robot stock passed 4.2 million units in 2024, which gives these models a large brownfield base of workflows to retrofit.
Restraints
| Restraint | (~) % Impact on CAGR Forecast | Geographic Relevance | Impact Timeline |
|---|---|---|---|
| High Unit Acquisition Cost | -2.0% | Global, acute in SME segments | Medium term (2 to 4 years) |
| Rare Earth Magnet Export Controls | -1.5% | United States, Europe, Japan, India | Short term (2 years or less) |
| US-China Tariff and Technology Restrictions | -1.2% | United States, China | Short term (2 years or less) |
| Elevated Cost of Capital | -0.8% | Europe, Emerging Markets | Short term (2 years or less) |
| Workplace Safety Certification Gaps | -0.7% | European Union, North America | Medium term (2 to 4 years) |
High Unit Acquisition Cost
The root cause is the hardware bill of materials. A full-size general-purpose humanoid needs 28 to 40 high-torque actuators, each with a precision reducer, frameless torque motor, encoder, and driver. Per supplier annual reports from Harmonic Drive Systems and Chinese reducer makers, actuation alone makes up roughly 50% to 60% of total BOM cost.
This creates a payback bottleneck. Western full-size platforms still carry estimated landed prices of $90,000 to $150,000 per unit, while U.S. Bureau of Labor Statistics data puts fully loaded warehouse labor cost at about $45,000 to $60,000 per year.
At current uptime of about 70% to 80% of human throughput, payback stretches past 36 months, above the 18 to 24 month hurdle that Association for Advancing Automation member surveys report for most automation CapEx.
The result is that buyers delay capital spending. Fleet orders stay stuck at pilot volumes of 5 to 20 units per site. OEMs, in turn, take hardware gross margins that are near zero or negative to secure reference accounts, a pattern visible in disclosures from Hong Kong-listed Chinese humanoid makers. Until per-unit cost falls below about $30,000, adoption by small and mid-sized manufacturers stays mostly blocked.
Challenges
| Challenge | (~) % CAGR Friction Drag | Geographic Relevance | Mitigation Horizon |
|---|---|---|---|
| Dexterous Manipulation Reliability Gap | -1.6% | Global | Long term (4 years or more) |
| Robotics Systems Talent Shortage | -1.0% | North America, Europe, India | Medium term (2 to 4 years) |
| Battery Runtime Limitations | -0.8% | Global | Medium term (2 to 4 years) |
| Precision Component Supply Concentration | -0.7% | Japan, China, Germany | Medium term (2 to 4 years) |
| Data Privacy and Cybersecurity Exposure | -0.5% | European Union, United States | Long term (4 years or more) |
Dexterous Manipulation Reliability Gap
The structural weakness is in the hands, not the legs. Bipedal locomotion has largely been solved through reinforcement learning, but multi-fingered hands with 15 to 22 degrees of freedom still lack tactile sensing density and tendon durability that come close to human performance.
Peer-reviewed benchmarks from IEEE Robotics and Automation Society proceedings show grasp success rates on unseen deformable objects below 80%.
The friction is measurable. Industrial customers usually require 99.5% or higher task success to remove human supervision, and per OEM pilot disclosures from automotive plants run by BMW and Mercedes-Benz, intervention rates of one event every 1 to 2 hours keep a teleoperator-to-robot ratio of about 1:3. Hand assemblies also wear out after an estimated 2,000 to 5,000 operating hours, adding maintenance cost.
Managing this will take long-term corporate changes: vertically integrating tactile sensor and hand design, using modular end-effectors that can be swapped for single-purpose grippers, and offering service contracts that price in fleet-level uptime guarantees. Per IFR and national robotics roadmap guidance from Japan’s METI, closing this reliability gap is likely to take more than 4 years of sustained R&D spending.
Opportunities
| Opportunity | (~) % Potential CAGR Upside | Geographic Relevance | Execution Window |
|---|---|---|---|
| Eldercare and Assisted Living Deployment | +2.2% | Japan, South Korea, Western Europe | Long term (4 years or more) |
| Humanoid Robotics-as-a-Service Models | +1.6% | North America, Europe | Medium term (2 to 4 years) |
| Third-Party Skill App Marketplaces | +1.2% | Global | Medium term (2 to 4 years) |
| Hazardous Environment and Nuclear Operations | +0.8% | Japan, United States, Middle East | Medium term (2 to 4 years) |
| India and Southeast Asia Localized Assembly | +0.7% | India, Vietnam, Thailand | Long term (4 years or more) |
Eldercare and Assisted Living Deployment
Eldercare is still largely unserved. Current humanoid revenue is almost entirely in structured factory and warehouse settings, while unstructured home and care-facility environments stay commercially unaddressed. Per Japan’s Statistics Bureau, about 29% of the population is aged 65 or older. Japan’s Ministry of Health, Labour and Welfare projects a shortfall of about 570,000 care workers by fiscal 2040.
This is a future opportunity rather than a current driver because it depends on deliberate steps not yet taken: reimbursement eligibility under long-term care insurance schedules. Statistics Korea projects South Korea’s 65-plus share will pass 20%, and Eurostat old-age dependency ratios are approaching 33% across the EU.
The unit economics could change sharply. Subscription pricing paid through public care insurance could lift recurring revenue to about 60% to 70% of lifetime value per unit. Based on OEM investor deck benchmarks for service robotics, blended gross margins could expand by 10 to 15 percentage points over hardware-only sales. Per OECD health workforce data, care-shift labor costs above $25 per hour in Western Europe support a robot cost-per-hour target below $10.
Key Players Analysis
Tier 1 leaders have the largest balance sheets and production plans. Tesla, Inc. reported total revenue of USD 94.83 billion in FY2025. It raised R&D spending by 41% to USD 6.41 billion, mostly for AI programs, including Optimus. Tesla ended 2025 with USD 44.06 billion in cash and investments, which lets it fund robot lines without outside capital.
Boston Dynamics, Inc. also sits in Tier 1 through its parent, Hyundai Motor Group. Hyundai bought SoftBank’s remaining stake of about 9.65% and now owns 100% of the company. Hyundai Glovis invested KRW 46.5 billion (USD 34.8 million) to raise its stake to 12.47%. Hyundai plans to deploy 25,000 Atlas robots across its own plants. Figure AI, Inc. joins Tier 1 on capital strength. Its Series B in 2024 raised USD 675 million at a USD 2.6 billion valuation, and the company has raised nearly USD 2 billion in total since 2022.
Tier 2 challengers hold strong niche positions. Agility Robotics, Inc. closed a USD 400 million Series C in 2025 at about USD 2.12 billion. It reports more than USD 300 million in multi-year commitments and more than 65,000 hours of operation across 9 customer sites. Apptronik, Inc. has raised close to USD 1 billion in total capital and works with Mercedes-Benz, GXO and Jabil.
NEURA Robotics GmbH raised EUR 120 million in its Series B in January 2025, after growing revenue 10 times in one year. 1X Technologies AS priced its NEO home robot at USD 20,000 or USD 499 a month, and it sold out a first-year run of more than 10,000 units in 5 days. Sanctuary Cognitive Systems Corporation stays focused on dexterous hands and AI control for industrial clients.
Top Key Players in the Market
- Tesla, Inc.
- Figure AI, Inc.
- Apptronik, Inc.
- Agility Robotics, Inc.
- 1X Technologies AS
- Sanctuary Cognitive Systems Corporation
- Boston Dynamics, Inc.
- NEURA Robotics GmbH
Recent Developments
- In September 2025, Figure AI, Inc. secured more than USD 1 billion in Series C capital at a USD 39 billion post-money valuation to scale BotQ manufacturing and real-world deployments.
- In February 2026, Apptronik, Inc. raised a USD 520 million Series A-X round, taking its total Series A to more than USD 935 million to ramp up production of its Apollo robot.
- In April 2026, 1X Technologies AS began full production at its 58,000-square-foot Hayward, California factory, with first-year capacity of 10,000 NEO units.
- In September 2026, Boston Dynamics, Inc. opened the Robotics Metaplant Application Center at Hyundai Motor Group Metaplant America in Georgia to train Atlas robots, while Hyundai prepares a US plant with capacity for 30,000 robots a year.
- In November 2026, Agility Robotics, Inc. began trading on Nasdaq after merging with Churchill Capital Corp XI at a USD 2.5 billion valuation, raising about USD 465 million in gross proceeds.
Report Scope
| Report Features | Description |
|---|---|
| Market Value (2025) | USD 1.2 Billion |
| Forecast Revenue (2035) | USD 43.1 Billion |
| CAGR (2026-2035) | 43.4% |
| Base Year for Estimation | 2025 |
| Historic Period | 2020-2024 |
| Forecast Period | 2026-2035 |
| Report Coverage | Revenue Forecast, Market Dynamics, Competitive Landscape, Recent Developments |
| Segments Covered | By Product Type (Quadruped-like Legged Base with Humanoid Upper Body, Bipedal Walking, Wheeled Base with Humanoid Upper Body, Others); By Application (Healthcare and Facility Support, Manufacturing and Assembly Support, Warehousing and Logistics Operations, Others); By End User (Large Enterprises and Multinationals, Mid-Sized Enterprises, Public Sector and Institutions, Others) |
| Regional Analysis | North America – US, Canada; Europe – Germany, France, The UK, Spain, Italy, Rest of Europe; Asia Pacific – China, Japan, South Korea, India, Australia, Singapore, Rest of APAC; Latin America – Brazil, Mexico, Rest of Latin America; Middle East & Africa – GCC, South Africa, Rest of MEA |
| Competitive Landscape | Tesla, Inc., Figure AI, Inc., Apptronik, Inc., Agility Robotics, Inc., 1X Technologies AS, Sanctuary Cognitive Systems Corporation, Boston Dynamics, Inc., NEURA Robotics GmbH |
| Customization Scope | Customization for segments and region/country-level will be provided. Moreover, additional customization can be done based on the requirements. |
| Purchase Options | We have three licenses to opt for: Single User License, Multi-User License (Up to 5 Users), Corporate Use License (Unlimited Users and Printable PDF) |